How graph algorithms improve machine learning
A look at why graphs improve predictions and how to create a workflow to use them with existing machine learning tasks.
 Crystals
We’re passionate about the importance of understanding the connections between things. That’s why we work on graph technologies, which help people make use of these connections. It’s also why we wrote the O’Reilly book: Graph Algorithms: Practical Examples in Apache Spark and Neo4j.
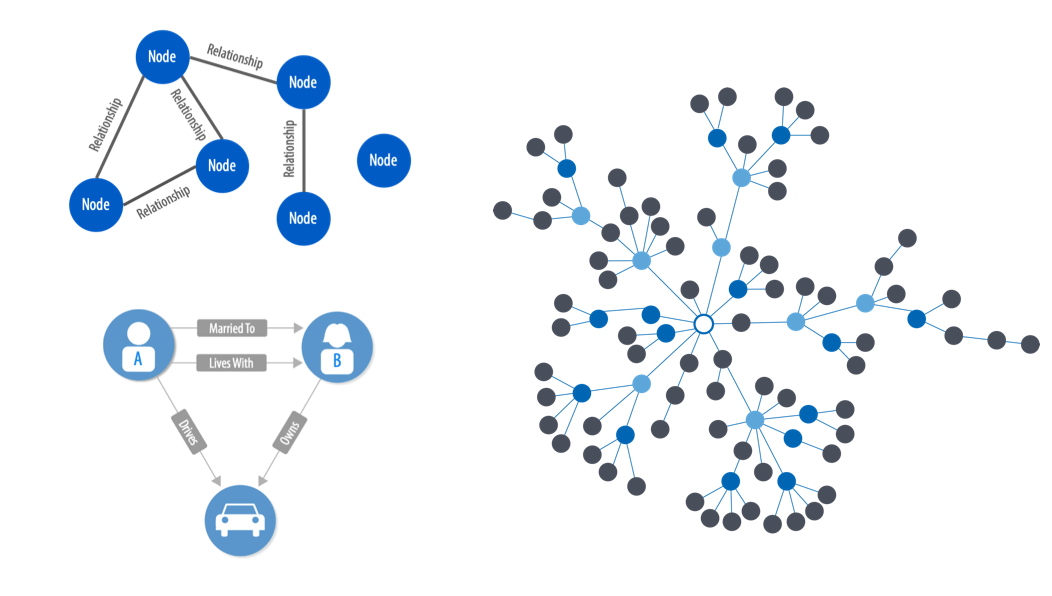
Simply put, a graph is a mathematical representation of any type of network. The objects that make up graphs are called nodes (or vertices) and the links between them are called relationships (or edges.) Graph algorithms are specifically built to operate on relationships, and they are uniquely capable of finding structures and revealing patterns in connected data. Graph analytics vary from conventional statistical analysis by focusing and calculating metrics based on the relationships between things.

Learn faster. Dig deeper. See farther.
In this post, we’ll look at how graph algorithms improve machine learning predictions and provide an example graph machine learning (ML) workflow.
Get more out the data (and process) you already have
More information makes machine learning models more predictive. But it’s a challenge to obtain (let alone cleanse) all the data needed to feel confident in a training model. Relationships are some of the strongest predictors of behavior. So, by incorporating relationship information (already lurking in our data sets), we can add in these highly predictive elements to improve machine learning. We can also supplement an existing machine learning workflow with “graphy” features and improve existing processes.
Feature engineering is how we combine and process data to create new, more meaningful features, such as clustering or connectivity metrics.
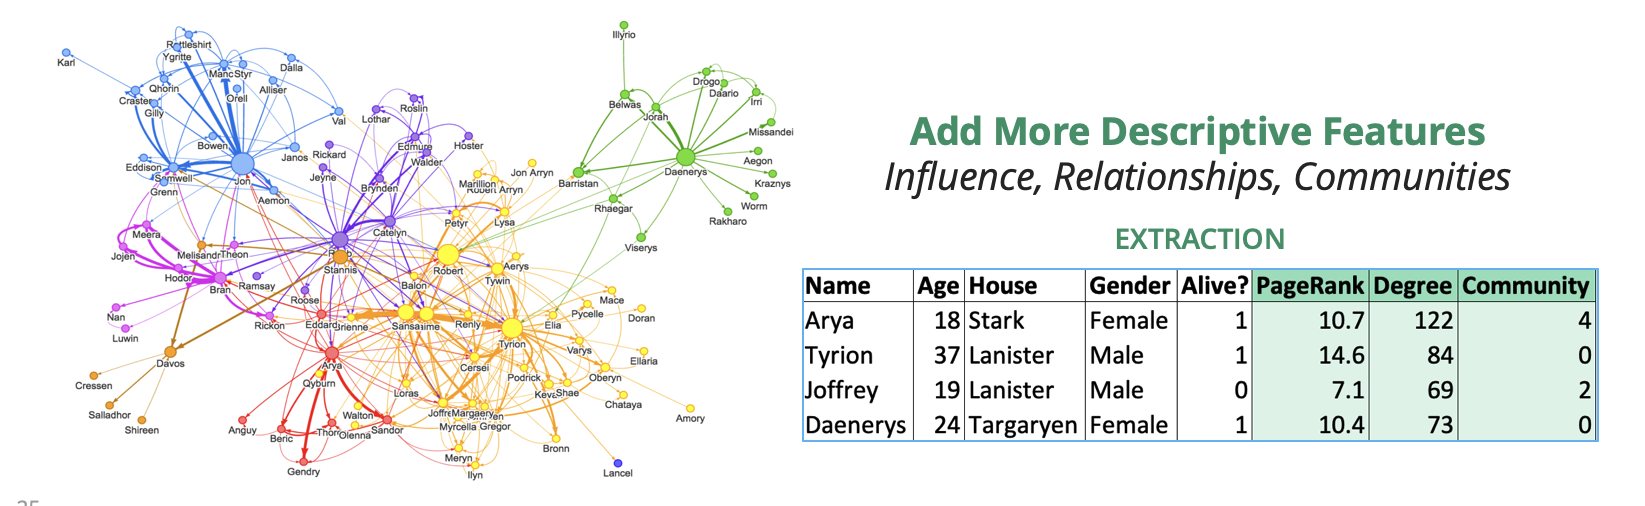
Graph algorithms are often used for feature engineering, to create new predictive elements for training models with the goal of increasing accuracy, precision, and recall rates. Using graph algorithms, we can assign categories based on relationships, calculate centrality, or measure relationships to node data. We can then extract these labels, scores, and measures to feed into machine learning tasks.
For example, Figure 2 shows graph algorithms run on a Game of Thrones network to find the PageRank score for influence, the Degree for connectivity, and Community Detection for group assignment. We can then extract these features to a table, add other information, and try to predict who might still be alive.
Applying a graph machine learning workflow
In building a graph machine learning model, we need to create a workflow that incorporates our data sources, a platform for graph feature engineering, and our machine learning tools. There are several ML tool options, but in this post, we’ll look at using Spark and Neo4j because of their prevalence in the data science and graph communities.
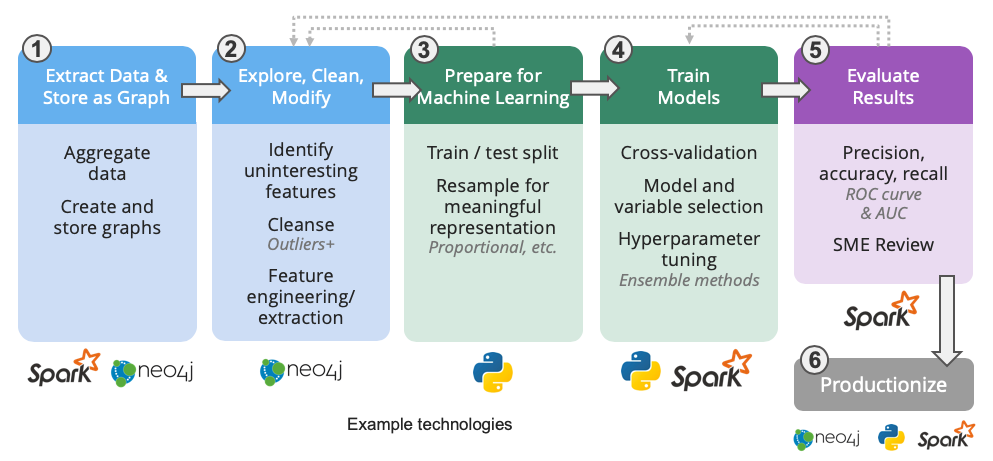
As Figure 3 shows, we start the workflow by aggregating data in Spark and doing basic exploration to confirm the data has relevant connections for whatever we’re trying to model.
Next in step two, we’ll want to shape and store the data as a graph in Neo4j. This allows us to use the exposed relationships in a graph to more easily dive deeper into the data: evaluate more or less interesting elements, check for sparsity, and the like. At this point, we also want to cleanse data by removing outliers, handling missing information, and applying normalization techniques.
Now we’re ready to engineer more predictive features using Neo4j graph algorithms for features such as labels based on community membership, influence ranking measures, and link estimation scores. Once we run the graph algorithms, we can extract the resulting metrics as a table for the learning step as well as write results back to the graph database for persistence and future use.
We also need to prepare the data for machine learning and split it into training and testing data sets (as shown in step three in Figure 3). With any ML workflow, we should always be careful of data leakage, which happens when related information is in both the training and testing data sets. We recommend starting with a time-based split as a cleaner way to segregate data.
Once we’ve split the data, we may notice that it is not proportional. We will need to resample the data to even out representations, using either downsampling or upsampling techniques.
We should note that this workflow is never completely linear, and you should expect to iterate some steps as you learn more and update information. However, once we have the extracted graph features and the data properly split, it’s time for step four: training the model in Spark. In this workflow, we’d use Spark’s machine learning library, MLlib, and perhaps a random forest classifier.
After we’ve trained the model, we need to evaluate our results, as shown in step five in Figure 3, most likely with a domain expert who understands the data itself.
As we mentioned, this process cycles back on itself at many points as we try different models and test different features and algorithms.
Once we are happy with the ML model, we’ll want to use it in production, as shown in the last step in Figure 3. For example, we might build a model that predicts fraud using Neo4j and Spark, and operationalize the model in an online credit application. In most cases, we’re continually updating our models with new information in a cycle to always improve precision and tackle new behavior.
We’ve looked at why graphs improve predictions and how we can create a workflow to use them with existing machine learning tasks. In this post, we focused on some of the initial steps of our workflow because feature engineering and training/test data so greatly impact predictive models. We hope this provides insight into how graphs enhance machine learning and a taste of what’s possible.