How to Build a Budget That Lasts the Full Year
Budgeting can be a drawn-out process, yet oftentimes once the year starts and results diverge, they become forgotten. Instead of budgeting just with qualitative methods, managers should combine them with quantitative tools. Comparing regressed historic trends with future expectations can be more accurate and ultimately ensure the budget survives the year.

Budgeting can be a drawn-out process, yet oftentimes once the year starts and results diverge, they become forgotten. Instead of budgeting just with qualitative methods, managers should combine them with quantitative tools. Comparing regressed historic trends with future expectations can be more accurate and ultimately ensure the budget survives the year.

Erik’s built and managed finance functions for global companies, with responsibilities ranging from reporting to managing capital raises.
Expertise
PREVIOUSLY AT

Executive Summary
Why and How Businesses Set Budgets
- Financial Resource Allocation - The budgeting process is essentially matching what is possible in terms of goals with the financial resources that exist.
- Strategic Plan Support - The company budget process lays out the coordination of departments and set the benchmarks to signal if plans are succeeding.
- Initiative Tracking - New projects are an unknown, thus once the year begins, budgets serve the purpose of tracking chosen initiatives to gauge their success or failure.
- Expense Control - Budgets provide feedback to managers as to their performance and should incentivize them to take corrective actions when necessary.
- There are a number of forecasting approaches that form the basis of budgeting methods. The most prominent ones include bottoms-up, top-down, crowd-sourced, and zero-based methods.
- Qualitative budget methods are characterized by the judgment of the budget owner while quantitative ones are more mathematically based.
The Case for Adding Quantitative Elements
- Adding in quantitative elements allows for more questions to be asked when challenging the assumptions of the budget.
- Often managers look at the previous year and use its growth as the basis for future trends. This ignores seasonality, outliers, and longer-term trends. A quantitative element to your budget can correct this.
- Comparing the historically regressed trend growth to the qualitative budget opens up a conversation as to why the two are different. Why are future expectations different to the objective historic pattern?
- Interrelationships. Regressing elements such as revenue against cost can provide deeper insight into the characteristics of both and how they drive each other.
How You Can Create a Budget That Will Last the Year
- Set a Timeline - While obvious, the timeline should be detailed enough to allow for a budget creation to flow from team to division to the organization.
- Convey Topline Guidance Early - Have a budgeting process that commences with the clarification of all top and bottom line goals, with the information distributed to managers in advance. If expectations are completely different then the budget will need to be created again.
- Team Collaboration - Siloed budgeting runs counter to the goal of a budget rigorously vetting the operational goals of supporting the strategic plan. Encourage collaboration between teams - a salesperson working with a statistician will combine two effective skills together for a better result.
How to Create a Budget That Will Last a Full Year
Budgeting and forecasting is an essential function of a business. From the gut instinct of a small entrepreneur to the complex models of a large multinational, every business has an estimate of how much it will sell and how much it will cost.
The problem is that budgets often become obsolete early in the year, despite sometimes enormous effort spent in preparing them. They then get mothballed, either due to their ineffectiveness or from being a source of embarrassment. A KPMG survey of finance professionals found that 56% of respondents agreed that “at some point during the year, the budget ceased to be relevant.” The same survey also found that 46% of respondents “believe the current budget produces a politically agreed number not aligned to the real business outlook.”
Budgeting is often a bottoms-up affair, where each department is given a template, where they input guesses about the future on a qualitative basis, sometimes with topline goals set by management. The people doing the forecasting are often very experienced at selling, provisioning, operating or hiring, yet have no formal training in forecasting. The changing and uncertain nature of forecasts is a fact of life, but often these biases impact the accuracy of the budget.
In this article, I’ll cover the best practice approach of combining qualitative and quantitative concepts to the budgeting process, which can help lessen the impact of bias. This will provide a structure to vet assumptions and test scenarios, often outside of codified ranges.
Why Do We Budget?
Before we get into adding a new system, let’s review some of the basics of goals and uses of a budget.
- Financial Resource Allocation - Money is the lifeblood of a company. Having enough of it to support operations, new business initiatives and acquisitions is vitally important. The budgeting process is essentially matching what is possible with the resources that exist.
- Strategic Plan Support - The budgeting process should focus on the important steps you must take during the year to support your strategic plan. It should lay out the coordination of the departments and set the benchmarks to signal if the plan is succeeding.
- Initiative Tracking - New initiatives are often the basis for growth. As they are an unknown territory, the assumptions made for revenues and costs usually have a wider range of possibilities. Once the year begins, the budget serves the purpose of tracking chosen initiatives to gauge their success or failure.
- Expense Control - Budgets provide feedback to managers as to their performance and should incentivize them to take corrective actions when necessary, and identify overperformance and possible opportunities.
Some Basic Budgeting Best Practices
Before we get into an example of adding a quantitative methodology, I want to go over some best practices for budgeting in general. While certainly not exhaustive, I have found that these steps will save time and resources by reducing budget iterations and improving department coordination.
- Set a Timeline - While obvious, the timeline should be detailed enough to allow for individual department budgeting, cross-departmental reviews and consolidated working budget reviews. I have seen companies doing budget consolidation reviews only days before a board meeting.
- Convey Topline Guidance Early - Having a budgeting process commence by clarifying all top and bottom line goals and distributing the information to managers can save a lot of time later in the process. As a recent example, a COO told me about having done a budget with 8% growth, but the firm’s PE investor wanted to see 20%, so they had to go through the whole process again.
- Team Collaboration - Siloed budgeting runs counter to the goal of a budget rigorously vetting the operational goals of supporting the strategic plan. Marketing, Sales, Product, HR, and Operations all rely on each other’s functions. Cross-team meetings early on with defined agendas and shared assumptions are helpful in this regard.
Types of Budgeting Methods
Forecasting approaches can include bottoms-up, top-down, crowd-sourced, and zero-based methods, to name a few. Methodologies for each can be broken down into whether they are qualitative or quantitative. Qualitative is marked by the judgment of the budget owner while quantitative is more mathematically based. Consequently, both qualitative and quantitative forecast methodologies each have their respective strengths and weaknesses.
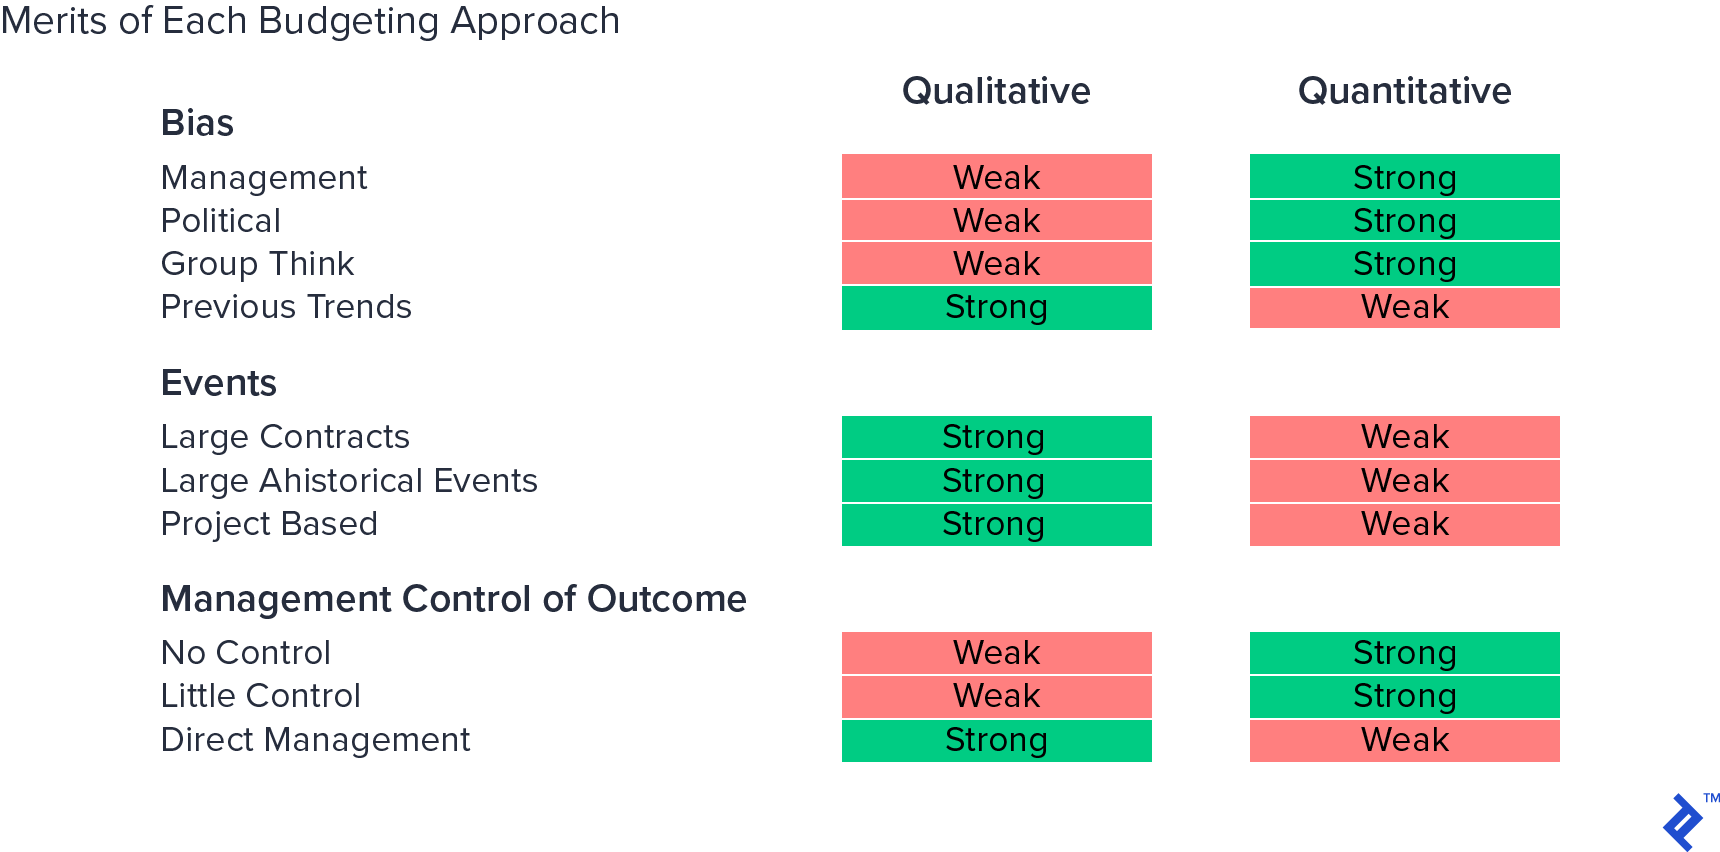
Bias can significantly impact the usefulness of budgeting techniques, so it is important to consider the political aspects of a method. Whether it’s a salesperson’s need to “‘game the system”’ to increase the odds for hitting the bonus or senior management needing to hit targets to appease investors, bias will often strain the budgeting process.
Simple quantitative methods have their weaknesses as well. With a recent client of mine, during its budget, it was using the previous year’s average monthly percentage growth to forecast product sales. While this is a very reasonable approach, I did point out that percent growth fell during the year. Using that full-year average could lead to a systematic aggressive forecast if the trend should continue or even level off.
In my opinion, quantitative processes are the superior choice for combining with qualitative processes, as they help to error check assumptions based on the problems above. I recommend a quantitative basis as it is quick and relatively unbiased. It also explores the company’s “function-defining” relationships between spending and revenue, as well as growth trends. Such methods are also more useful for scenario planning and can be a good basis for benchmarking and rolling forecasts.
The Case for Using Both Quantitative and Qualitative Methods
Using just one additional budgeting technique can extend the relevance of your forecast, by acting as a check on the other. I also believe it is important to choose a methodology that can challenge the other and compensate for its blind spots. I have found using a quantitative forecasting technique to be extremely valuable when evaluating a qualitative forecast, especially in an iterative environment.
Different methodologies have different costs and time requirements. Yet in this day and age, we are seeing data science play an increasing role in building and maintaining prediction tools that help to reduce the time required to parse through scenarios.
Incorporating a quantitative method, such as trend or econometric analysis, is one way to strip bias from projections. These methods can identify what is speculative in a forecast and provide scenarios outside of group-think ranges. They can offer a guideline and help start a discussion about what must change to reach the forecast target. Statistical methods rely on the quality of the underlying data and can be augmented by solid objective thinking.
They can though, be sophisticated and a little “black boxy” if you aren’t familiar with how they work. Unadjusted, they also do not deal well with large shifts in the underlying business. Pay attention to sample size and data quality, compromises on either will implicate upon the end-quality of insight and quality.
Adding a Quantitative Element to Your Budgeting Process
In this section, I will demonstrate a process of comparing a bottoms-up budget with a quantitative process. This will explain how to examine the basis for the budget.
For this example, we are going to use linear regression. In its simplest definition, linear regression seeks to find a line through data that minimizes the distance from that line to all the points. This indicates the trend of the data. While sometimes not theoretically pure depending on sample size and the nature of the data, I still find it a very useful tool. Also, there are other regression methodologies often used, such as ARIMA, which can specialize for time series, non-linearity or seasonality, but you can substitute any methodology in the overall steps we will go through to vet a budget.
Analyzing Time Series Data
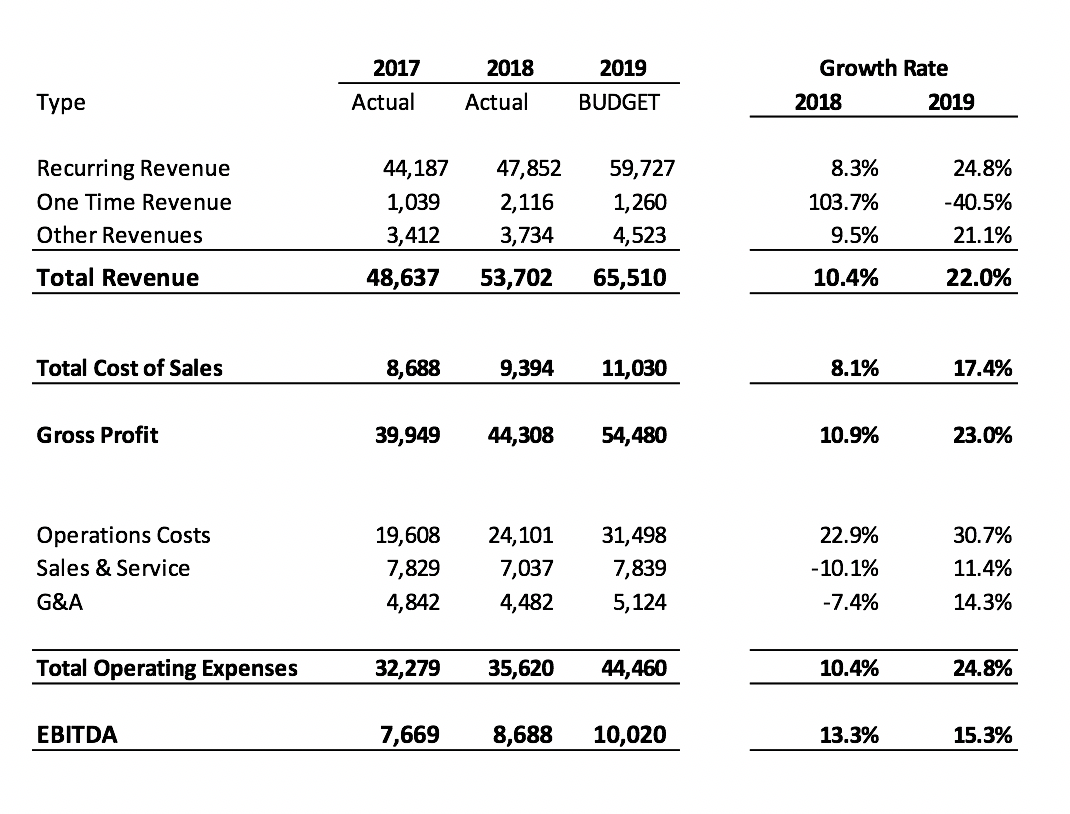
For these examples, we start with a divisional P&L budget we have just received. The budget here consists of revenue through to EBITDA.
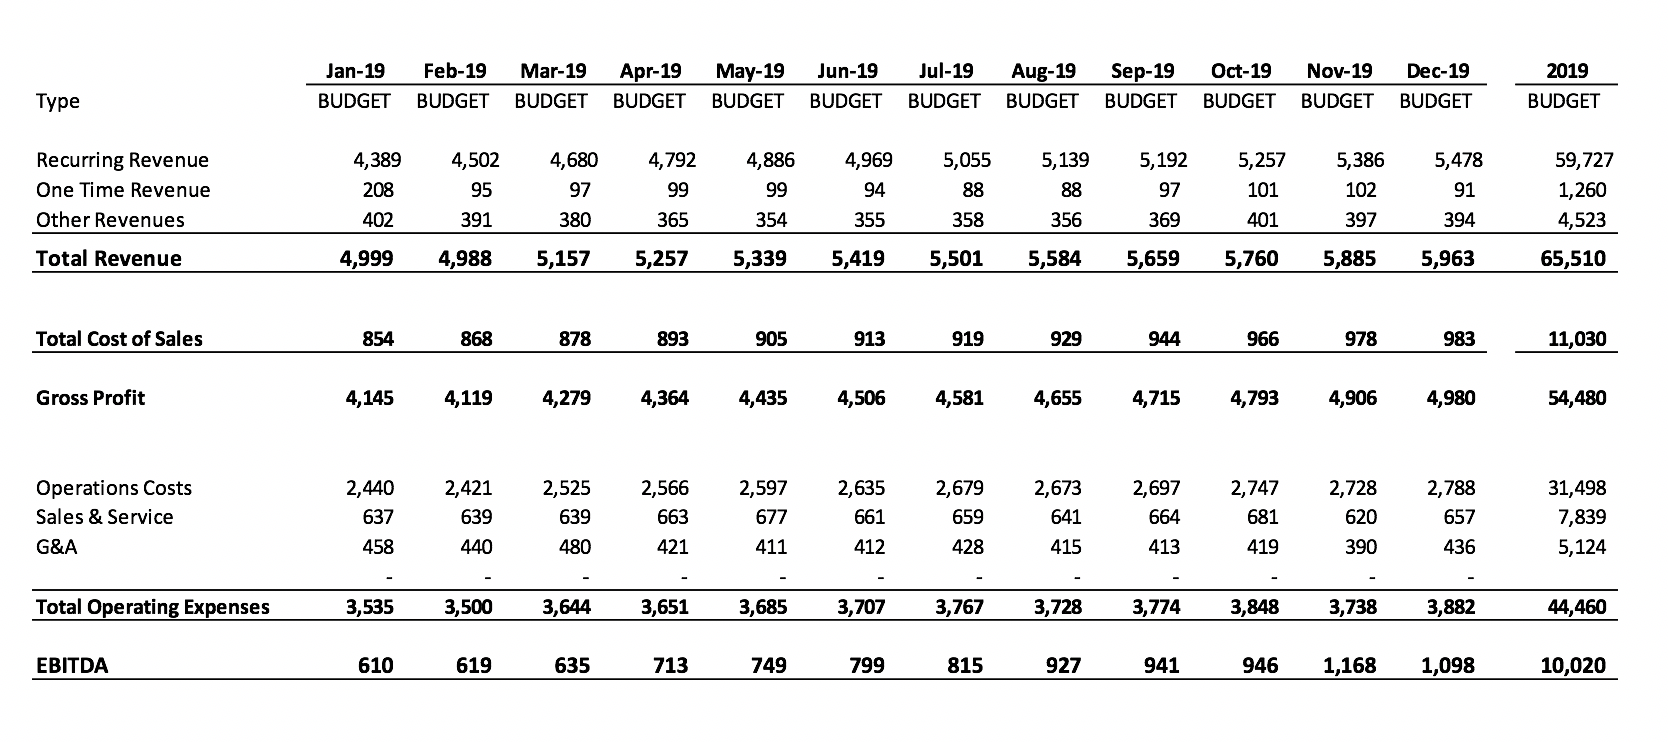
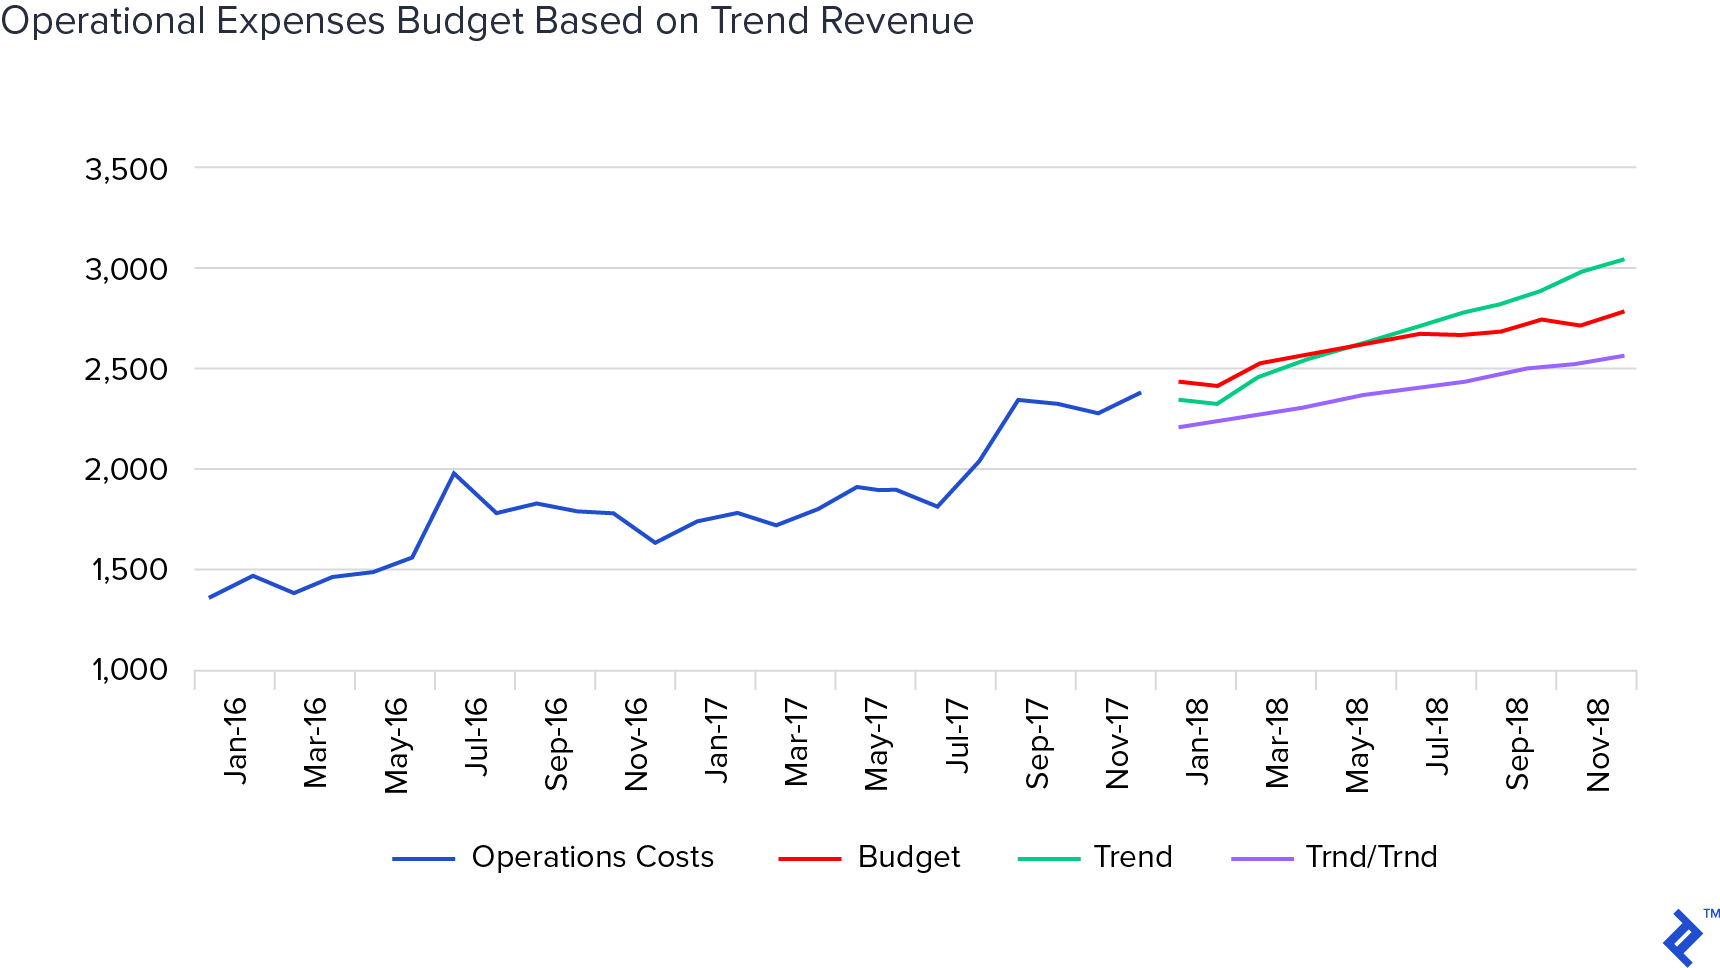
The first use of a linear regression can be used for this time series analysis. This is especially useful for parts of the P&L where management doesn’t have direct control, such as revenues and, to a lesser extent COGS (through vendor pricing). Using the last two years of actuals, a quick sanity check shows the budget expecting a large topline acceleration, combined with lower margins.
The next step is to use the quantitative methodology to replicate a trend model of the P&L. We are going to start with the first revenue line of the budget, Recurring Revenue. I often try to use at least 24 months of data if you have it, but if you have less it can still apply.
For this exercise, we are going to use Excel, which has a number of ways to do this. The first way is via the Data Analysis add-in on the Data Menu. First, take the data and move it to a sheet of its own and orient the data into columns. Then add a column to represent the time periods involved. After that, select the Data Analysis package and then select Regression.
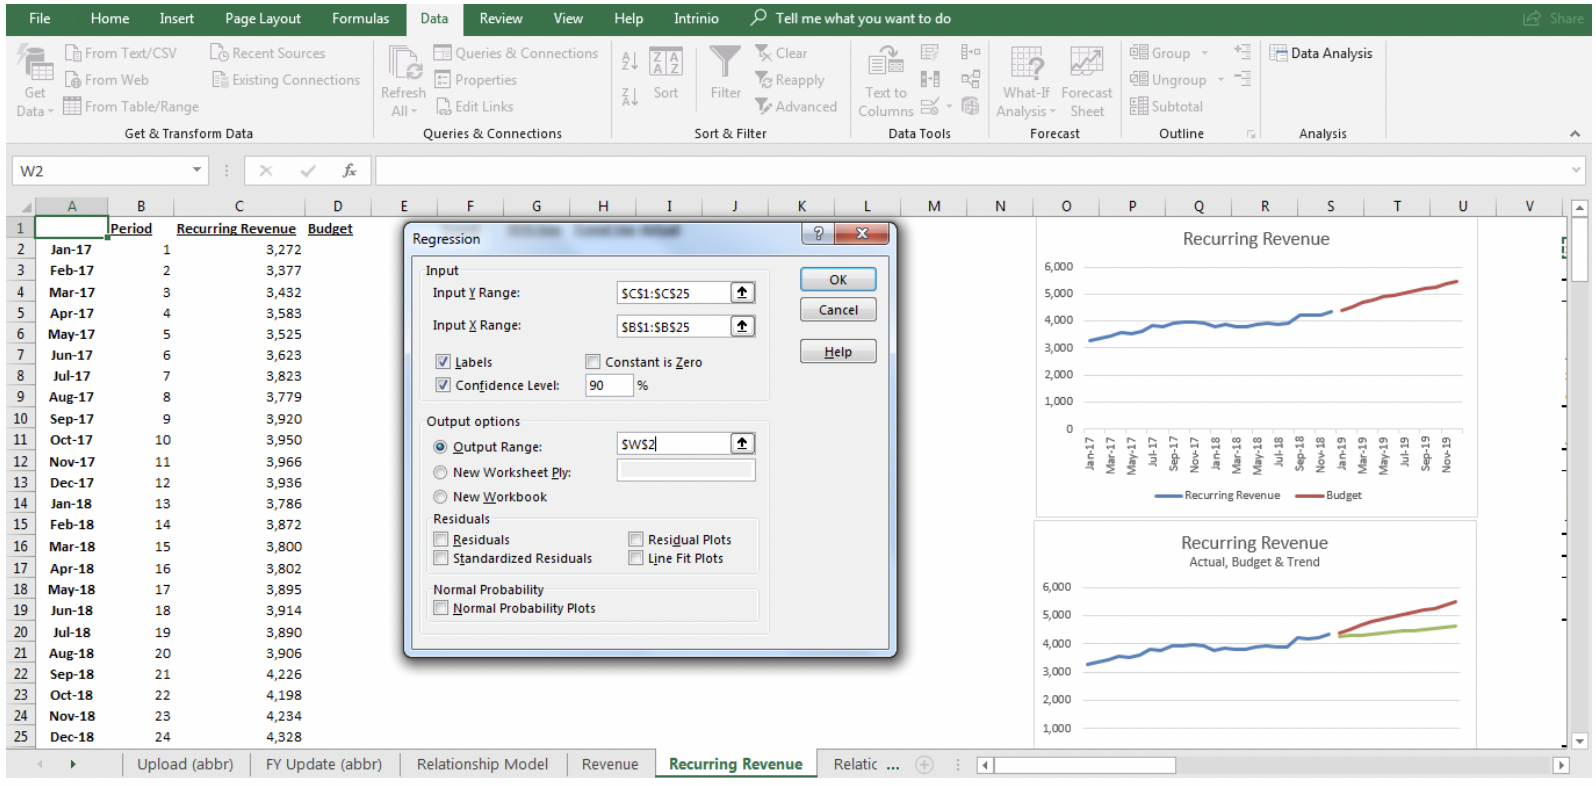
On the regression analysis page, select the data that you want to regress (in this case Recurring Revenue) in the Input Y Range and the periods in the Input X Range. You want to select Labels if you have any titles above the data. In the output section, I usually put the output on the sheet I’m using for analysis, but that is personal preference.
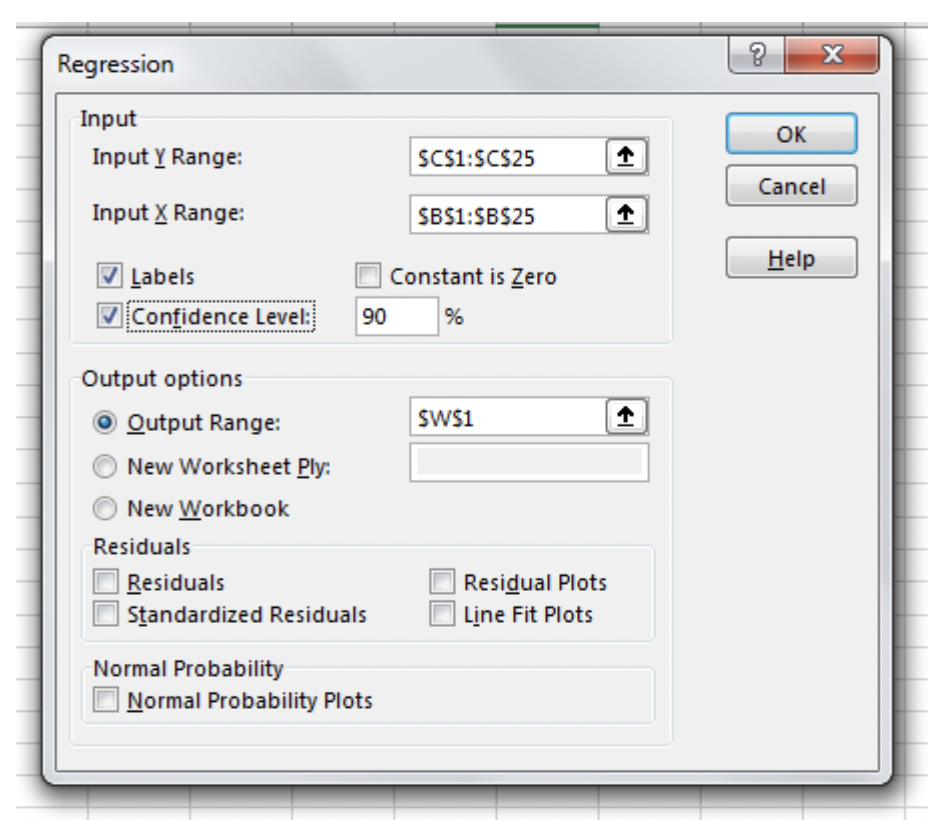
Now press OK and you will generate the output of the regression.
The regression output will give us the information we need to calculate the trend. It will also give us some useful statistics about the underlying function of the business. This will include the marginal increase of the data over time, the ability to look at scenarios and how well the linear model fits the data.
Decodifying the Excel Regression Output
The regression output constructs the following analysis:
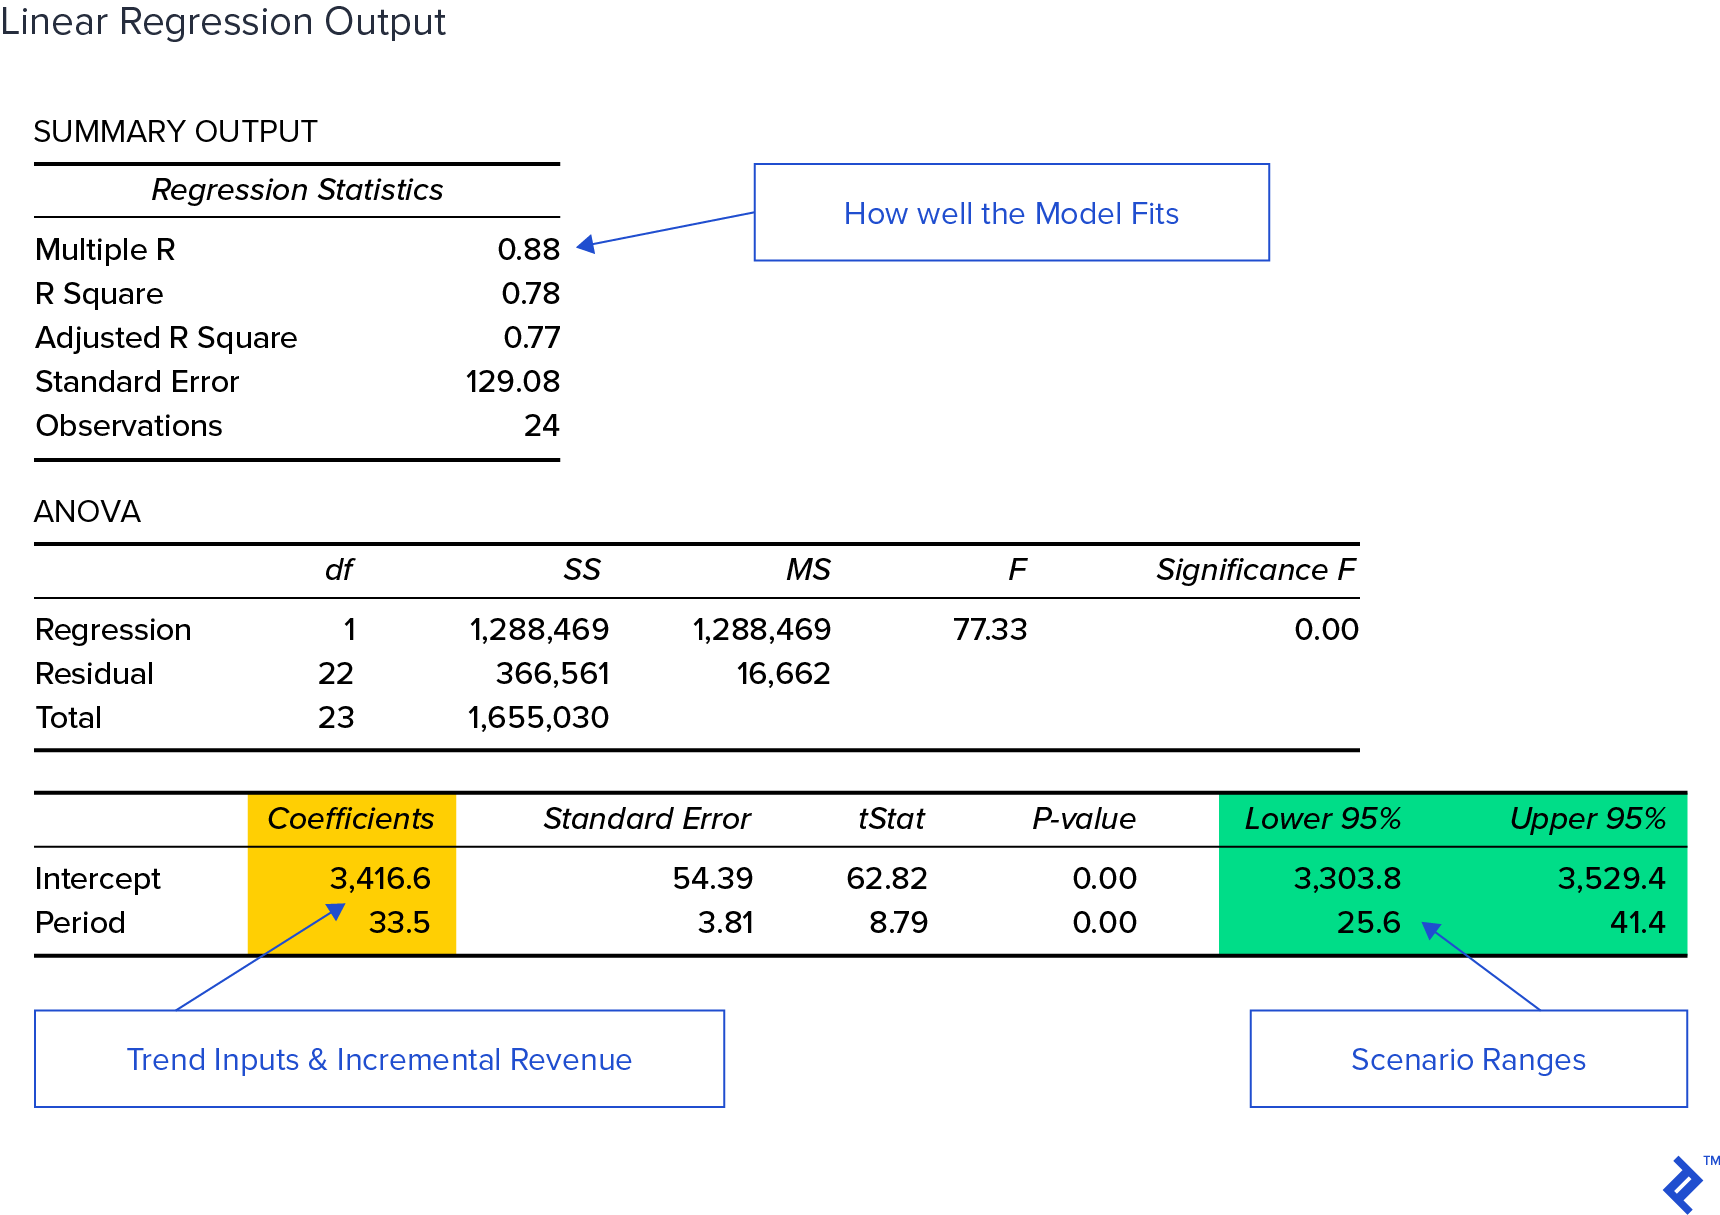
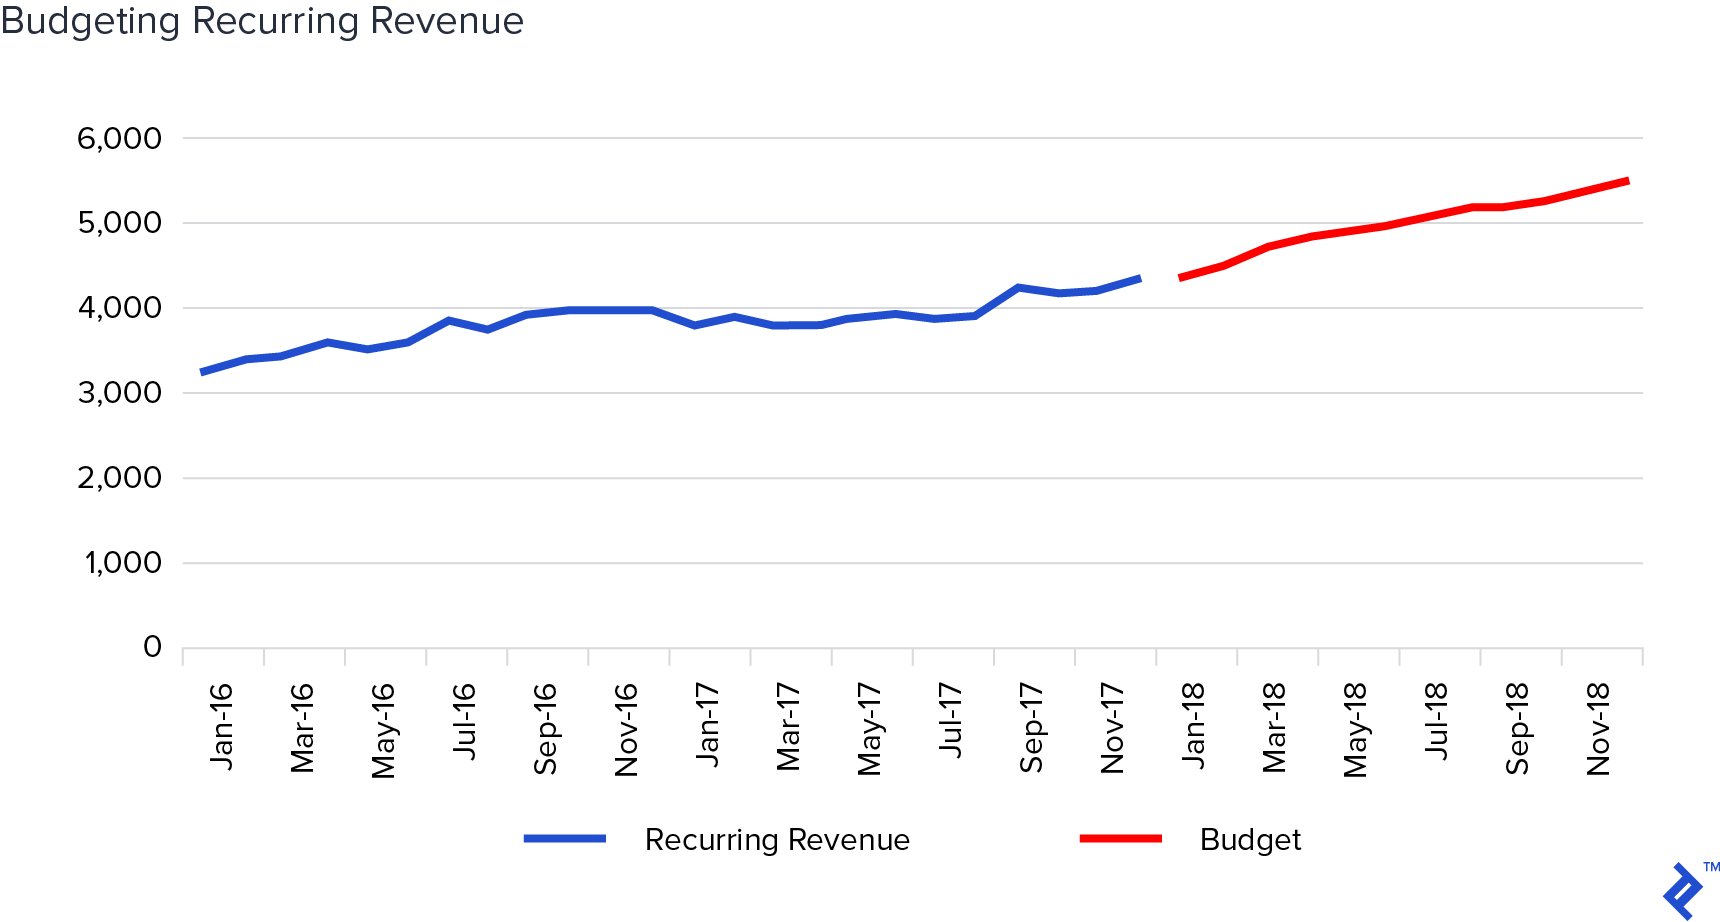
Our main interest is in the Marginal and Fixed Revenue output. We can find these in the yellow shaded section with the Intercept as the constant and the Period as the slope (the linear model formula in Excel would be =Intercept + Period * future periods. This will give us the basis for the Recurring Revenue trend projection by using these inputs in our formula and substituting the greater periods. Once we have a trend projection for Recurring Revenue we will then have the ability to objectively compare it to the submitted budget. In addition, we’ll take advantage of the confidence interval output to see the variance in the trend.
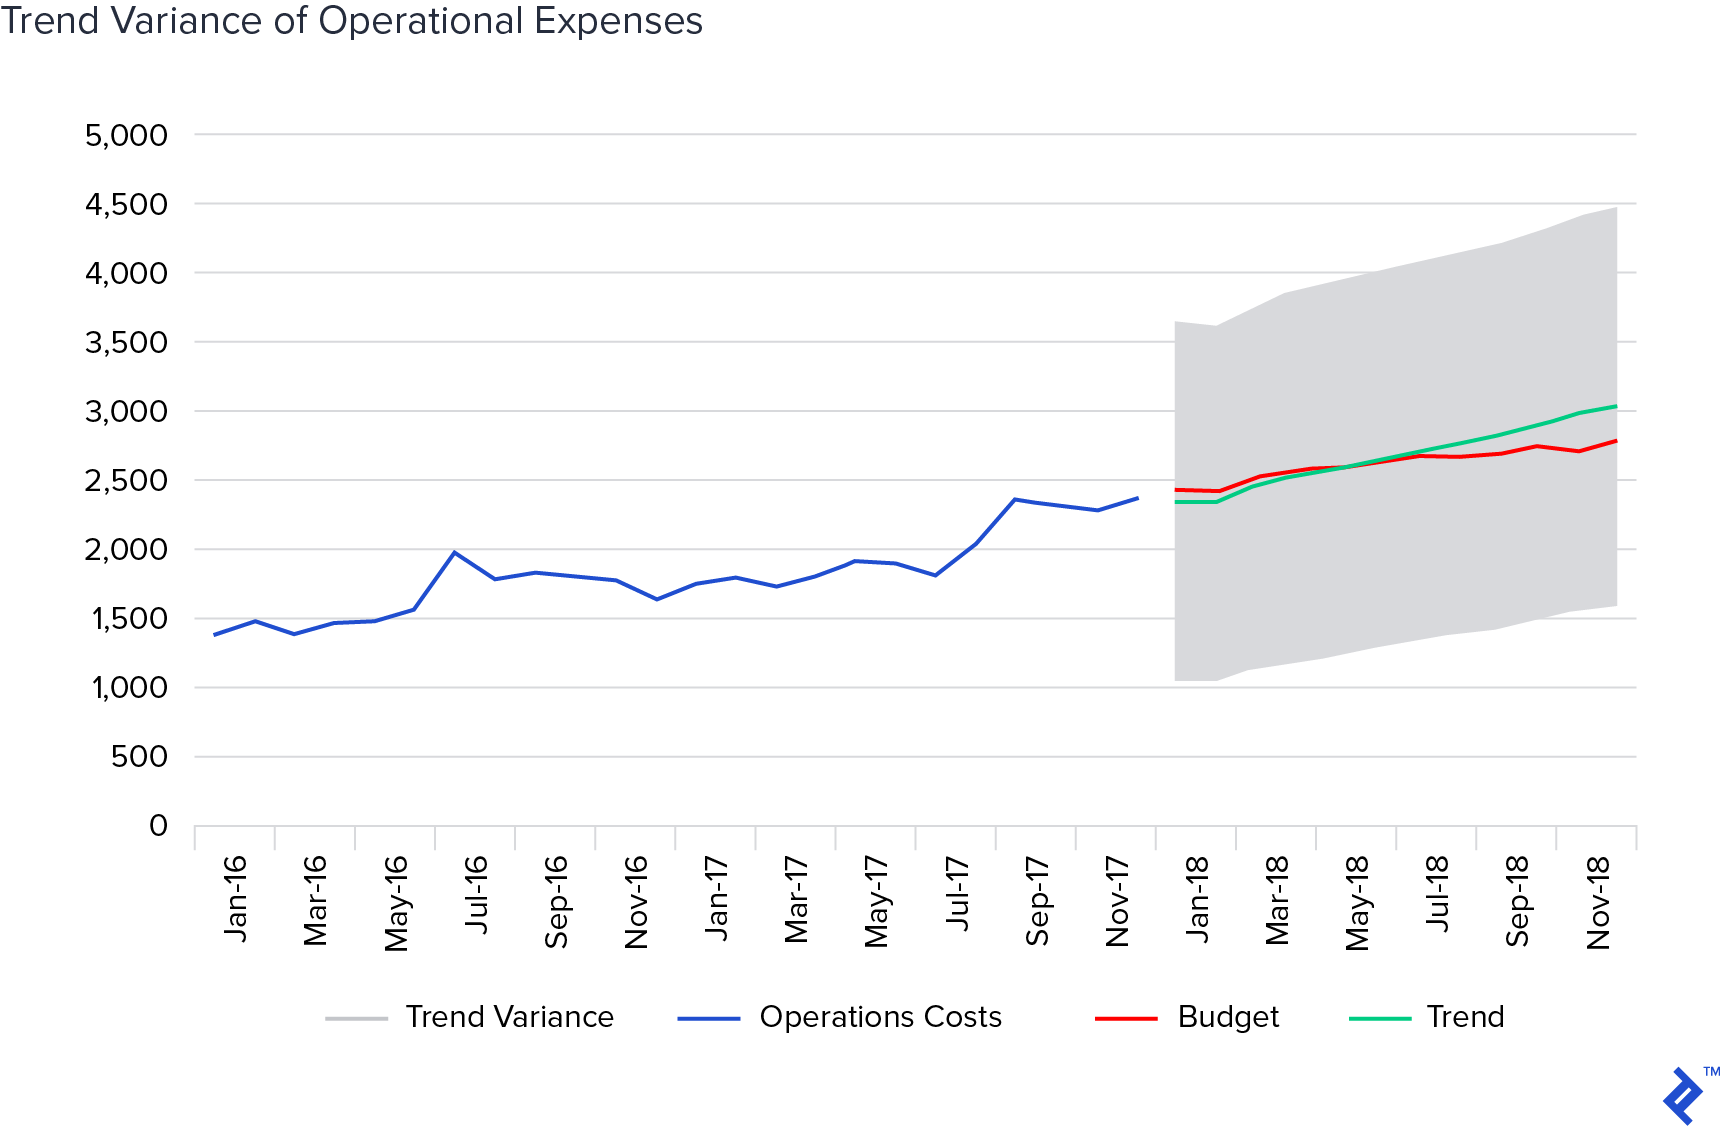
Plotting this trend against the existing budget allows us to eyeball for fit.
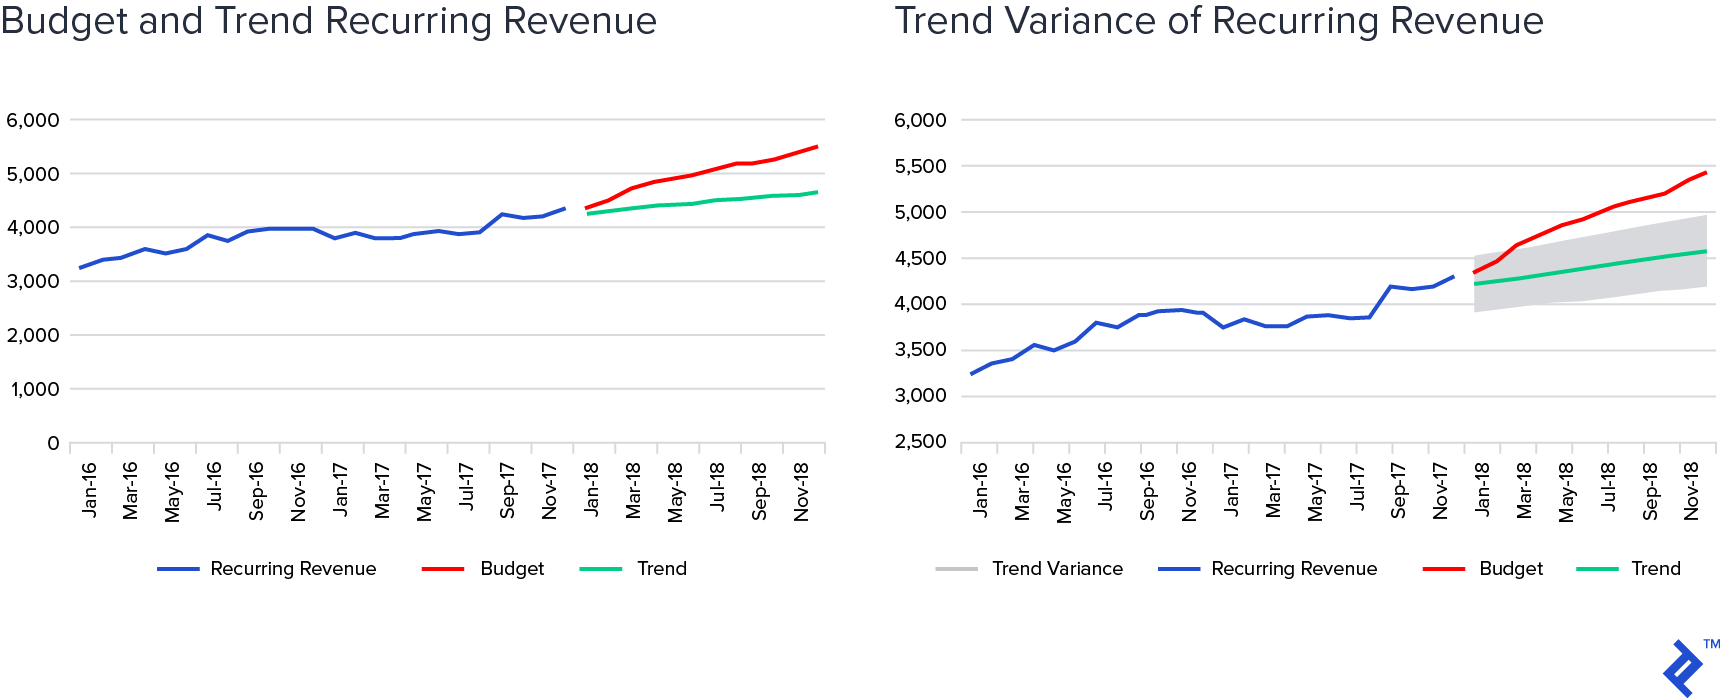
We repeat the formulas using the green shaded inputs for high and low trend estimates. This will give us mathematically rigorous bounds for examination, shown by the grey area on the right-hand chart.
Appraising the Time Series Output
From the previous charts, we can see the budget is well above the trend and its variance. If we calculate the average monthly increase in the budget, it’s nearly 3x as large as the recent trend ($99.1 to $33.5). Again, we are using a single timeframe of data and a univariate linear model for this example.
This should form the basis of discussion with the team or budget owner as to what is driving the outperformance. I find this important to either find the quantifiable actions or events that drive the outperformance or to provide a basis for re-evaluation of the assumptions or challenge the goals which resulted in this budget. This may include organic growth assumptions, new business probabilities and the underlying expenditure necessary to achieve this result.
Determining Relationships Between Budgeted Figures
Now that we’ve seen how to use a regression to examine time series budgets, we’ll use it to examine relationships within the business. When budgeting, I often use the time series structure for items that are mostly out of the business’ control, which is primarily revenue. For relationship usage, I am looking for what it takes on a marginal cost basis to support the level of growth. For this example, we will look at how operational expenses relate to revenue.
In this budget, we have an operational expense that appears to track revenue closely. We can examine the relationship between the two by using a scatter plot. This will give us an idea of the marginal relationship between the two, in addition to how well fitted they are, by seeing the variation around the regression.
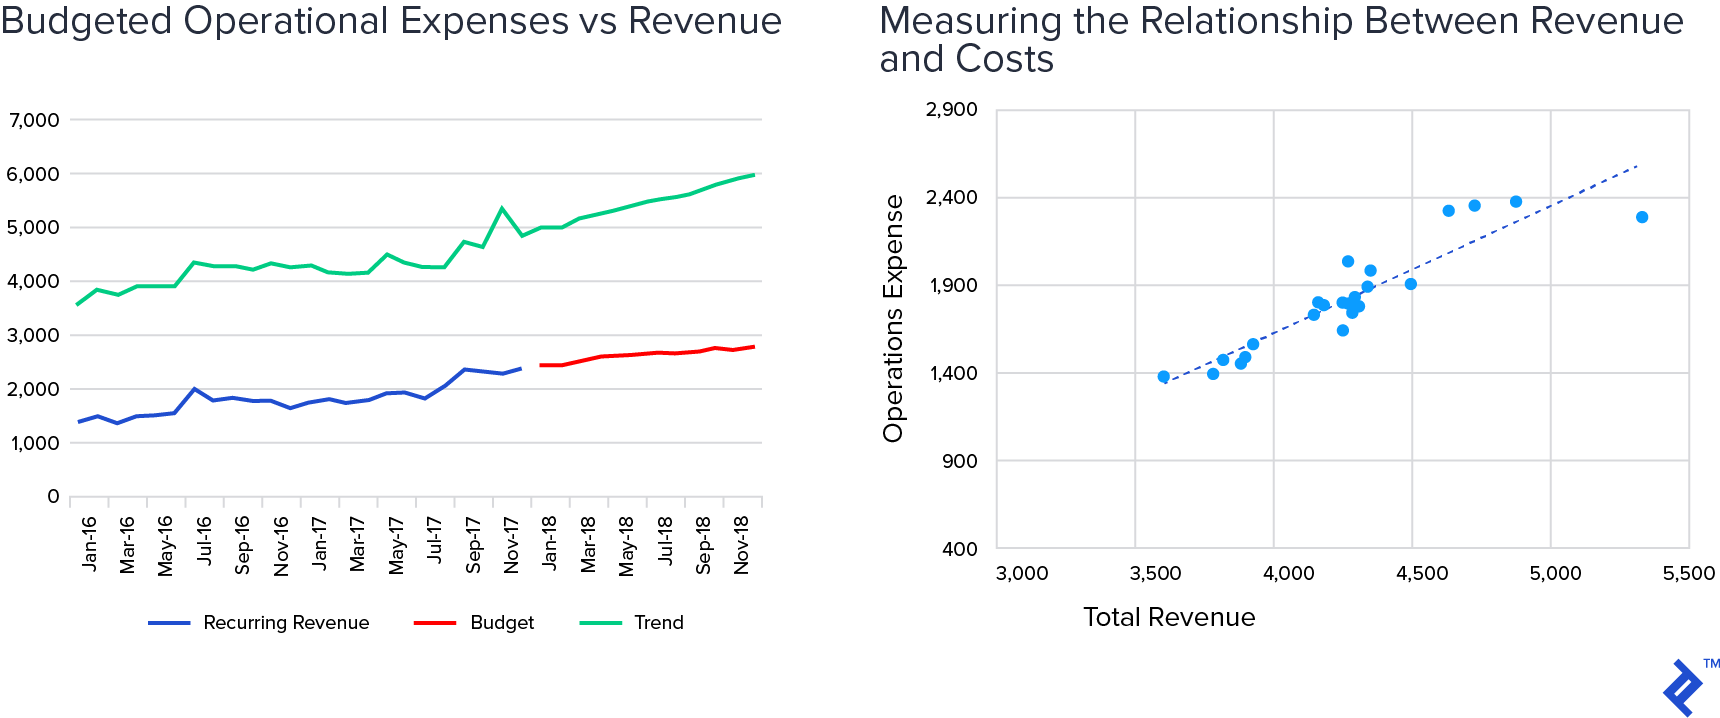
We can replicate the regression from the Timeseries example by making Operations Expense the dependent variable and making Total Revenue the independent variable. The scatterplot showing the correlation to the two was derived from the following output.
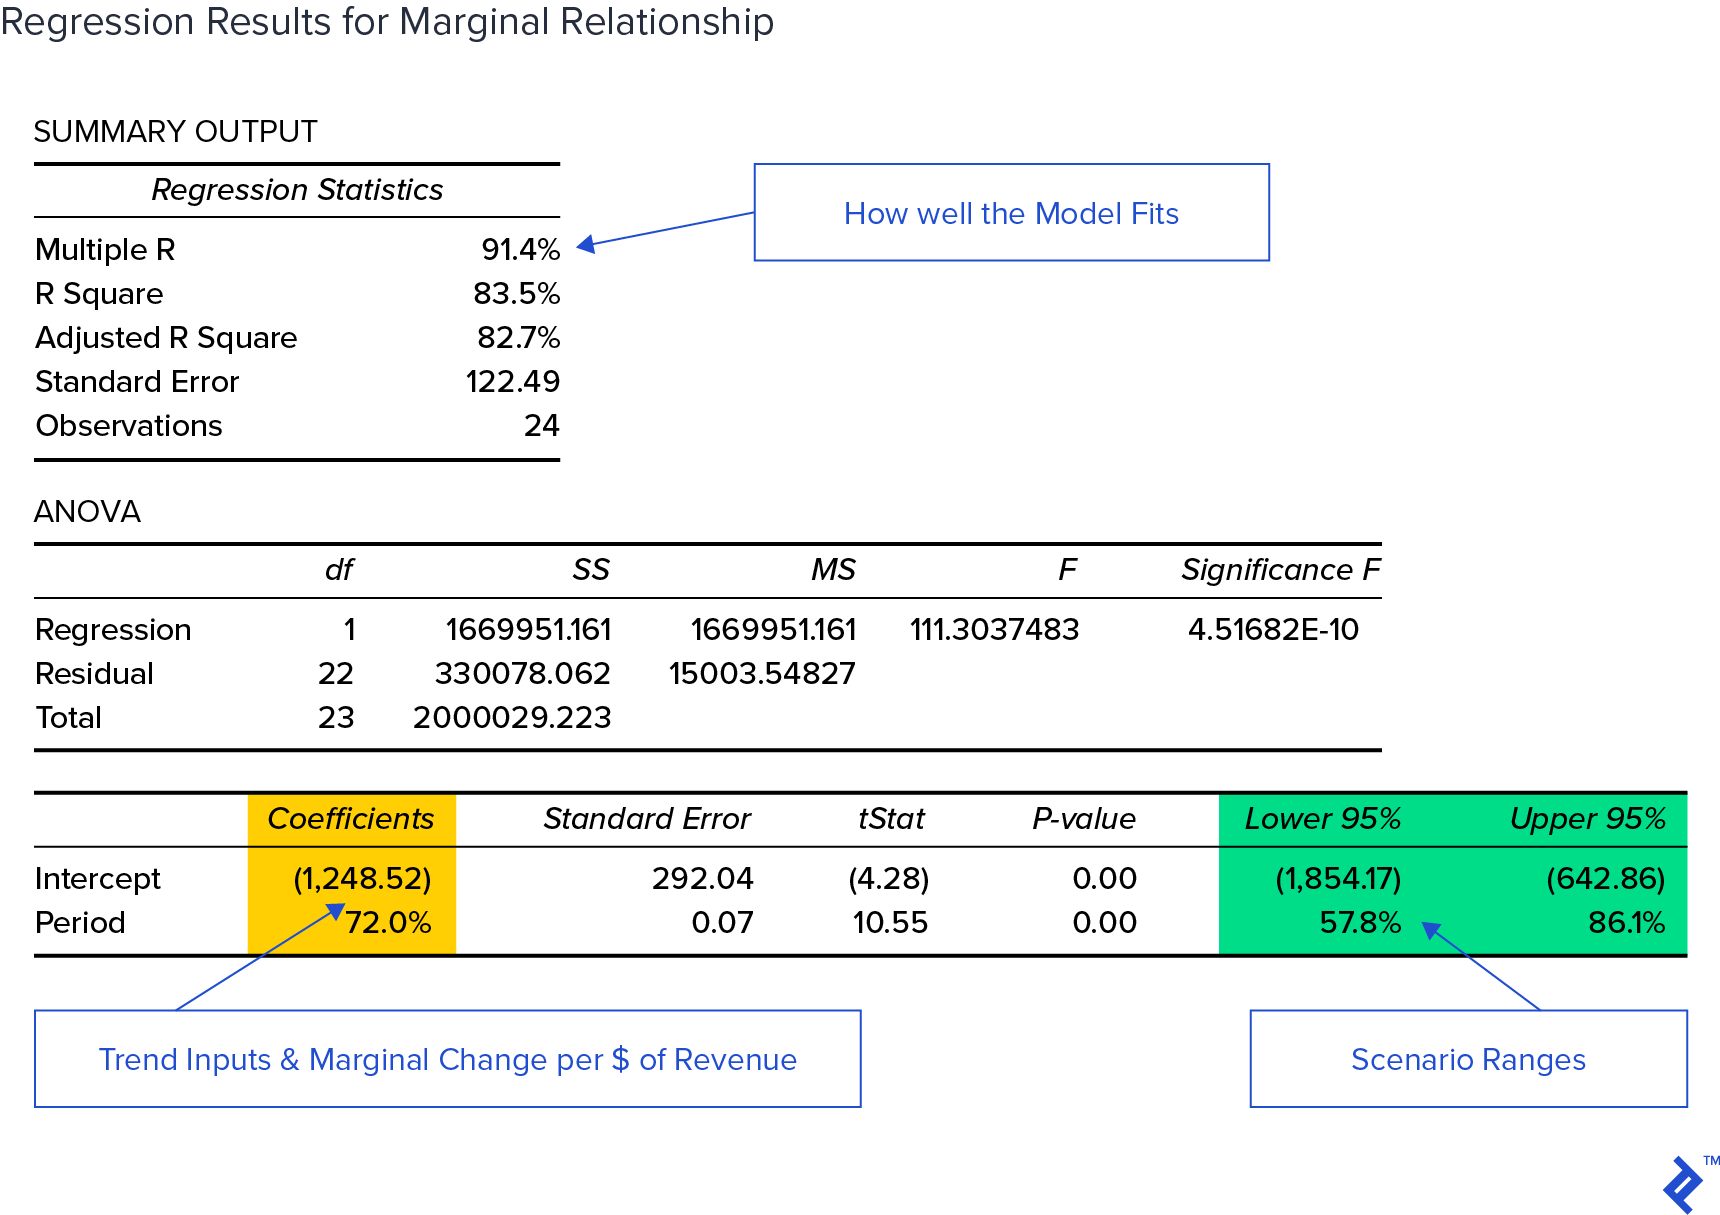
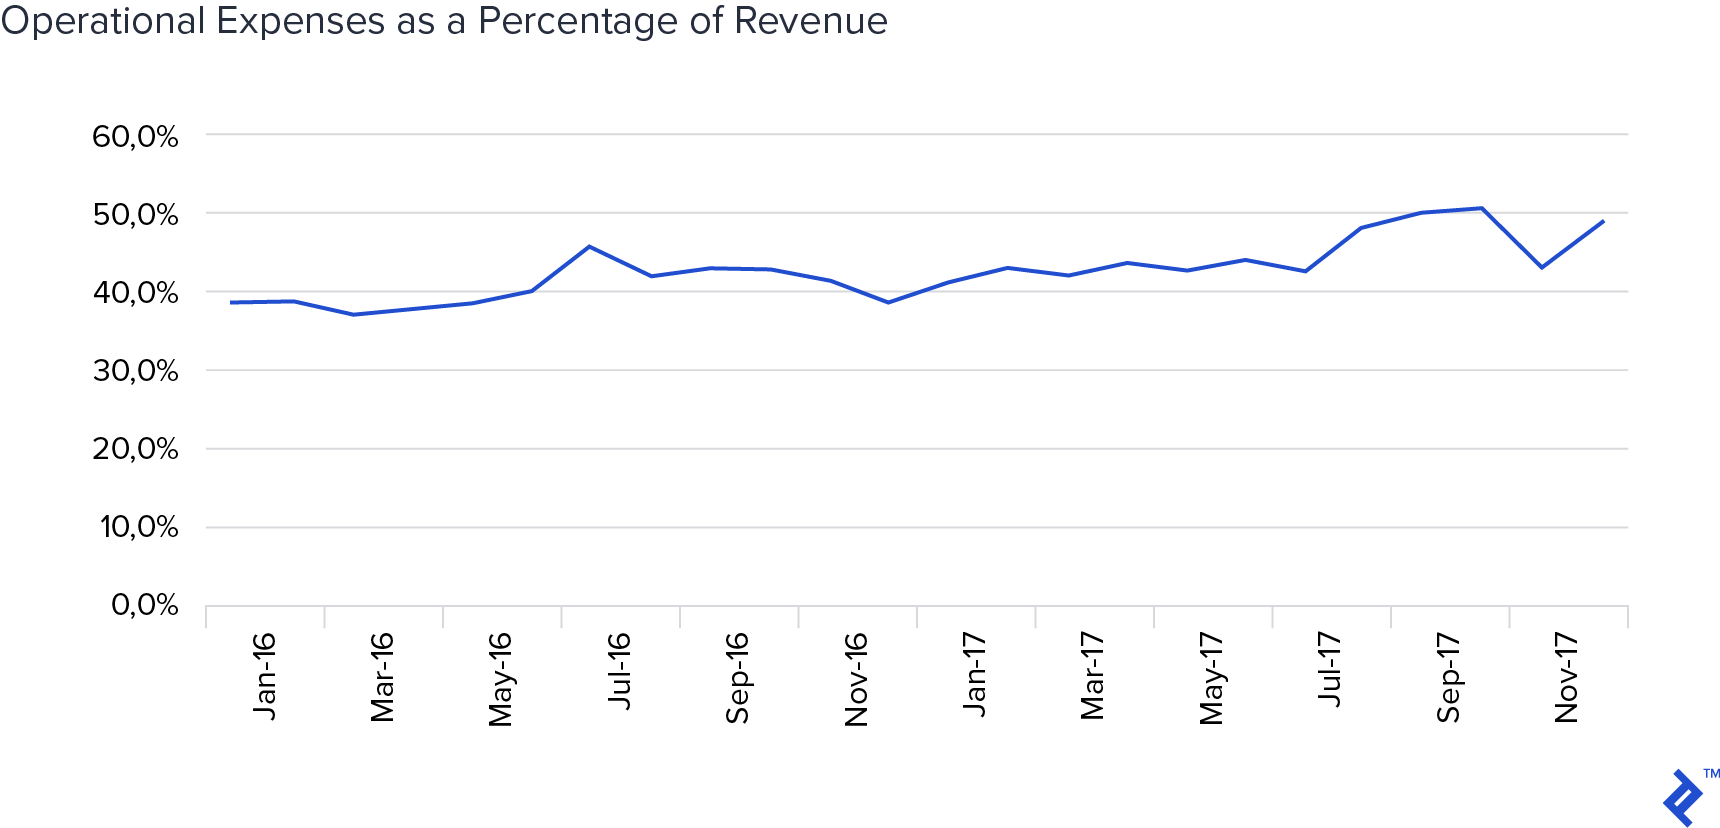
In this case, the marginal amount indicates the amount of operating expense increase per dollar of revenue. Over the last two years, for every dollar of revenue, the operations expense has gone up by $0.72. This would indicate that operational expenses as a percent of revenue have been climbing over the last two years, which indeed it has. The R² (coefficient of determination) of 83.5% also indicates a strong degree of correlation (and thus, relationship) between the two variable sets
With the results of the regression, we can now build out trend model. But, as it is a relationship model, we have two ways of doing it. We can build the model based on the budgeted revenue amounts, in addition to the revenue trend results from our previous regression.
First, let’s look at the revenue with the model based on the budgeted revenue. This approach allows us to look at marginal assumptions embedded within the budget. As before, we construct both the trend line and the variability.
As the budget is near trend and well within the area of variability, the budget appears to be reasonable. The analysis does, however, raise some questions for the budget owner.
We can see that the budget tracks the trend for the first half of the year and then begins to trail behind. This would indicate that the budget owner expects a certain amount of efficiency from previous operations. In fact, by December the budget is on a 10% lower run-rate than the trend. Discussion could focus on what is driving the efficiency in the later part of the year.
The second analysis using the results would be to run the model again, using the trend revenues. This would allow us to compare the budget to what the trend relationship would be. Again we take the regression results and calculate the trend using the trend revenues.
As the trend revenues are significantly below budgeted revenues, the Operations Expense is also below the budget. This analysis would give rise to issues if expenses need to be front-loaded, or are they contingent on the budgeted revenues. Also, this analysis could spark a risk analysis of contingencies should the revenue not materialize.
A Quantitative Model for Budget Comparison and Rolling Forecasts
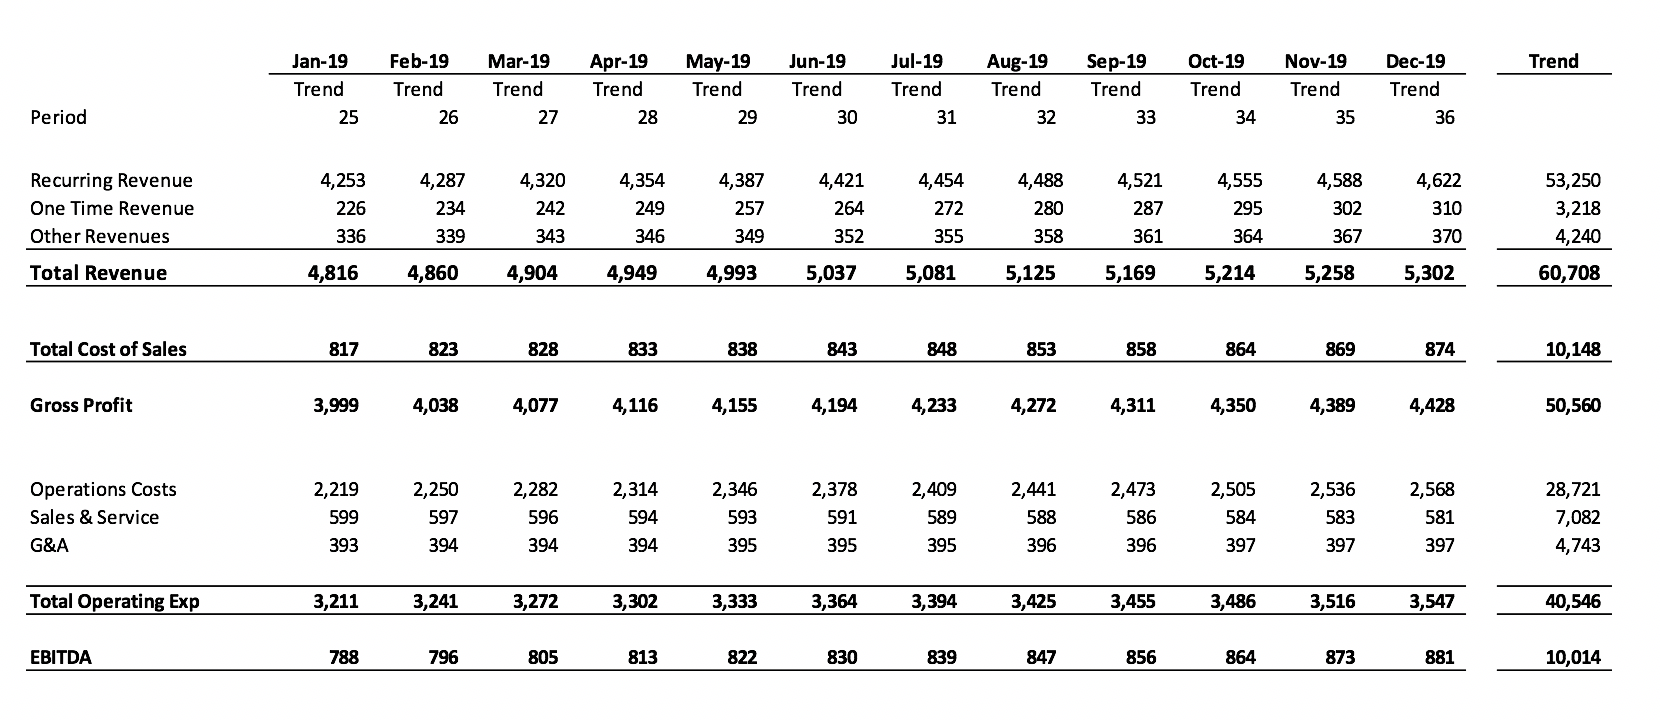
Now that we have both the time series and the relationship tools, we can build a quantitative model of the P&L. With revenues calculated on the timeseries basis and expenses based on the relationship with revenue, we can project a Trend P&L. In this case, we build the trend using the excel functions for =SLOPE() and =INTERCEPT(). This can provide us with a dynamic model that can be updated throughout the year.
This quantitative tool can be used for not only budget evaluation, but the basis of rolling forecasts, benchmarking or alternative forecasting methodologies. I have found this tool to be incredibly useful. Variation from the trend provides additional information on business initiative effectiveness or can provide early warnings when actual results begin to move in the wrong direction.
Doing this exercise does not use a lot of management resources. The underlying statistics are derived from the actual operations of the company and do not include agent bias. This allows variations from the trend to provide information on how the business is changing and by exactly how much. Scenario analysis is also possible: the high and low can be set to different levels, or automatically set to a certain threshold of variability.
Comparing Trend to Budget
We can now compare the trend results to the submitted budget. On a line-by-line basis, we can examine the submitted budget and evaluate the assumptions, set benchmarks and review how the business has operated in the past.
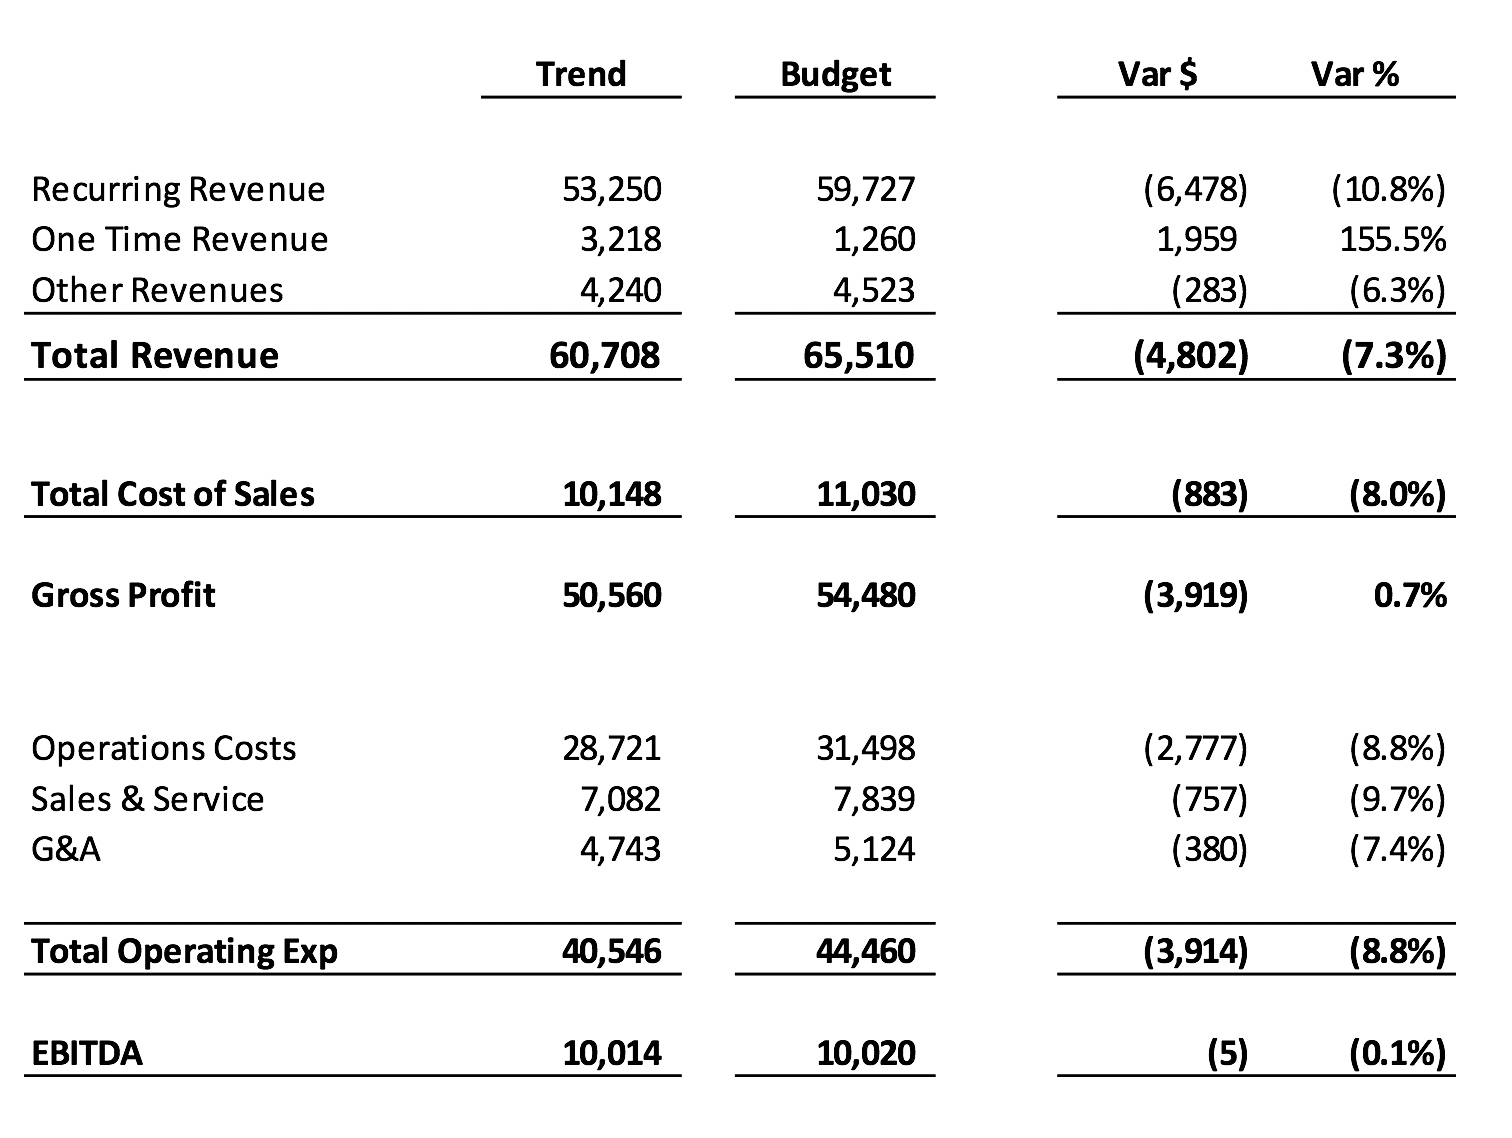
As you can see, the trend analysis is showing that the business may have an overly optimistic topline forecast. Its revenue projection could be an overshoot, with costs increased to keep EBITDA results in line. This risk here is managers ramp to budgeted expense levels and topline results lag, negatively impacting profit margins.
As I mentioned earlier, the people making qualitative budgets also set the narrative, and this at times, can be to the tune of their micro-agenda within the business as a whole.
Creating a Budget That Lasts A Year
We have now added a quantitative approach to our qualitative budget. While the budget may stay the same in the end, this enhanced approach has highlighted risks, provided scenarios to be planned for and has provided budget owners with a performance benchmark. We also have a model that we can use to forecast forward trends to set benchmarks to beat.
Budgets can be, let’s say, unrealistic, and made more for pleasing the board, or to set a high bar to encourage results rather than direct management purposes. Aspirational budgeting sets a positive mentality, but if there is no method to it, the accuracy will be dubious. Having tools such as those described here provide a quantitative check to ensure that you are on the right path.
As always, forecasts and budgets are best with a toolbox approach and adding another methodology will help you see outside the “group think” box. Using a rolling forecast and different forecasting methodologies can improve forecasting effectiveness. When I am forecasting, assessing which tools work best gives me an insight into the function of the company. Following this mentality will help you create a budget that lasts the year.
At a future date, I will revisit this example to demonstrate how to track budgets, tweak them along the way and conduct a useful post-mortem to determine how reality transpired relative to expectations.
Understanding the basics
What are the steps in the budget process?
A budget starts at the very top when a headline goal is set. It then travels to the bottom, where sub-teams must plan and project their revenue and cost expectations for the year. Before traveling up through units and divisions before being consolidated into a company-wide budget.
What are quantitative forecasting methods?
Quantitative forecasting methods apply objective statistical measures to project future outcomes. Their outputs are purely affected by the numbers inputted and thus can be deemed less bias and more reliable than qualitative tools.
Why is financial forecasting so important?
Financial forecasting serves to set appropriate goals in organizations. This helps to align performance, set incentives, and provide meaningful context for past appraisal and
Erik Warren
Yorktown Heights, NY, United States
Member since September 29, 2017
About the author
Erik’s built and managed finance functions for global companies, with responsibilities ranging from reporting to managing capital raises.
Expertise
PREVIOUSLY AT