


In this blog post, we will walk you through analyzing user interactions using LaunchDarkly Data Export.
Data Export provides a real-time export of raw analytics data, including feature flag requests, analytics events, custom events, experimentation events, and more. By exporting your data to a location of your choice, you can use your own data warehouse and tools to analyze event data.
LaunchDarkly events contain valuable information about your users' demographics and how they interact with your application. If you want to make this information available to your business, keep reading.
How does Data Export work?
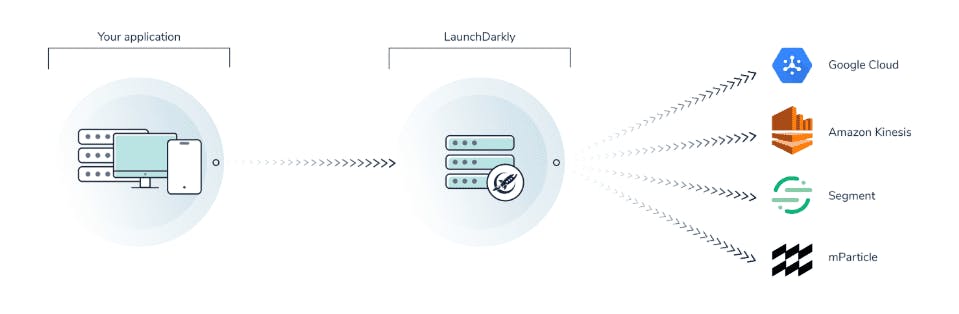
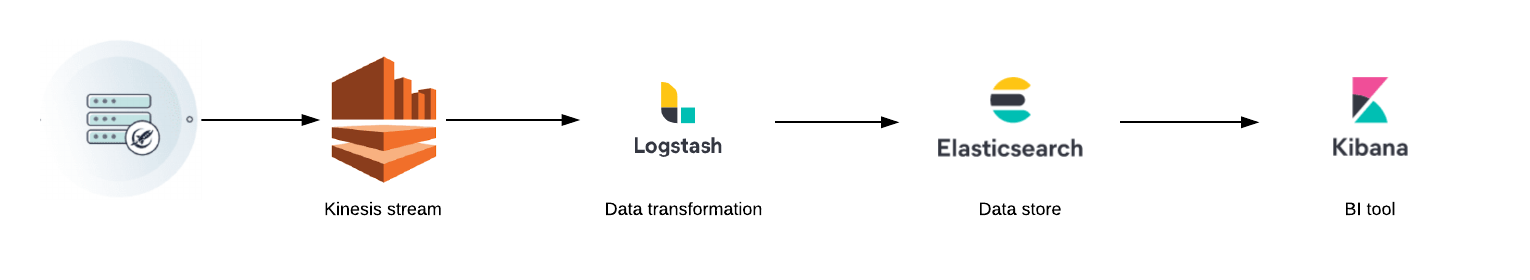
Data Export works by sending data to one of our supported destinations. A destination is an external service that can receive and store the data. For this example, we have chosen Amazon Kinesis stream as the Data Export destination for our LaunchDarkly project. Flag evaluation events are being streamed in real-time into Kinesis, then picked up by the data transformation tool (logstash) and sent into Elasticsearch\ Kibana, a third-party analytics platform.
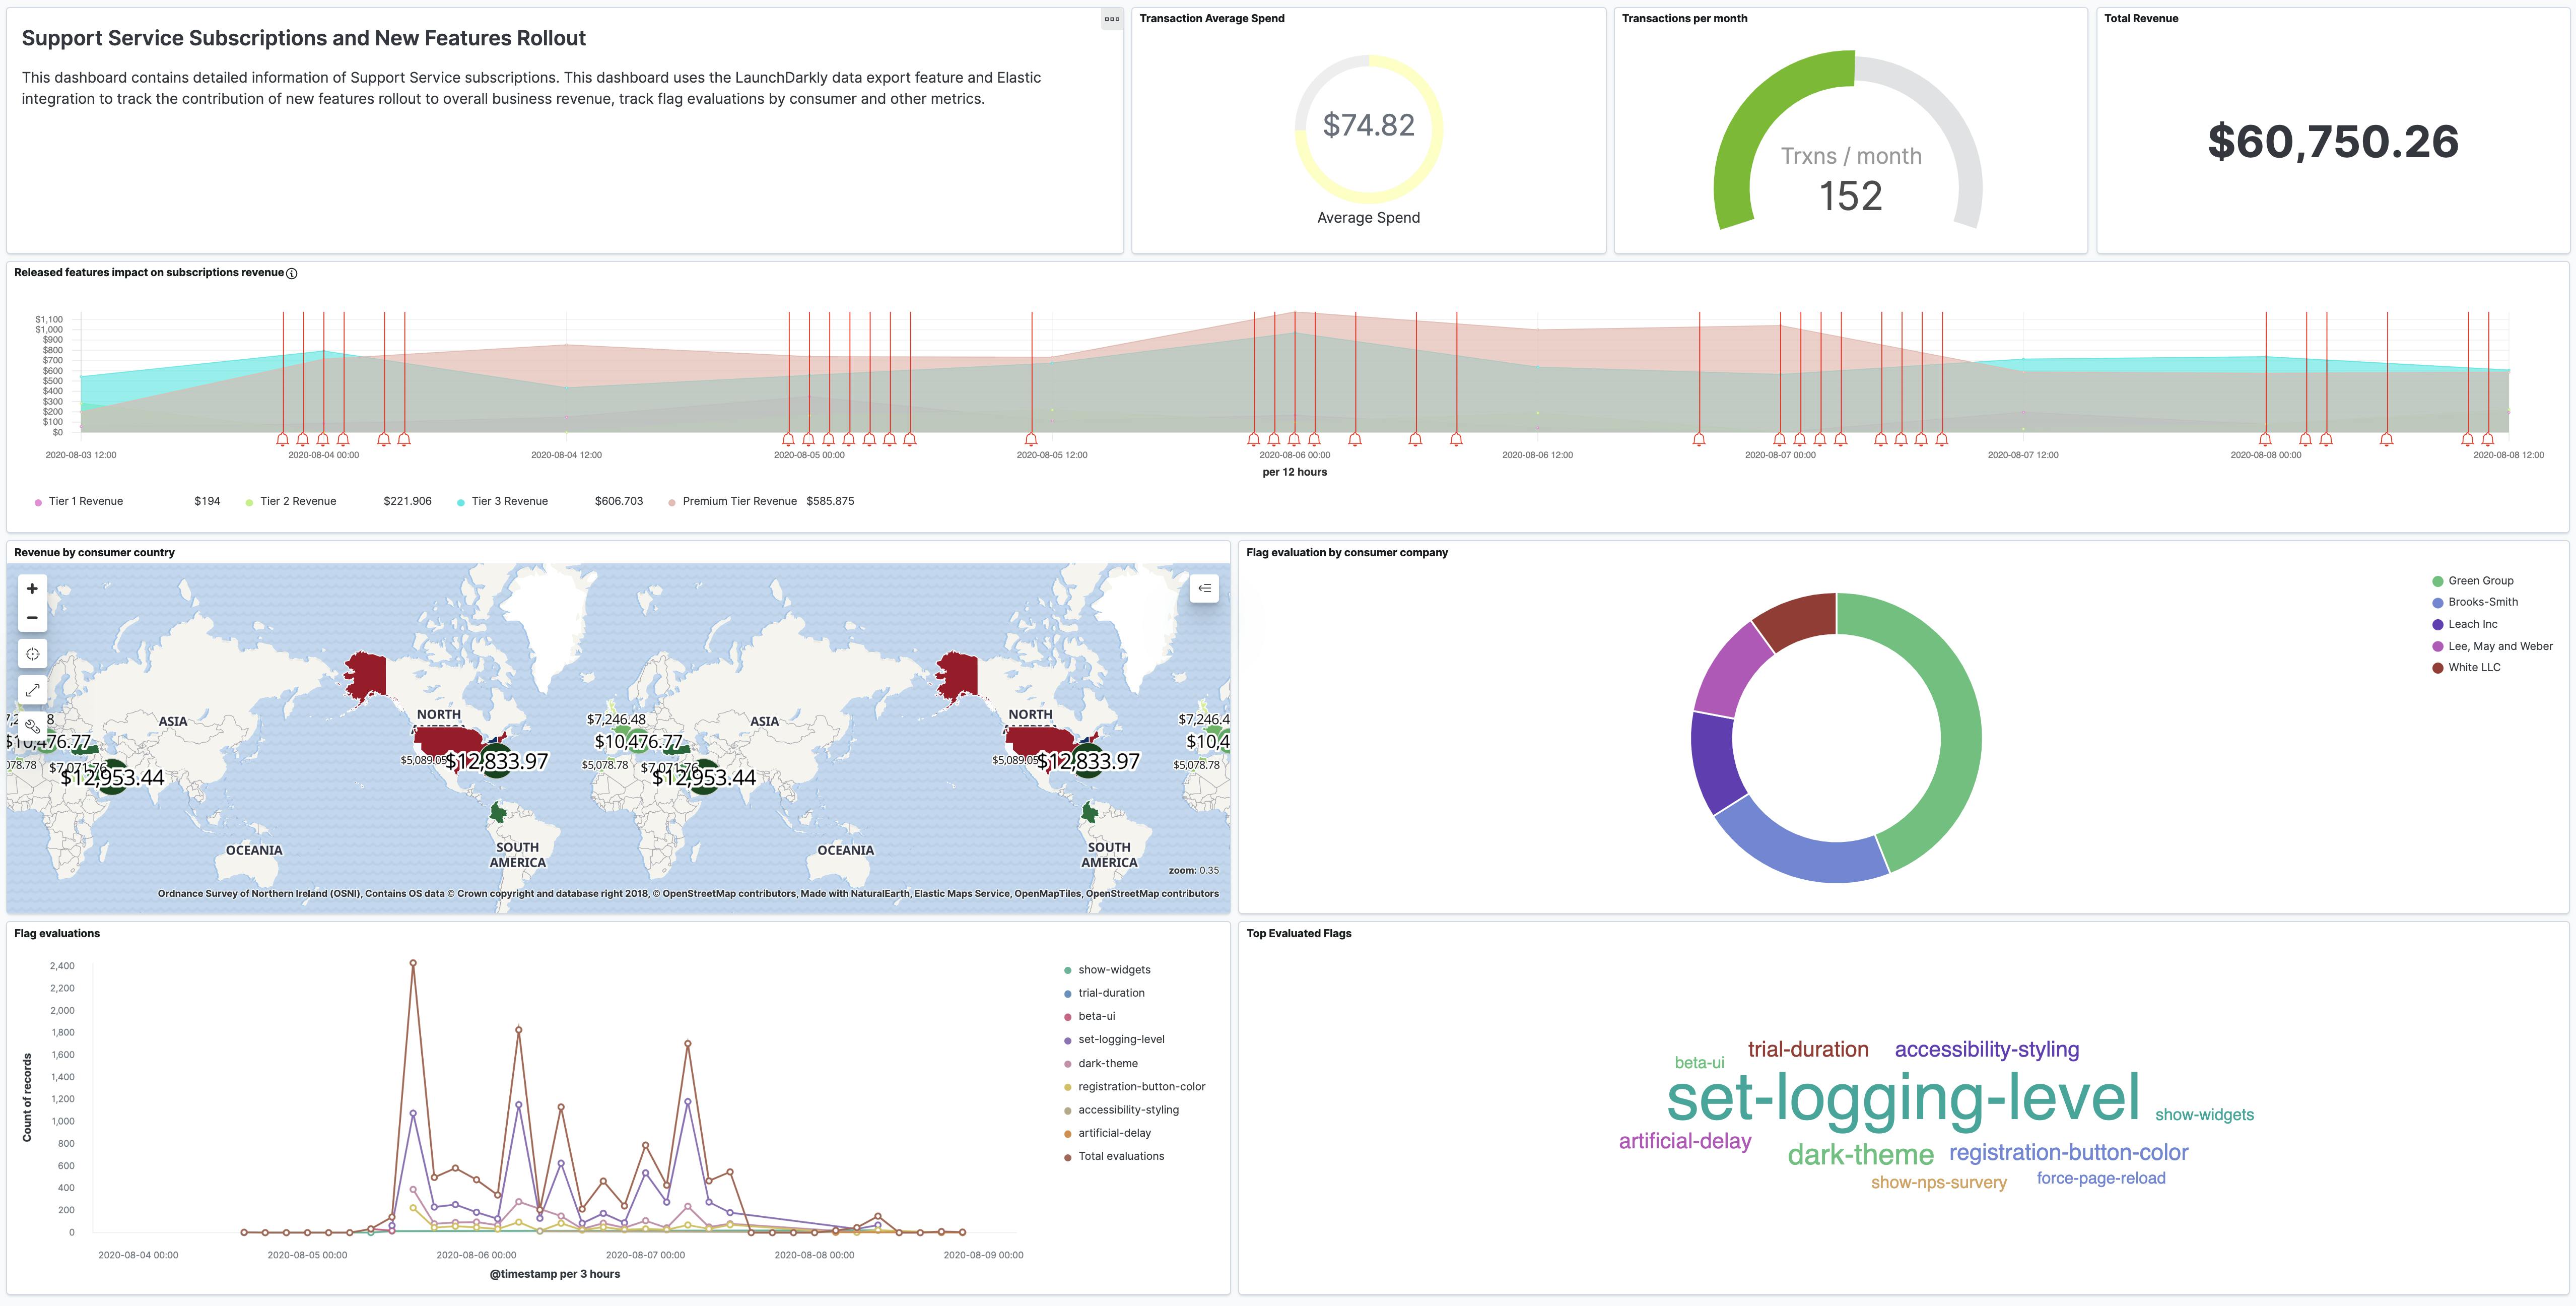
Once the data is in your analytics platform of choice, you could use it to answer different questions. We will walk through this example dashboard. We use flag changes and flag evaluation information to provide insight into the customer demographics and user interactions with flags in our application.
Who is using my new features?
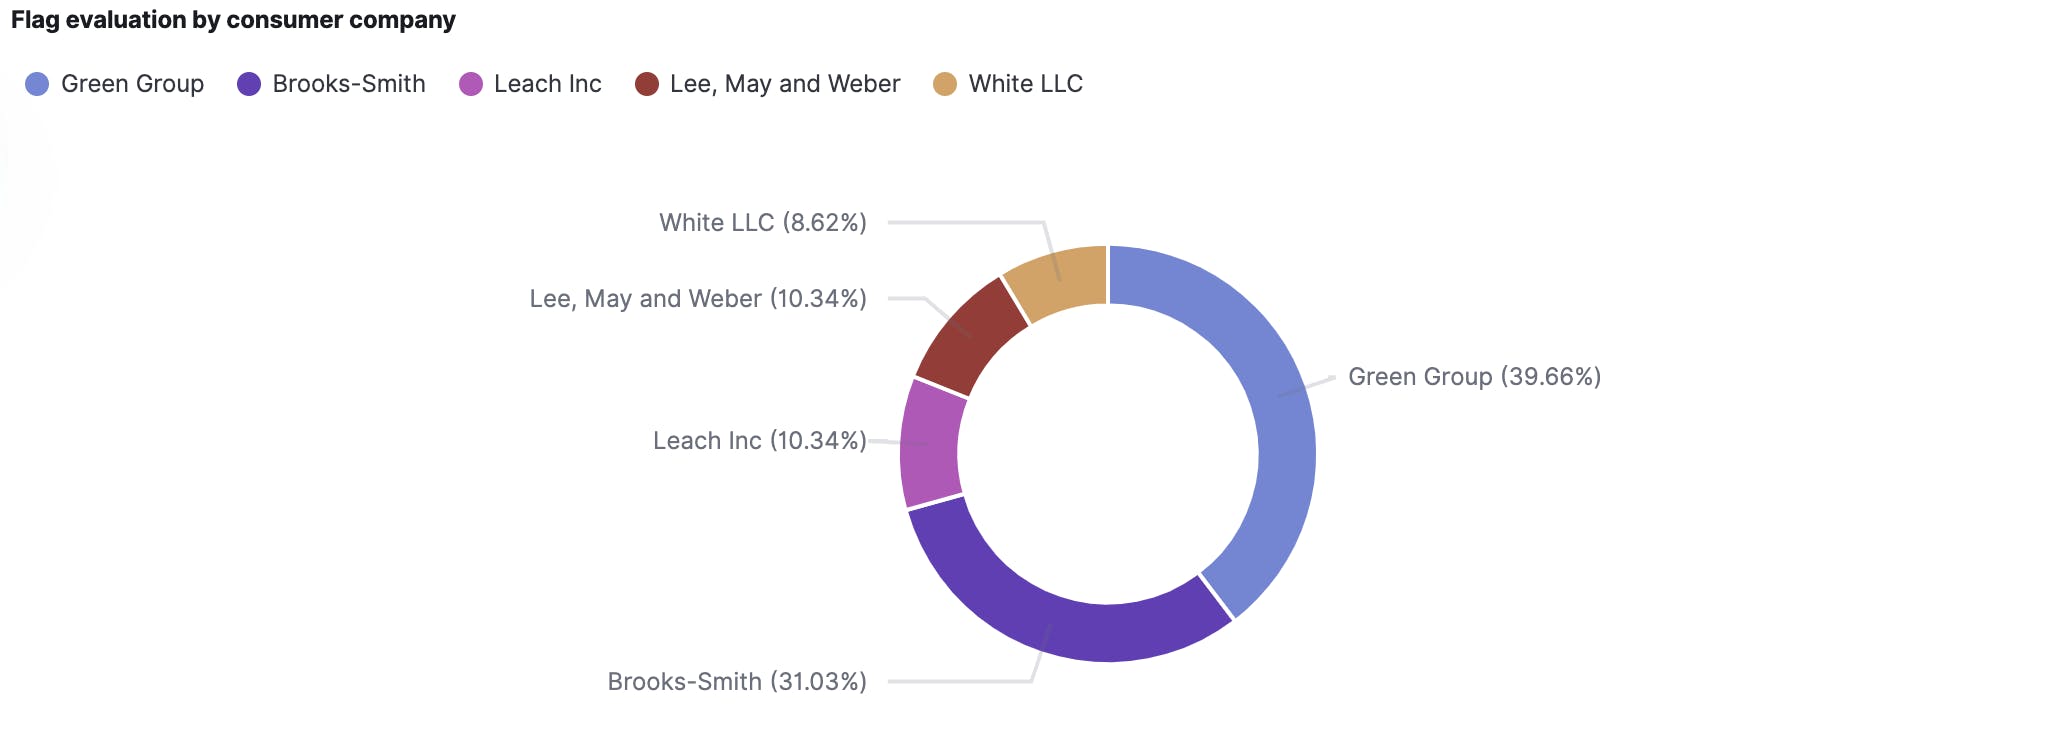
Data Export identifies event logs user data such as custom attributes used for targeting. This information can be used to learn more about your users, for example, answering the question of which of the following companies uses a certain feature?.
How many users evaluate my feature flag every day?
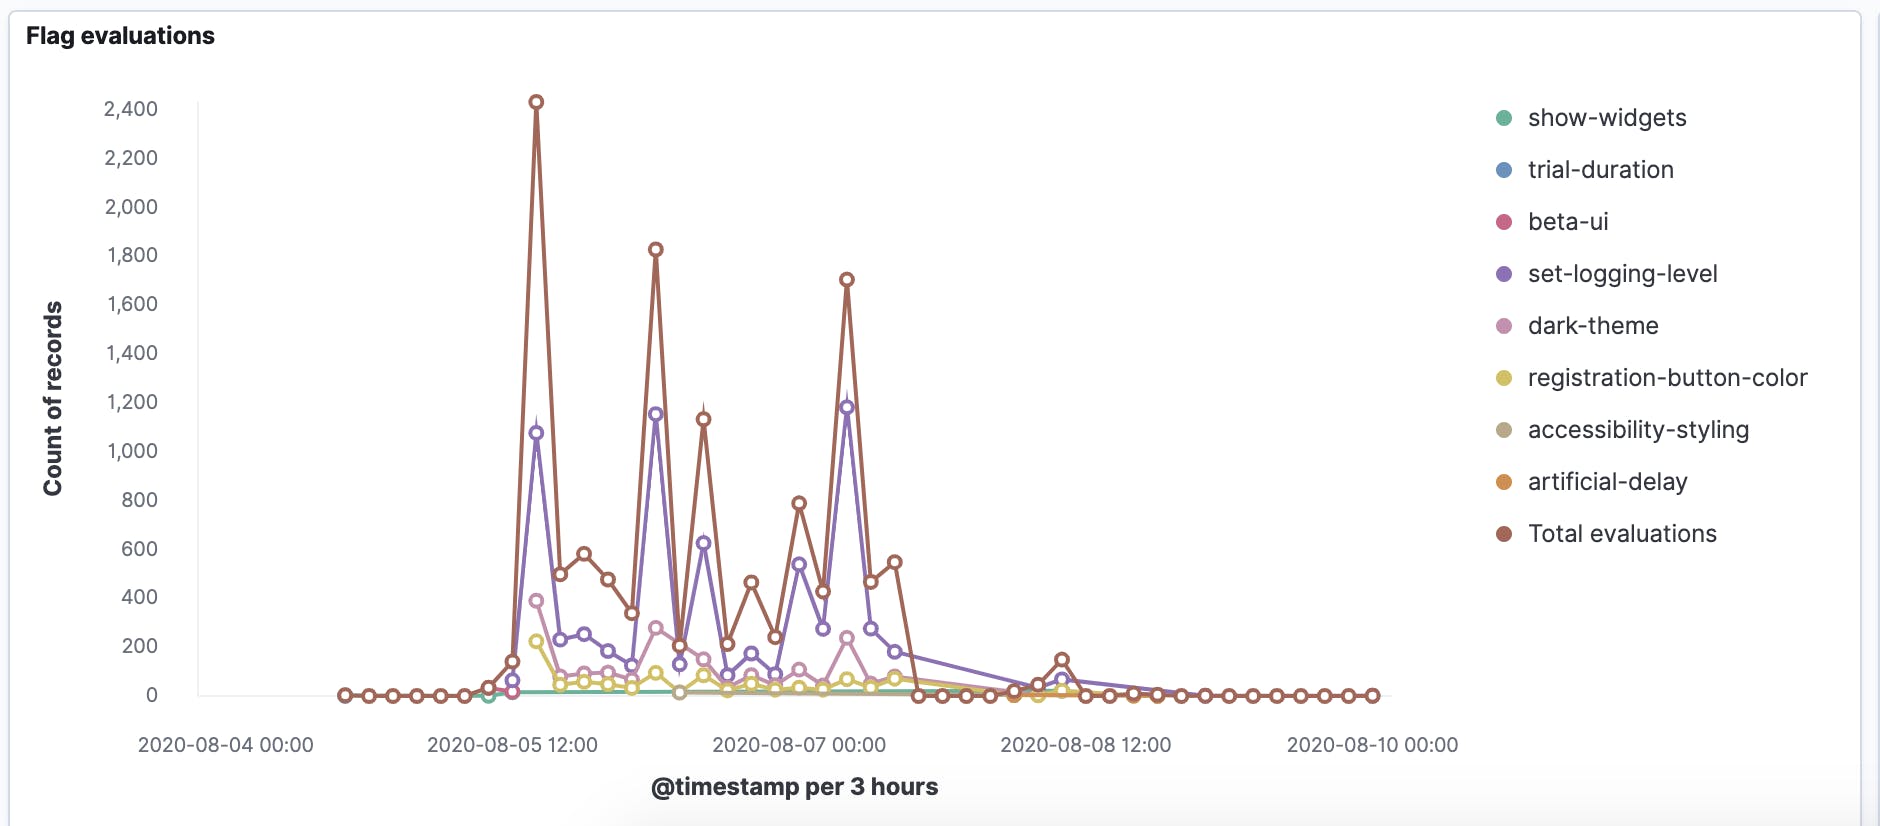
When working on multiple features, teams are interested in tracking the feature exposure to users. Based on flag evaluation events, this chart shows the number of users evaluating each flag as well as the total number of flag evaluations.
How many users receive each variation?
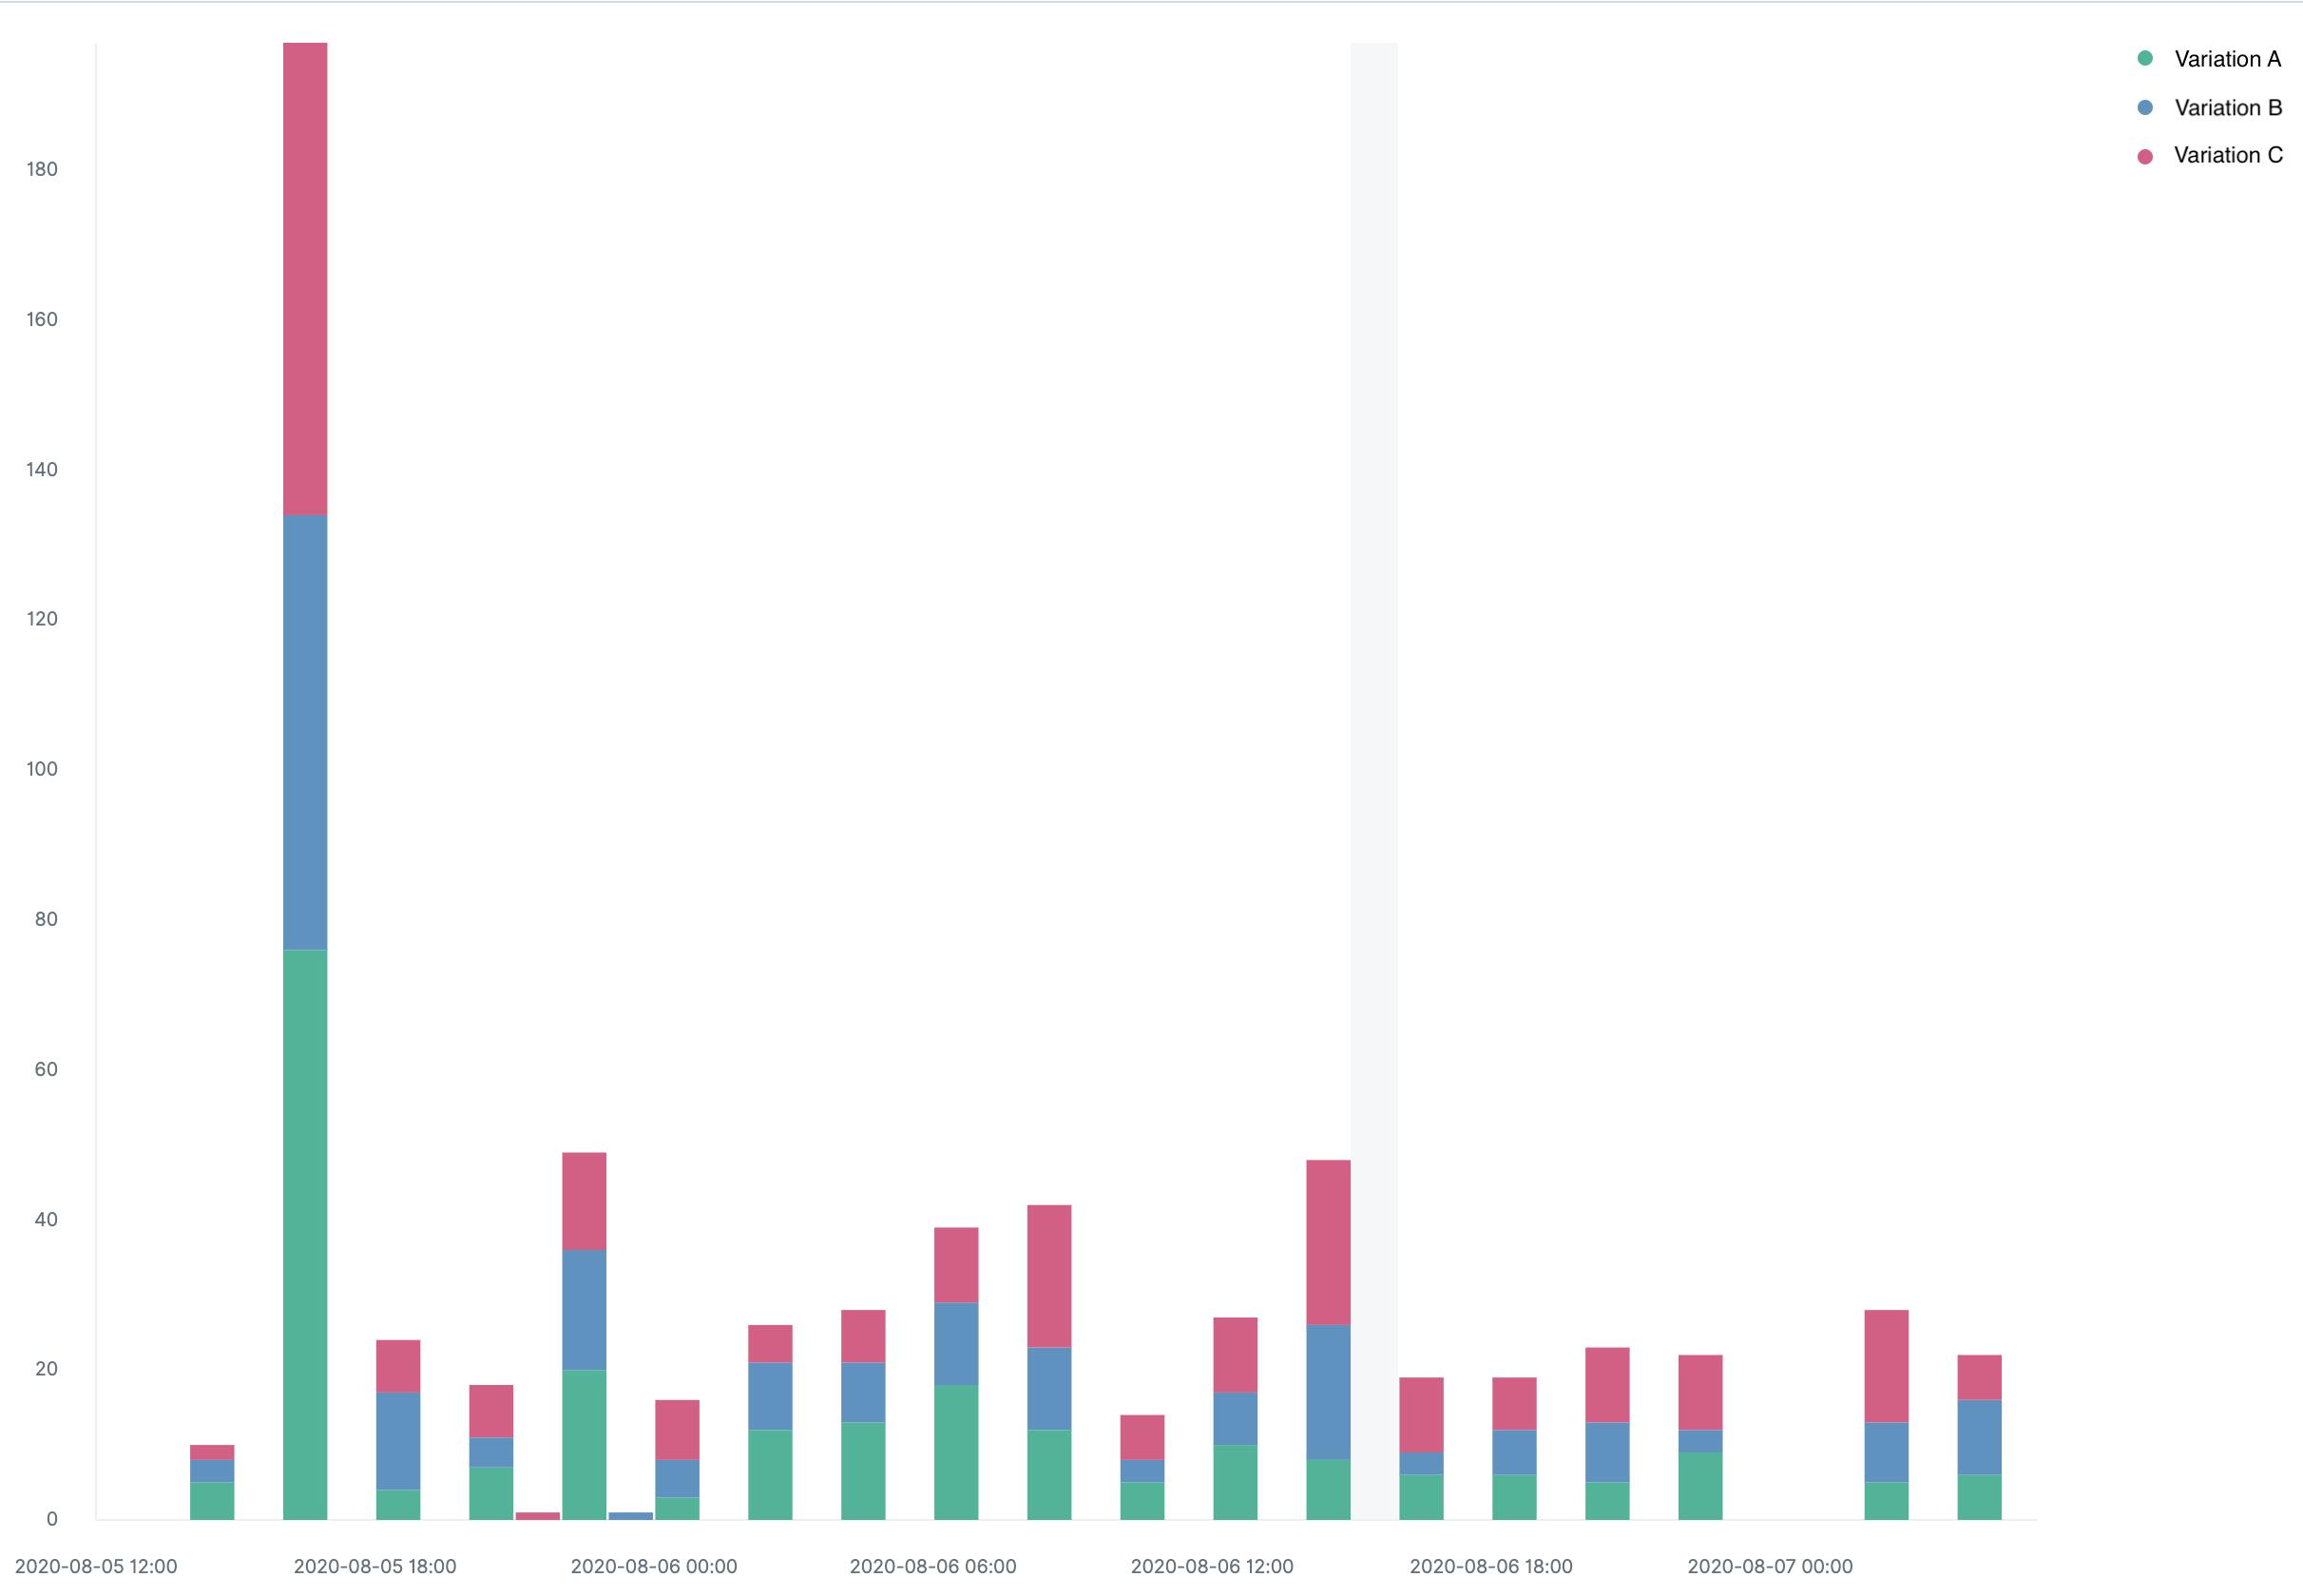
Drilling down to a specific flag, it is easy to see how many users see each variation of this multivariate flag.
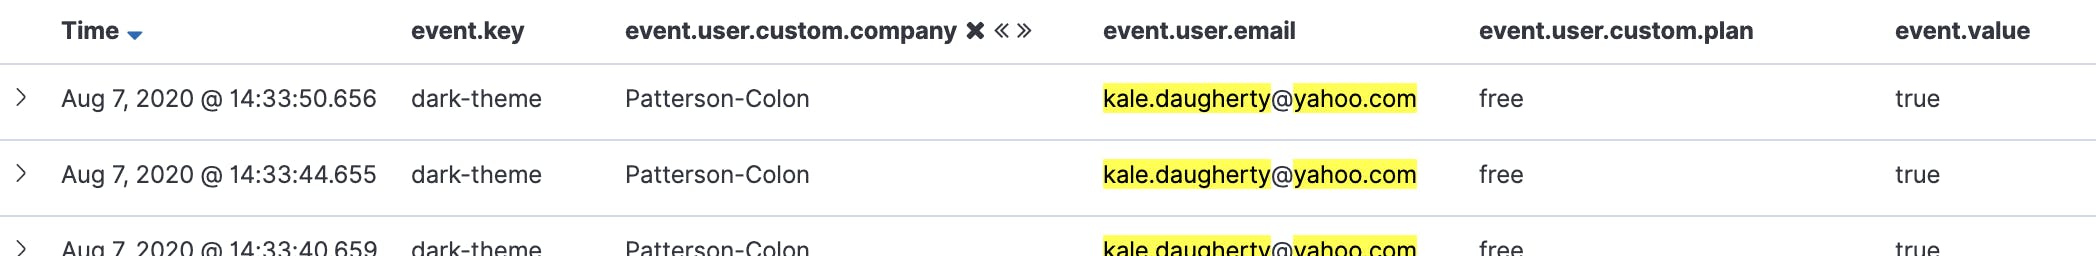
When users encounter problems, you want to be able to know which feature variation they are seeing. As Data Export events are streamed in real-time, support teams can use the information to understand the exact feature combination a customer is seeing and investigate issues quickly. This example uses Data Export feature events to show if ‘dark-theme' feature is enabled for this user.
In summary, in this blog post, we shared a few examples of using Data Export events to obtain valuable information for your development, business, and support teams. To get started with Data Export, check out our documentation.


.webp)


