How to measure the performance of a website

Summary
In this post, learn how to isolate the root cause of a poor digital experience. See why it’s important to measure performance of a website from multiple different locations and observe the metrics over time.
If you’re a person who works from home, you almost certainly have to deal with occasional internet connection issues. More often than complete outages, you’re likely dealing with occasional slowness. And you know from experience that any one of dozens of devices and services along the path can cause latency. To be more specific: slowness can be introduced as your digital connection traverses your PC, the local wifi/wired connection, the local ISP, the Tier 1 or Tier 2 provider, or the CDN that provides the hardware which hosts the web server running the application.
Given all that can impact the perceived speediness of the website that you are trying to reach, you can’t simply measure the performance of a website without simultaneously keeping track of all the other factors that could be impacting a connection. What’s more, you also can’t assume that a single test instance will provide an accurate picture of a possible problem. One-shot tests don’t take into account the hiccups.
A case of the hiccups
Hiccups, for example, can occur when something happens on your computer that causes the operating system to respond a little slower, albeit maybe by just a few hundred milliseconds. As a result, this event introduces additional slowness. This isn’t a big deal if you run a test every minute and evaluate the results over time.
Or, perhaps one or more of the 10-20 routers in the path needed to reach the destination gets busy for a hundred milliseconds or so. A hiccup can even result from other services hosted on the same machine as your application competing for the same compute resources.
False alarms
The above events happen nearly every minute of every connection you maintain. Because of the constant bombardment of requests hitting one or more devices, frequently, tests are going to create an alarm. Yet, few of these alarms may represent a service-impacting condition. An algorithm is needed to ascertain the overall digital experience and keep frequent notices in check. If the test alerted ops for every threshold violation, false positives would be routine. False alarms occur when you receive alerts of a performance problem, but there isn’t a digital experience issue. Remember the story of Chicken Little?
Multiple factors impact the performance of a website
Measuring a website’s performance is accurately represented when monitoring several metrics. Some of the metrics include but are not limited to:
Response size: This is the volume of data your browser is trying to download to display a page. This includes all HTML, style sheets, cookies, any javascript that has to execute, etc. And, of course, whether or not any of this is cached locally in your browser. For a test to be considered accurate, it should be hitting the same page(s) in question.
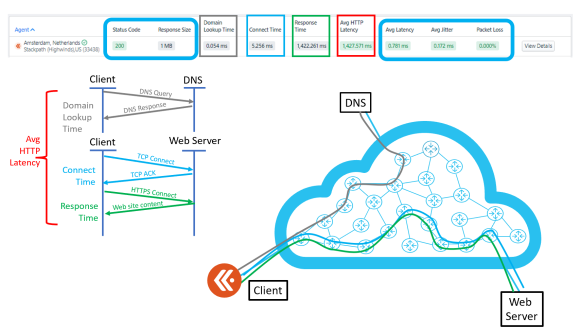
Domain lookup time: When a connection is made to a domain, the local operating system must first reach out to the DNS to resolve that hostname to an IP address. Where is the DNS? Is your PC using a DNS on the same local area network as your computer? More and more often, end users are leveraging a service provider’s DNS, which adds a measurable amount of latency. Ask yourself, do you want your test to query the DNS every time the test executes, or should it use the same IP address from the last test? This would cut time off the test.
Connect time: Prior to downloading the entire web page, a TCP connection is established between your PC and the application. Your PC sends out what is called a “SYN” packet to the destination’s IP address. Upon receiving the SYN, the destination will respond with an “ACK.” The speed of this handshake can be measured and stored in milliseconds.
Response time: This is the difference in timestamps between when the first byte of the page is received to when the last byte of the page is received. Look above at the response size. The HTML, the CSS, etc. all have to be downloaded.
Average HTTP latency: This metric is the combined values of domain lookup time, connect time and response time.
Latency: Putting the application, the server and the DNS response times aside for a moment, obviously the network can be a big factor when measuring performance. Wifi strength, multiple routers in the path, and cable/fiber quality can and do play a major role in the overall perceived performance of a website. Pinging the IP address the application resides on can give a reasonably accurate measurement of network response time. The use of ICMP vs. TCP or UDP to carry the ping can also be a factor. Some vendors like to compare the latency metric with the response time measurement as both of these metrics are reasonably good numbers for measuring overall network slowness.
Jitter: When end systems and servers aren’t overly burdened with workloads, the timing in which successive packets are sent for a single file is generally consistent. If the inter-arrival time of datagrams is not consistent, the deviance from the inter-arrival time is considered jitter. Although first introduced in application monitoring over concerns with voice and video quality, jitter ends up being a fantastic metric to pay attention to when measuring a website’s performance.
Packet loss: Unlike voice and video, conversations in file transfers cannot continue if pieces of a file are missing. If a packet containing data is dropped, the other end, depending on the session layer protocol, will definitely pick up on it and hold on processing the entire download until the missing datagram is resent. Missed packets cause latency because they force the receiving side to wait until the missing piece is present. A second way packet loss is measured is with ping or traceroute. These applications send out hello messages to a destination and measure the response time. When a response is not received, it is considered dropped. But, that doesn’t always mean there is a congestion issue. However, these protocols are a great latency measurement tool and should be kept in your tool kit.
A summary diagram of the above metrics is shown below:

Notice the “Status Code” in the upper left of the image above. This is a value sent back from the web page and generally shouldn’t ever change.
Different angles
After your test is up and running, despite the layers of measuring a website’s performance, it still should not be relied upon as the sole measure of digital experience. Why is this? Because it is a single perspective. Think about it. When you’re faced with a big decision, you might get advice from multiple people in order to make sure you are making the right choice. The same holds true when it comes to determining if a digital service is slow. You may ask others if they are experiencing the same slowness.
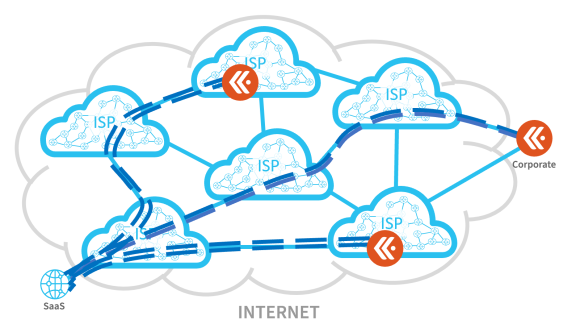
And, although asking others if something is slow can be helpful, it is hardly an accurate measurement. For this reason, it is a good idea to introduce synthetic probes that will test the performance of a website from geographically dispersed locations.

Synthetic application monitoring
By measuring performance of a website from multiple different locations and observing the metrics over time, the level of certainty can be improved. This can be used to isolate the root cause of a poor digital experience.
If you would like to learn how to move traffic around a trouble spot on the internet or learn more on how to measure the performance of a website using synthetic monitors, reach out to the team at Kentik.


