Instrumenting Lambda with Traces: A Complete Example in Python
By Travis Redman | Last modified on January 10, 2020We’re big fans of AWS Lambda at Honeycomb. As you may have read, we recently made some major improvements to our storage engine by leveraging Lambda to process more data in less time. Making a change to a complex system like our storage engine is daunting, but can be made less so with good instrumentation and tracing. For this project, that meant getting instrumentation out of Lambda and into Honeycomb. Lambda has some unique constraints that make this more complex than you might think, so in this post we’ll look at instrumenting an app from scratch.
Bootstrapping the app
Before we begin, you’ll want to ensure you have the Serverless framework installed and a recent Python version (I’m using 3.6). For this example, I picked a Serverless Python TODO API template in the Serverless Examples repo. I like this particular template for demonstration because it sets up an external dependency (DynamoDB), which gives us something interesting to look at when we’re tracing. To install the demo app:
$ sls install --url https://github.com/serverless/examples/tree/master/aws-python-rest-api-with-dynamodb --name my-sls-app
You should see a project directory with some contents like this:
$ cd my-sls-app && ls
README.md    package.json    serverless.yml    todos
There’s just a bit more to add before we get going. We want to install honeycomb-beeline in our app, so we’ll need to package the Python requirements:
# install the serverless-python-requirements module
$ npm install --save-dev serverless-python-requirements
# install beeline-python in a venv, then export the requirements.txt
$ virtualenv venv --python=python3
$ source venv/bin/activate
$ pip install honeycomb-beeline
$ pip freeze > requirements.txt
Now edit serverless.yml and add the following:
# essentially, this injects your python requirements into the package
# before deploying. This runs in docker if you're not deploying from a linux host
plugins:
  - serverless-python-requirements

custom:
  pythonRequirements:
    dockerizePip: non-linux
Now we can deploy using sls deploy:
Serverless: Packaging service...
[...]
endpoints:
  POST - https://mtd8iptz1m.execute-api.us-east-2.amazonaws.com/dev/todos
  GET - https://mtd8iptz1m.execute-api.us-east-2.amazonaws.com/dev/todos
  GET - https://mtd8iptz1m.execute-api.us-east-2.amazonaws.com/dev/todos/{id}
  PUT - https://mtd8iptz1m.execute-api.us-east-2.amazonaws.com/dev/todos/{id}
  DELETE - https://mtd8iptz1m.execute-api.us-east-2.amazonaws.com/dev/todos/{id}
functions:
  create: my-sls-app-dev-create
  list: my-sls-app-dev-list
  get: my-sls-app-dev-get
  update: my-sls-app-dev-update
  delete: my-sls-app-dev-delete
A few curl calls against the new endpoints confirm we’re in good shape!
$ curl https://mtd8iptz1m.execute-api.us-east-2.amazonaws.com/dev/todos
# db is empty initially
[]
$ curl -X POST -d '{"text": "write a blog post"}' https://mtd8iptz1m.execute-api.us-east-2.amazonaws.com/dev/todos
{"id": "267199de-25c0-11ea-82d7-e6f595c02494", "text": "write a blog post", "checked": false, "createdAt": "1577131779.711644", "updatedAt": "1577131779.711644"}
$ curl https://mtd8iptz1m.execute-api.us-east-2.amazonaws.com/dev/todos
[{"checked": false, "createdAt": "1577131779.711644", "text": "write a blog post", "id": "267199de-25c0-11ea-82d7-e6f595c02494", "updatedAt": "1577131779.711644"}]
Implementing tracing
The first step is to initialize the beeline. The todos/__init__.py file is a great place to drop that init code so that it gets pulled in by all of the Lambda handlers.
import beeline
beeline.init(writekey='YOURWRITEKEY', service_name='todo-app', dataset='my-sls-app')
Now let’s look at that curl we ran earlier. That’s hitting the list function on the API. Let’s open this up and add some instrumentation.
# ...

import beeline
from beeline.middleware.awslambda import beeline_wrapper

# The beeline_wrapper decorator wraps the Lambda handler here in a span. By default,
# this also starts a new trace. The span and trace are finished when the function exits
# (but before the response is returned)
@beeline_wrapper
def list(event, context):
    table = dynamodb.Table(os.environ['DYNAMODB_TABLE'])
    beeline.add_context_field("table_name", table)

    # This call to our db dependency is worth knowing about - let's wrap it in a span.
    # That's easy to do with a context manager.
    with beeline.tracer("db-scan"):
        # fetch all todos from the database
        result = table.scan()

    # .. capture any results we want to include from this function call
    beeline.add_context({
        'status_code': 200,
        'num_items': len(result['Items'])
    })

    # create a response
    response = {
        "statusCode": 200,
        "body": json.dumps(result['Items'], cls=decimalencoder.DecimalEncoder)
    }
    return response
Another sls deploy gets our instrumentation out there. Once deployed, I can re-run that curl again. Now I have a trace in my dataset!
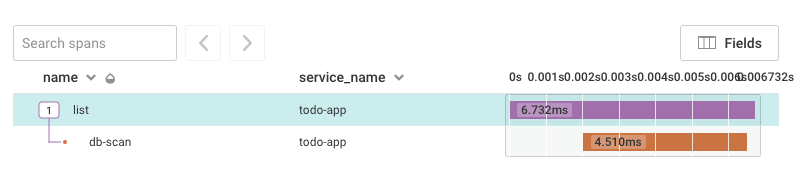
The trace shows me a Lambda runtime of 6.7ms, but from the client, it seemed slow, so I check the Lambda execution logs and see:
REPORT RequestId: def28374-1e35-429b-8667-3ab481b61ad4 Duration: 37.27 ms
Why the discrepancy?
The instrumentation performance tax
The lifecycle of a Lambda container is tricky. You may already know about cold starts. That is, your code isn’t really running until it is invoked, and when it does run, the container has to start up and this can add latency to your initial invocation(s). Once your function returns a response, it goes into a frozen state, and execution of any running threads is suspended. From there, the container may be reused (without the cold start penalty) by subsequent requests, or terminated. This termination is not done gracefully, and thus the running function isn't given a chance to do housekeeping.
What does that mean if you’re trying to send telemetry?
- Typical client patterns using delayed batching, like those used in our SDKs, are unreliable in Lambda, since the batch transmission thread(s) may never get a chance to run after the function exits.
- Anything that needs to be sent reliably must be sent before the function returns
That’s why if you crack open the Beeline middleware code for Lambda, you’ll see this line:
beeline.get_beeline().client.flush()
This is our way of ensuring event batches are sent before the function exits. But it isn't free. The effect of this is that it delays response to the client by the round-trip time from your Lambda to our API. For many use cases, that's an acceptable tradeoff for getting instrumentation out of Lambda. But what if your application (or your user) is latency-sensitive?
Cloudwatch logs to the rescue
There is one way to synchronously ship data from a Lambda function without significant blocking: logging.
If you want detailed telemetry without a performance hit, this is the currently the only way to go. Each Lambda function writes to its own Cloudwatch Log stream, and AWS makes it relatively easy to subscribe to those streams with other Lambda functions. Here’s where we introduce the Honeycomb Publisher for Lambda.
The Publisher can subscribe to one or more Cloudwatch Log streams, pulling in event data in JSON format and shipping it to the correct dataset. To use it, you need to deploy it and subscribe it to your Lambda function(s) log streams, then configure your app to emit events via logs.
Switching to log output
The Python Beeline makes it easy to override the event transmission mechanism. For our purpose here, we’ll use the built-in FileTransmission with output to sys.stdout:
import sys
import beeline
import libhoney
from libhoney.transmission import FileTransmission
beeline.init(
    writekey='can be anything',
    service_name='todo-app',
    dataset='my-sls-app',
    transmission_impl=FileTransmission(output=sys.stdout)
)
That’s all we need to do to have events flow to Cloudwatch instead of the Honeycomb API. Note that you do not need to set a valid writekey when using the FileTransmission. The Publisher will have responsibility for authenticating API traffic.
If you execute your app after deploying this, you should see span data in the Cloudwatch Logs for the Lambda function.
{
    "time": "2019-12-17T16:54:20.355317Z",
    "samplerate": 1,
    "dataset": "my-sls-app",
    ...
    "data": {
       "service_name": "todo-app",
       "meta.beeline_version": "2.11.2",
       ...
      "duration_ms": 6.47
    }
}
Also note the shorter Lambda run time, now that we aren’t blocking on an API call before exiting:
REPORT RequestId: 30ff2be3-2c0b-4869-8da3-7af280dfc76c Duration: 9.41 ms
Deploying the Publisher
The Publisher is another Lambda function, so if you are familiar with integrating third-party Lambda functions in your stack, you should use the tools and methods that work best for you. We provide a helpful, generic Cloudformation Template to walk you through installation of it and to document its AWS dependencies. Since we’re using Serverless in this tutorial, though, let’s see if we can make a it a “native” part of our project!
Serverless allows you to describe ancillary AWS resources to spin up alongside your stack. In our case, we want to bolt on the publisher and its dependencies whenever we deploy our app. In the serverless.yml, append the following to the resources block of the sample app:
resources:
  Resources:
    TodosDynamoDbTable:
      # ...
    PublisherLambdaHandler:
      Type: 'AWS::Lambda::Function'
      Properties:
        Code:
          S3Bucket: honeycomb-integrations-${opt:region, self:provider.region}
          S3Key: agentless-integrations-for-aws/LATEST/ingest-handlers.zip
        Description: Lambda function for publishing asynchronous events from Lambda
        Environment:
          Variables:
            HONEYCOMB_WRITE_KEY: 'YOURHONEYCOMBKEY'
            DATASET: 'my-sls-app'
        FunctionName: PublisherLambdaHandler-${self:service}-${opt:stage, self:provider.stage}
        Handler: publisher
        MemorySize: 128
        Role:
          "Fn::GetAtt":
            - LambdaIAMRole
            - Arn
        Runtime: go1.x
        Timeout: 10
    ExecutePermission:
      Type: "AWS::Lambda::Permission"
      Properties:
        Action: 'lambda:InvokeFunction'
        FunctionName:
          "Fn::GetAtt":
            - PublisherLambdaHandler
            - Arn
        Principal: 'logs.amazonaws.com'
    LambdaIAMRole:
      Type: "AWS::IAM::Role"
      Properties:
        AssumeRolePolicyDocument:
          Version: "2012-10-17"
          Statement:
            - Effect: "Allow"
              Principal:
                Service:
                  - "lambda.amazonaws.com"
              Action:
                - "sts:AssumeRole"
    LambdaLogPolicy:
      Type: "AWS::IAM::Policy"
      Properties:
        PolicyName: "lambda-create-log"
        Roles:
            - Ref: LambdaIAMRole
        PolicyDocument:
          Version: "2012-10-17"
          Statement:
            - Effect: Allow
              Action:
                - logs:CreateLogGroup
                - logs:CreateLogStream
                - logs:PutLogEvents
              Resource: 'arn:aws:logs:*:*:*'
    # add one of me for each function in your app
    CloudwatchSubscriptionFilterList:
      Type: "AWS::Logs::SubscriptionFilter"
      Properties:
        DestinationArn:
          "Fn::GetAtt":
            - PublisherLambdaHandler
            - Arn
        LogGroupName: /aws/lambda/${self:service}-${opt:stage, self:provider.stage}-list
        FilterPattern: ''
      DependsOn: ExecutePermission
That’s a lot of boilerplate! The main things you’ll want to take note of is setting a valid value for HONEYCOMB_WRITE_KEY and add SubscriptionFilter resources for each function in your stack. Run sls deploy one more time and you should now see a new function, PublisherLambdaHandler-my-sls-app-dev, deployed alongside your Lambda functions. The Publisher will be subscribed to your app’s Cloudwatch Log Streams and will forward events to Honeycomb.
Leveling up with distributed tracing
Lambda functions don’t always run in a vacuum - often they are executed as part of a larger chain of events. You can link your Lambda instrumentation with your overall application instrumentation with distributed traces. To do this, you need to pass trace context from the calling app to your Lambda-backed service. Let’s look at a practical example by building on our existing app. We already have a todo API implemented in Lambda. Let’s assume we’re building a UI on top of that. We have some code that fetches the list of items from the API and then renders them.
@beeline.traced(name="todo_list_view")
def todo_list_view():
    with beeline.tracer(name="requests_get"):
        todo_list = requests.get('https://mtd8iptz1m.execute-api.us-east-2.amazonaws.com/dev/todos')

    render_list(todo_list)

@beeline.traced(name="render_list")
def render_list(l):
    # ...
The HTTP request to fetch the list of todo items is done using the requests lib. This get call is wrapped in a trace span to measure the request time. We know that list is instrumented with tracing, so it would be nice if we could link those spans to our trace!
@beeline.traced(name="todo_list_view")
def todo_list_view():
    with beeline.tracer(name="requests_get"):
        context = beeline.get_beeline().tracer_impl.marshal_trace_context()
        todo_list = requests.get('https://mtd8iptz1m.execute-api.us-east-2.amazonaws.com/dev/todos',
                                headers={'X-Honeycomb-Trace': context})

    render_list(todo_list)
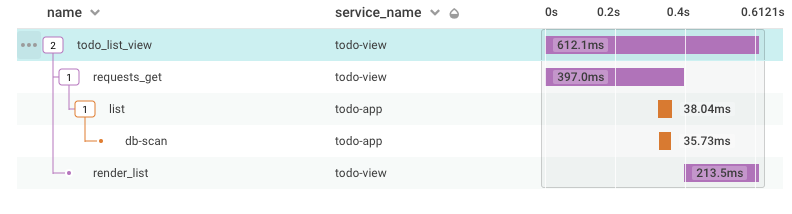
marshal_trace_context builds a serialized trace context object, which can be passed to other applications via request header or payload. The Lambda middleware automatically looks for a header named X-Honeycomb-Trace and extracts the context object, adopting the trace ID and caller’s span ID as its parent rather than starting an all-new trace. All we need to do is pass this context object as a request header before we call the list endpoint. Adding the header is demonstrated manually here, but the beeline provides a patch for the requests lib that will do this for you. Simply import beeline.patch.requests into your application after importing the requests lib.
When we call todo_list_view in our UI app, we now see one trace with spans from both services:
Go Serverless with confidence
Building and running apps with Lambda can be complex and is not without challenges, but with distributed tracing and rich instrumentation, there’s no need to fumble around in the dark.
Ready to instrument your serverless apps? Sign up for a free trial.
Related Posts
How We Leveraged the Honeycomb Network Agent for Kubernetes to Remediate Our IMDS Security Finding
Picture this: It’s 2 p.m. and you’re sipping on coffee, happily chugging away at your daily routine work. The security team shoots you a message...
Start with Traces, not with Logs: How Honeycomb Helped Massdriver Reduce Alert Fatigue
Before Massdriver, Dave worked in product engineering where he was constantly bogged down with DevOps toil. He spent his time doing everything except what he...
Infinite Retention with OpenTelemetry and Honeycomb
Honeycomb is massively powerful at delivering detailed answers from the last several weeks of system telemetry within seconds. It keeps you in the flow state...