

HFC Network
Expanded Testing of Video Conferencing Bandwidth Usage Over 50/5 Mbps Broadband Service

As working from home and remote schooling remain the norm for most of us, we wanted to build on and extend our prior investigation of the bandwidth usage of popular video conferencing applications. In this post, we examine the use of video conferencing applications over a broadband service of 50 Mbps downstream and 5 Mbps upstream (“50/5 broadband service”). The goal remains the same, looking at how many simultaneous conferencing sessions can be supported on the access network using popular video conferencing applications. As before, we examined Google Meet, GoToMeeting, and Zoom, and this time we added Microsoft Teams and an examination of a mix of these applications. To avoid any appearance of endorsement of a particular conferencing application, we haven’t labeled the figures below with the specific apps under test.
We used the same network equipment from November. This includes the same cable equipment as the previous blog -- the same DOCSIS 3.0 Technicolor TC8305c gateway, supporting 8 downstream channels and 4 upstream channels, and the same CommScope E6000 cable modem termination system (CMTS).
The same laptops were also used, though this time we increased it to 10 laptops. Various laptops were used, running Windows, MacOS and Ubuntu – nothing special, just laptops that were around the lab and available for use. All used wired Ethernet connections through a switch to the modem to ensure no variables outside the control of the broadband provider would impact the speeds delivered (e.g., placement of the Wi-Fi access point, as noted below). Conference sessions were set up and parameters varied while traffic flow rates were collected over time. Throughout testing, we ensured there was active movement in view of each laptop’s camera to more fully simulate real-world use cases.
As in the previous blog, this research doesn’t take into account the potential external factors that can affect Internet performance in a real home -- from the use of Wi-Fi, to building materials, to Wi-Fi interference, to the age and condition of the user’s connected devices -- but it does provide a helpful illustration of the baseline capabilities of a 50/5 broadband service.
As before, the broadband speeds were over-provisioned. For this testing, the 50/5 broadband service was over provisioned by 25%, a typical configuration for this service tier.
First things first: We repeated the work from November using the 25/3 broadband service. And happily, those results were re-confirmed. We felt the baseline was important to verify the setup.
Next, we moved to the 50/5 broadband service and got to work. At a high level, we found that all four conferencing solutions could support at least 10 concurrent sessions on 10 separate laptops connected to the same cable modem with the aforementioned 50/5 broadband service and with all sessions in gallery view. The quality of all 10 sessions was good and consistent throughout, with no jitter, choppiness, artifacts or other defects noticed during the sessions. Not surprisingly, with the increase in the nominal upstream speed from 3 Mbps to 5 Mbps, we were able to increase the number of concurrent sessions from the 5 we listed in the November blog to 10 sessions with the 50/5 broadband service under test.
The data presented below represents samples that were collected every 200 milliseconds over a 5-minute interval (300 seconds) using tshark (the Wireshark network analyzer).
Conferencing Application: A
The chart below (Figure 1) shows total access network usage for the 10 concurrent sessions over 300 seconds (5 minutes) while using one of the above conferencing applications. The blue line is the total downstream usage, and the orange line is total upstream usage. Note that the total upstream usage stays around 2.5 Mbps which may be a result of running 10 concurrent sessions. Also, the downstream usage stays, on average, around 15 mbps, which leaves roughly 35 Mbps of downstream headroom for other services such as streaming video that can also use the broadband connection at the same time.
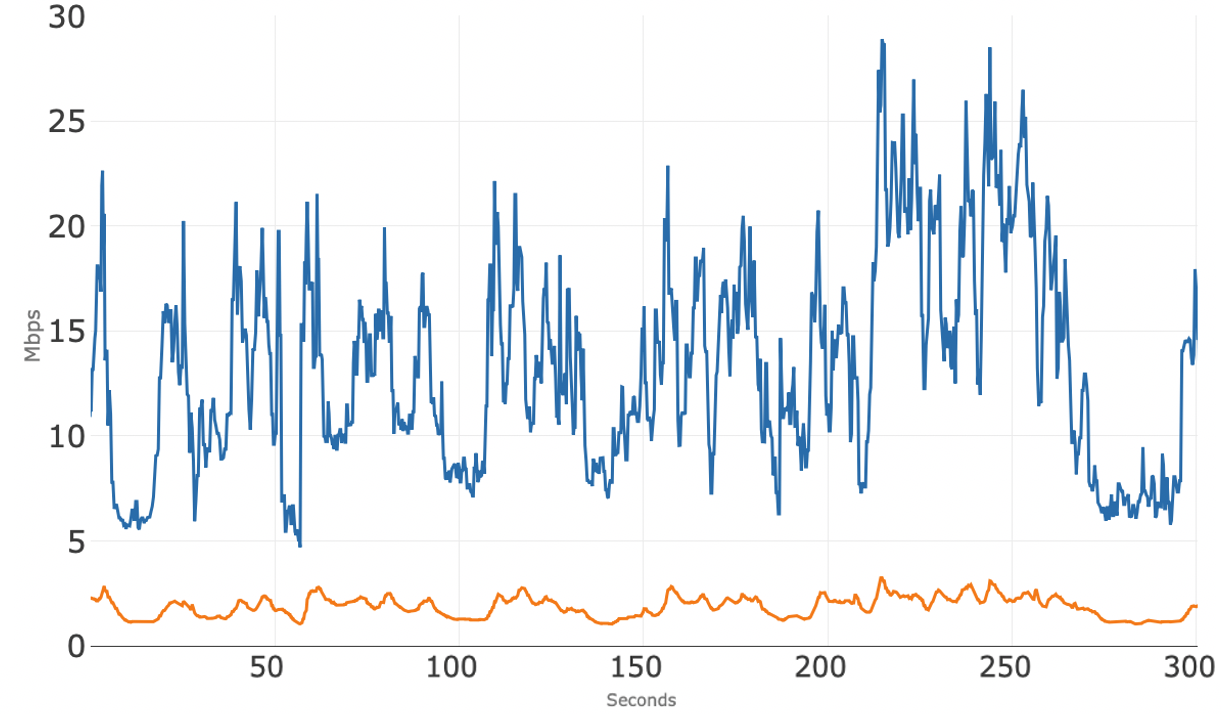
Figure 2 shows the upstream bandwidth usage of the 10 concurrent sessions and it appears that these individual sessions are competing amongst themselves for upstream bandwidth. However, all upstream sessions typically stay well below 0.5 Mbps -- these streams are all independent, with the amount of upstream bandwidth usage fluctuating over time.
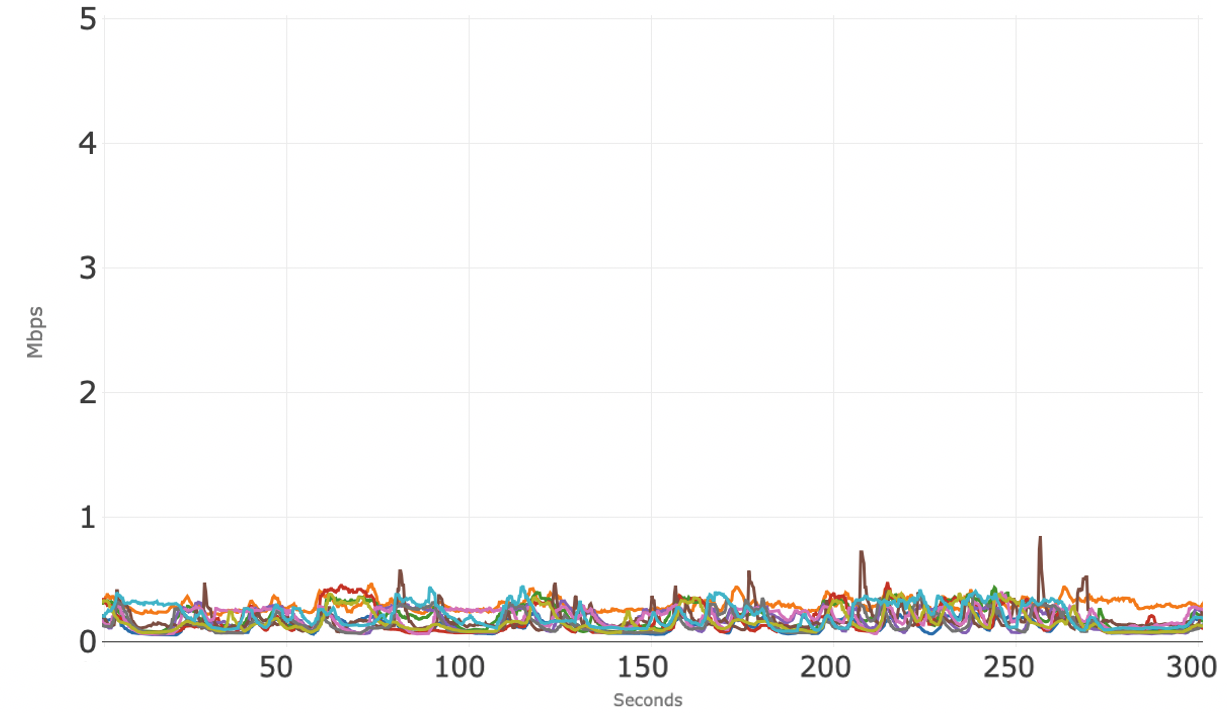
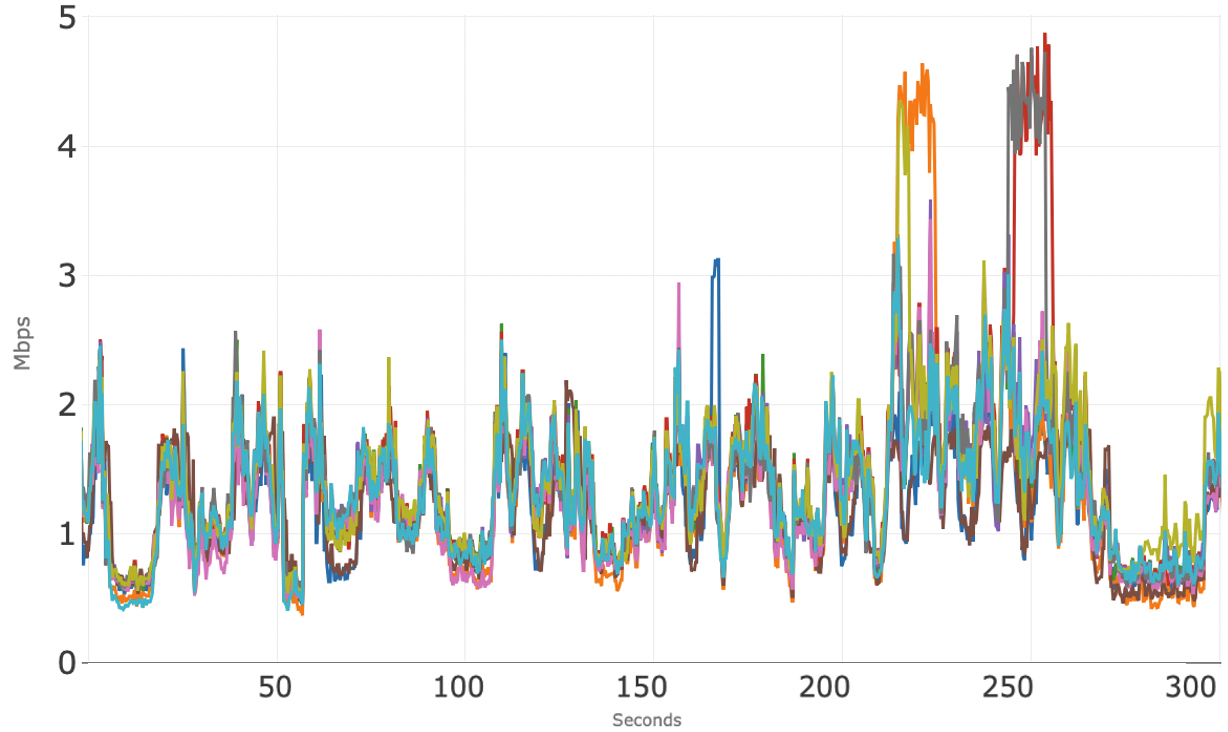
Figure 3 shows the downstream bandwidth usage for the 10 individual conference sessions. Each conference session typically uses between 1 to 2 Mbps. As previously observed with this application, there are short periods of time when some of the sessions use more downstream bandwidth than the typical 1 to 2 Mbps.
Conferencing Application: B
Figure 4 shows access network usage for 10 concurrent sessions over 300 seconds (5 minutes) for the second conferencing application tested. The blue line is the total downstream usage, and the orange line is total upstream usage. Note that the total upstream usage hovers around 3.5 Mbps. The total downstream usage is very tight, right above 10 Mbps.
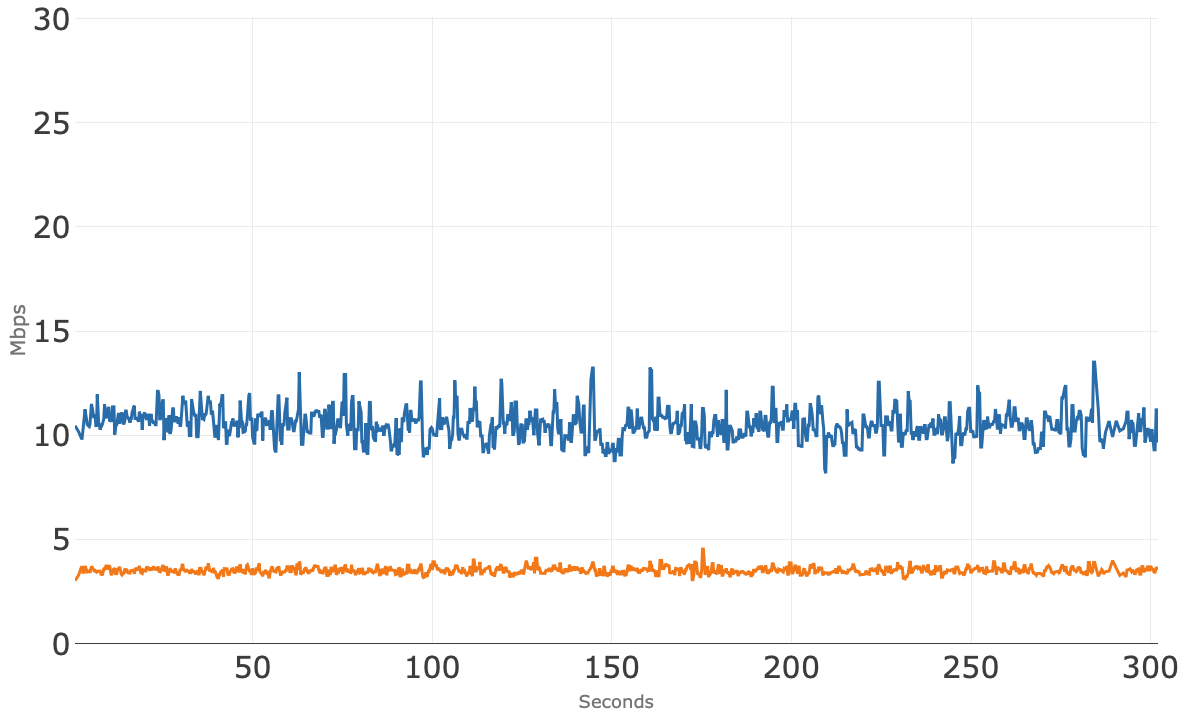
Figure 5 shows the upstream bandwidth usage of the 10 individual conference sessions where all but one session is well below 1 Mbps and that one session is right at 2 Mbps. We don’t have an explanation for why that blue session is so much higher than the others, but it falls well within the available upstream bandwidth.
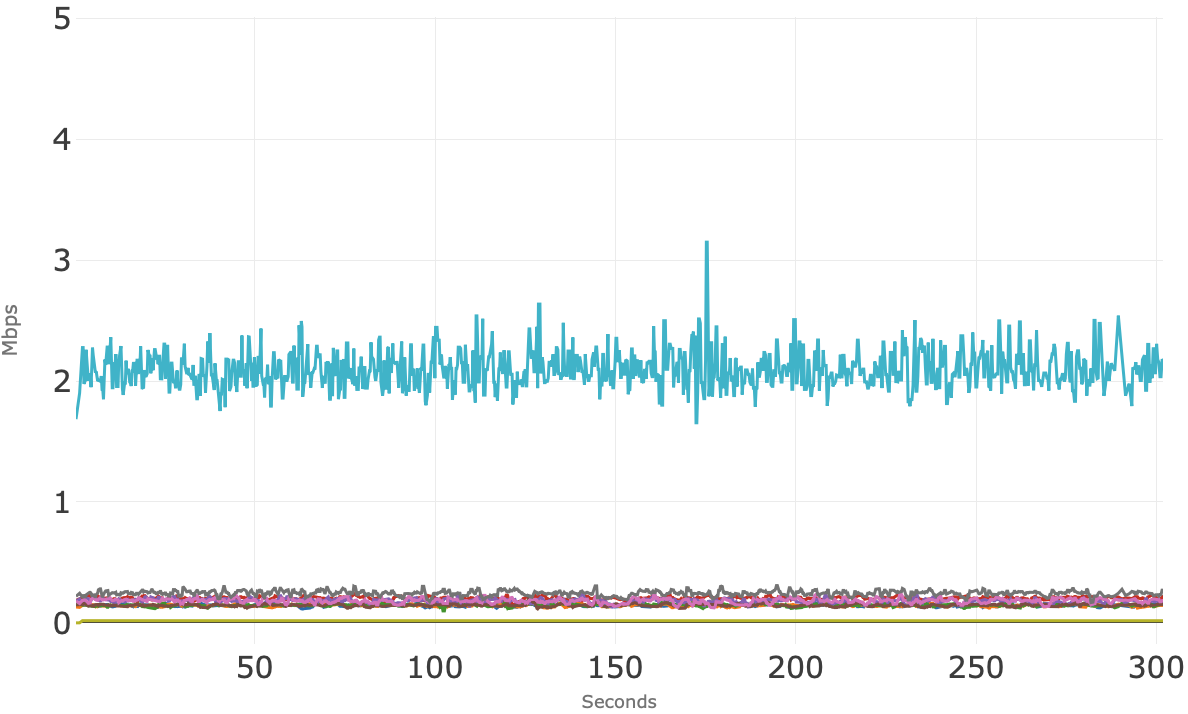
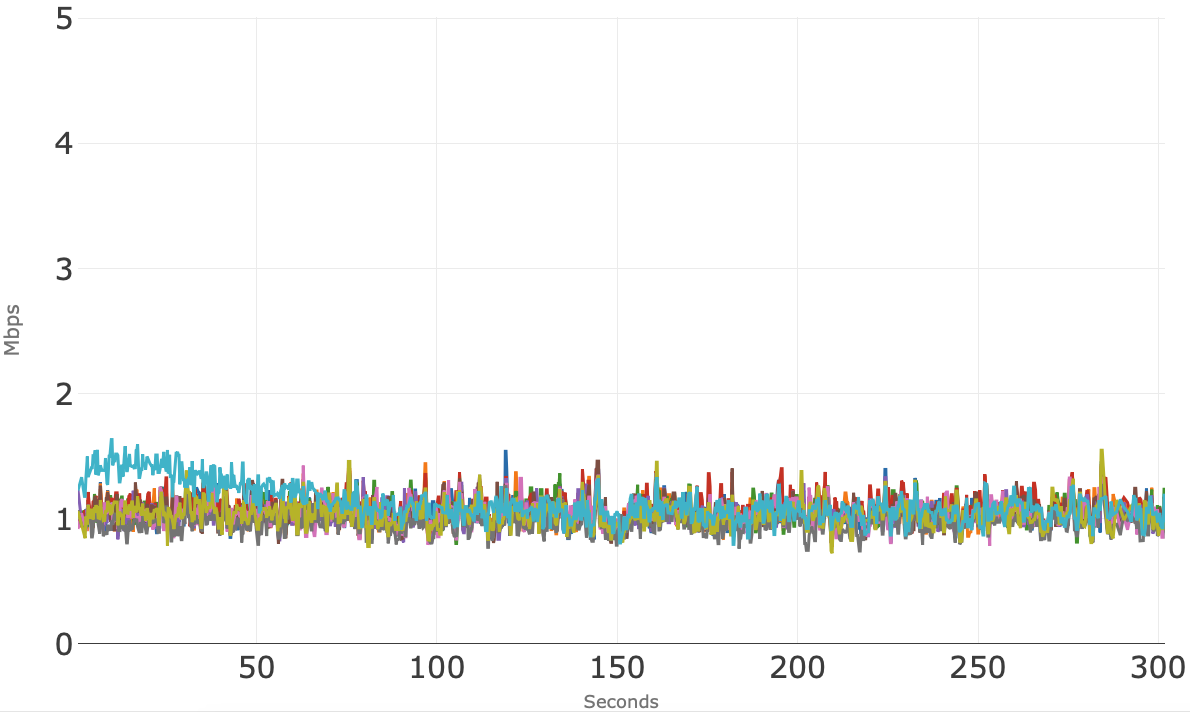
Figure 6 shows the downstream bandwidth usage for the 10 individual conference sessions clusters consistently around 1 Mbps.
Conferencing Application: C
Figure 7 shows access network usage for the 10 concurrent sessions over 300 seconds (5 minutes) for the third application tested. The blue line is the total downstream usage, and the orange line is total upstream usage. Note that the total upstream usage hovers right at 3 Mbps over the 5 minutes.
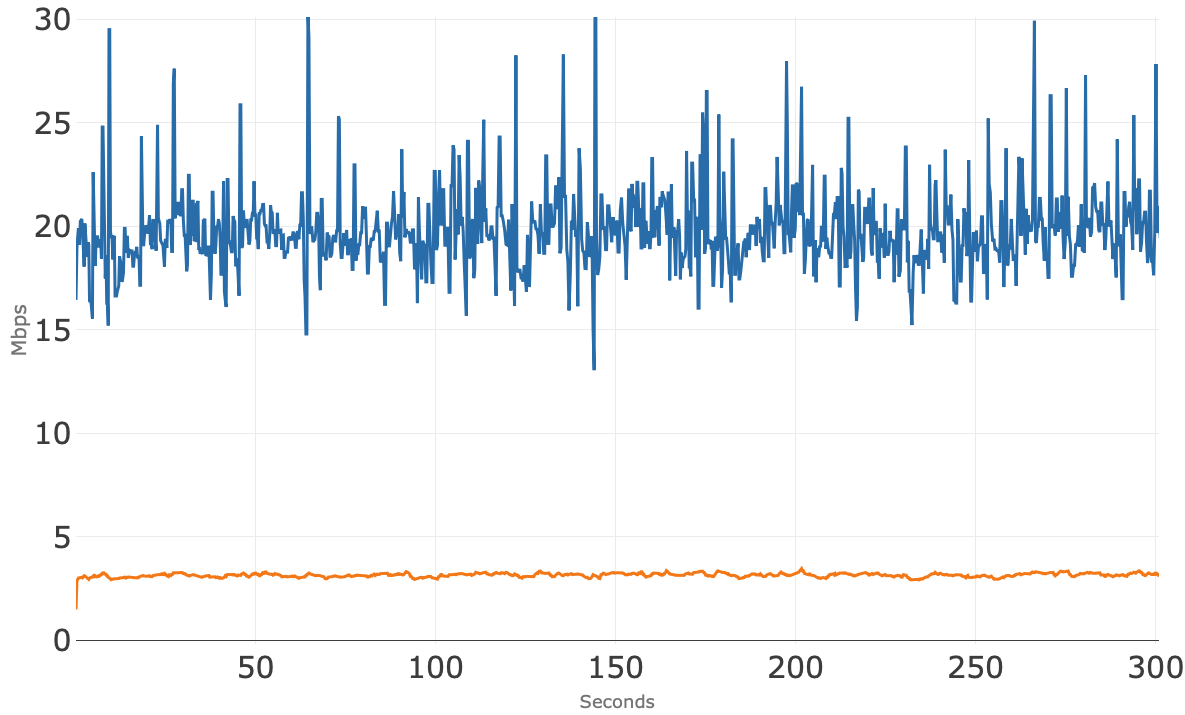
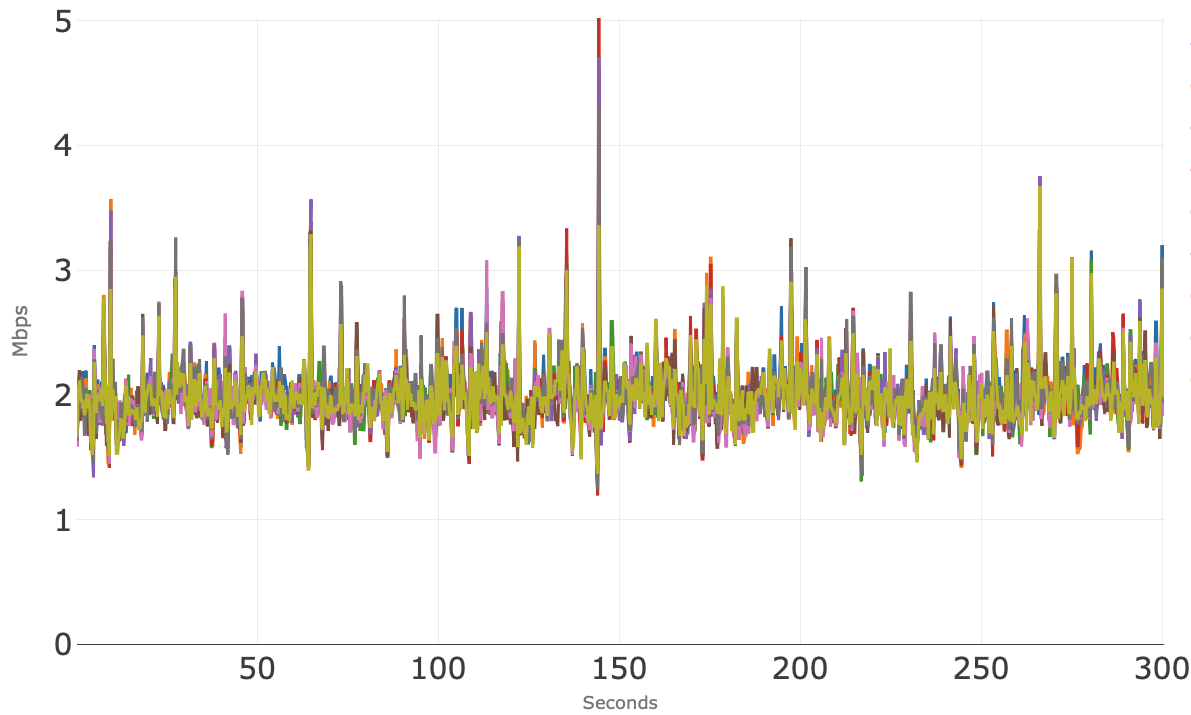
Figure 8 shows the upstream bandwidth usage of the 10 individual conference sessions where all stay well below 1 Mbps.
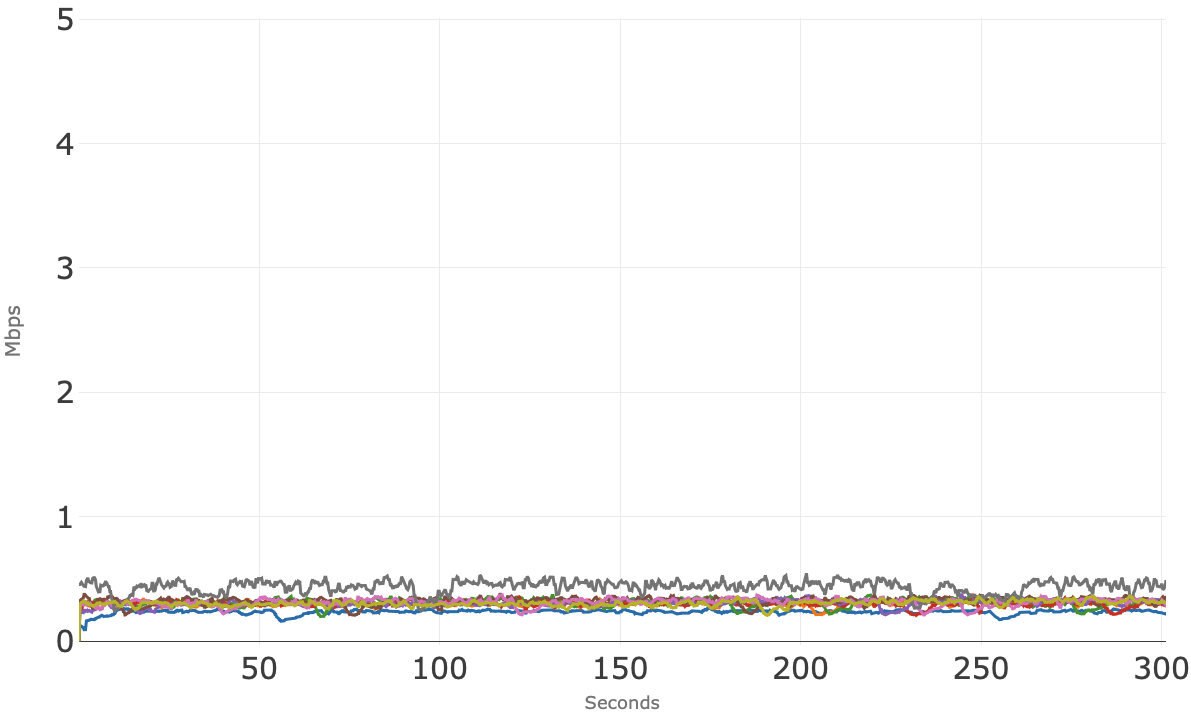
Figure 9 shows the downstream bandwidth usage for the 10 individual conference sessions. These sessions appear to track each other very closely around 2 Mbps, which matches Figure 7 showing aggregate downstream usage around 20 Mbps.
Conference Application: D
Figure 10 shows access network usage for the 10 concurrent sessions over 300 seconds (5 minutes) for the fourth application tested. The blue line is the total downstream usage, and the orange line is total upstream usage. Note that the total upstream usage hovers right at 5 Mbps over the 5 minutes, and there is no visible degradation to the conferencing sessions was observed.
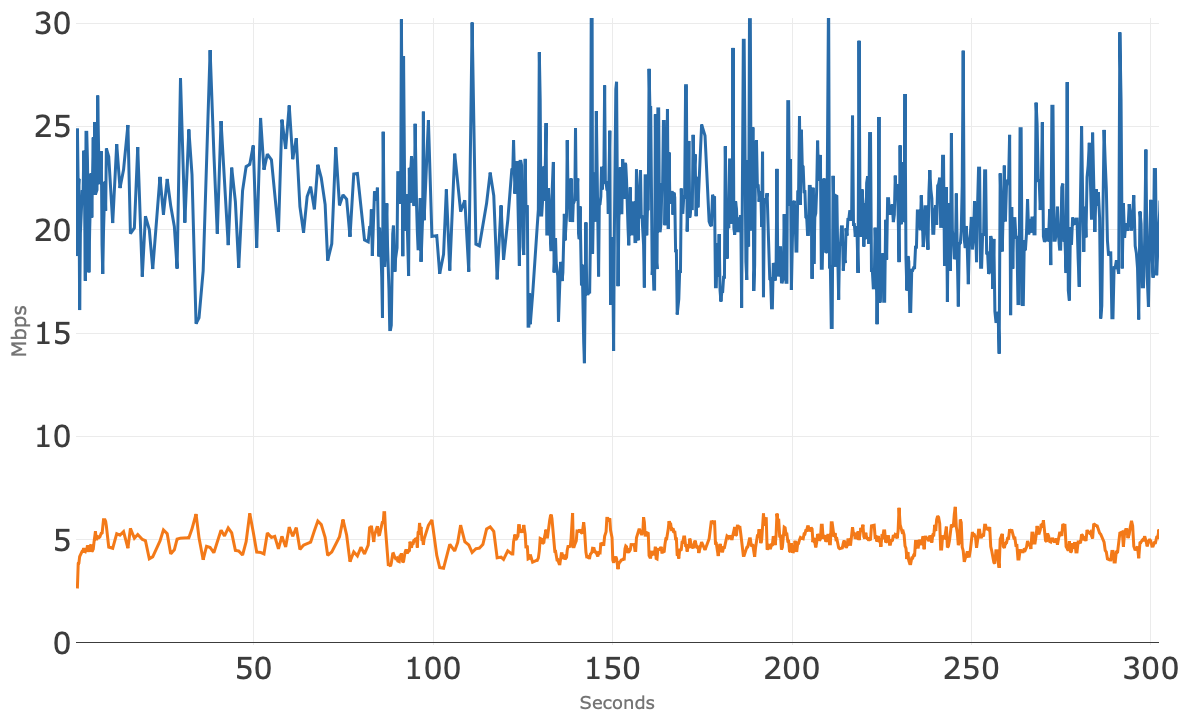
Figure 11 shows the upstream bandwidth usage of the 10 individual conference sessions, where there is some variability in bandwidth consumed per session. One session (red) consistently uses more upstream bandwidth than the other sessions but remained well below the available upstream bandwidth.
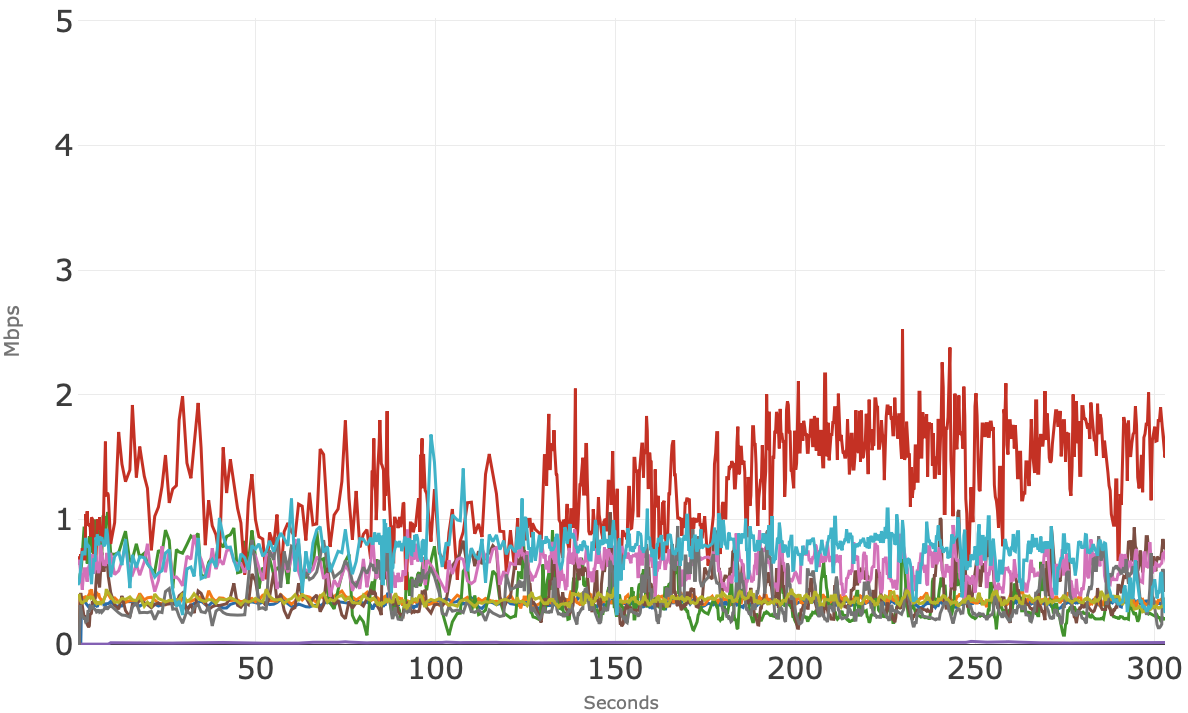
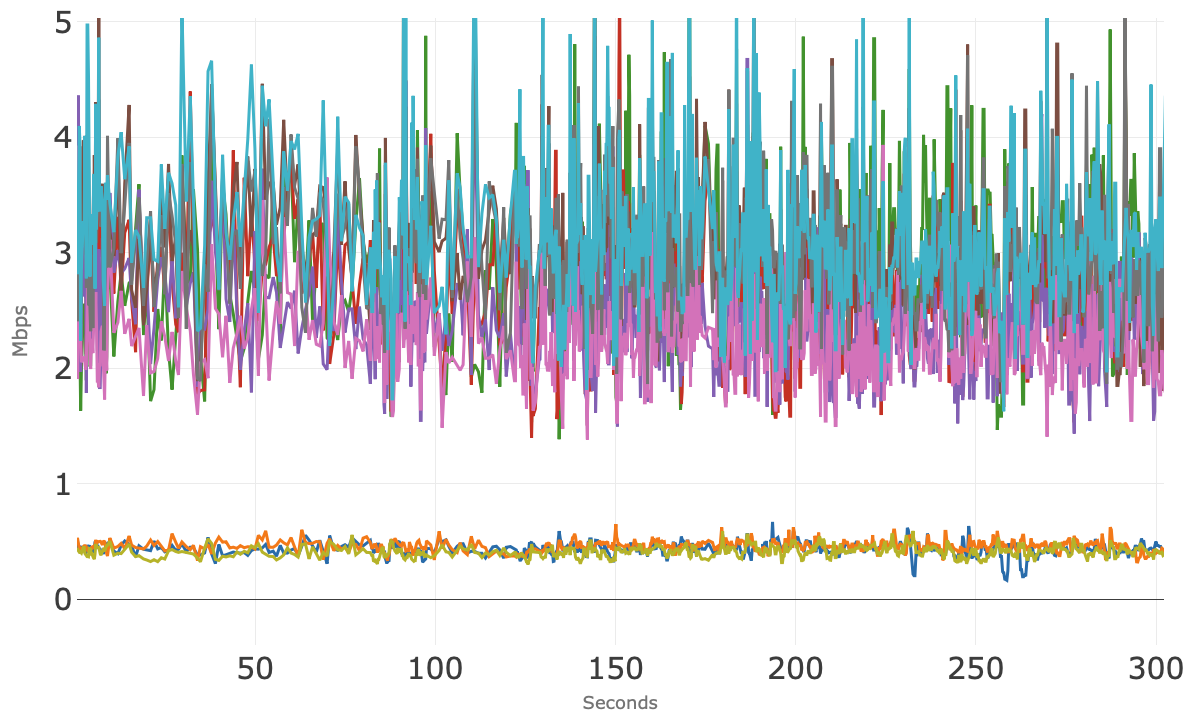
Figure 12 shows the downstream bandwidth usage for the 10 individual conference sessions. These sessions show two groups, with one group using less than 1 Mbps of bandwidth and the second group using consistently between 2 Mbps and 4 Mbps of bandwidth.
Running All Four Conference Applications Simultaneously
In this section, we examine the bandwidth usage of all four conferencing applications running simultaneously. The test consists of three concurrent sessions from two of the applications and two concurrent sessions from the other two applications (once again a total of 10 conference sessions running simultaneously). The goal is to observe how the applications may interact in the scenario where members of the same household are using different conference applications at the same time.
Figure 13 shows access network usage for these 10 concurrent sessions over 300 seconds (5 minutes). The blue line is the total downstream usage, and the orange line is total upstream usage. Note that the total upstream usage once again hovers around 5 Mbps without any visible degradation to the conferencing sessions, and the downstream usage is pretty tight right above 10 Mbps.
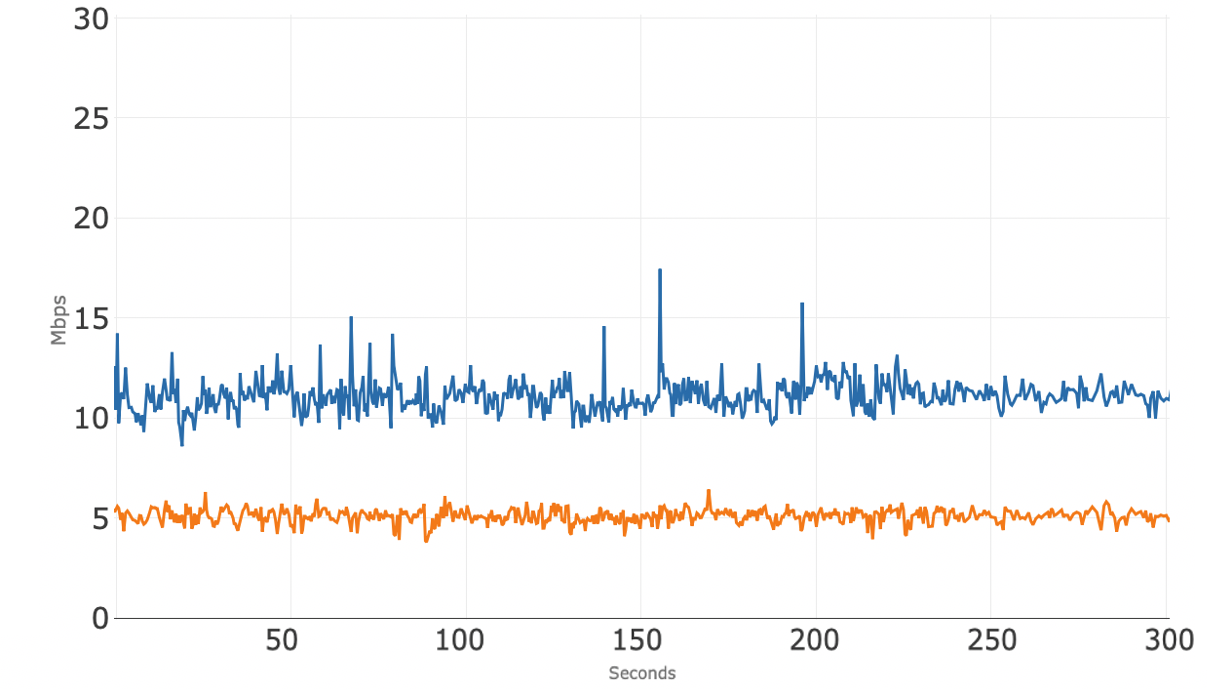
Figure 14 shows the upstream bandwidth usage of the 10 individual conference sessions where several distinct groupings of sessions are visible. There were 4 different apps running concurrently. One session (red) consumes the most upstream bandwidth at averaging around 2 Mbps, whereas the other sessions use less, and some much less.
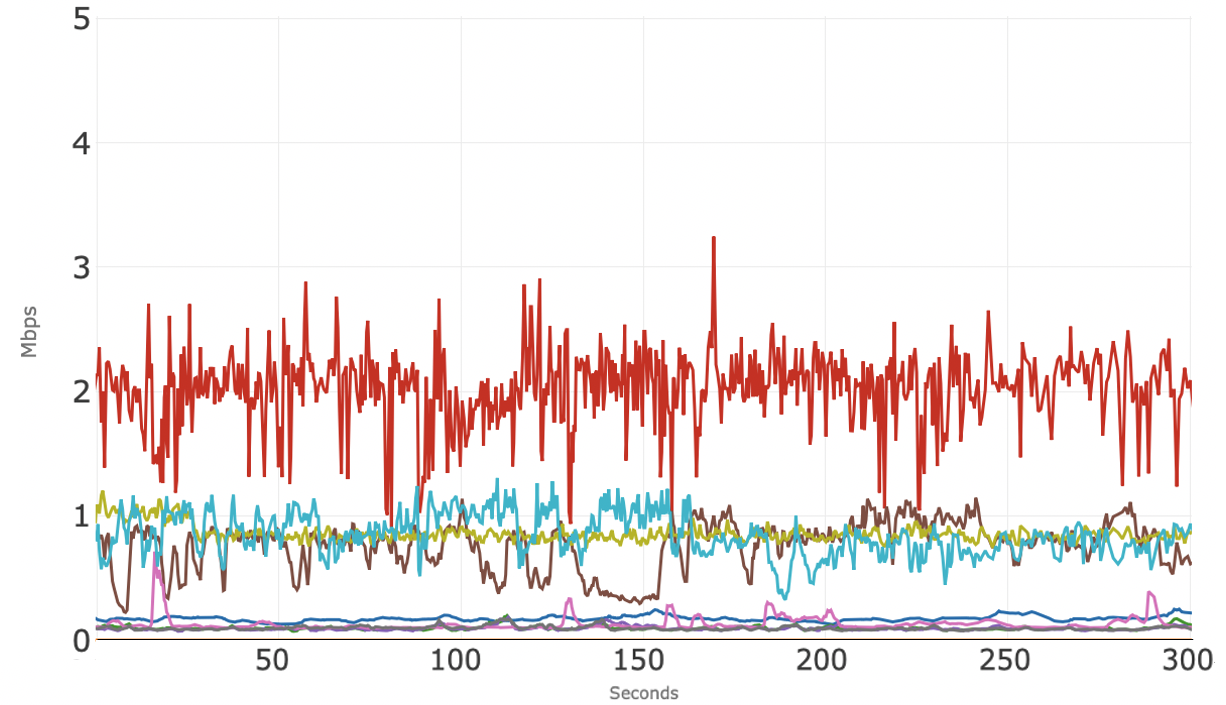
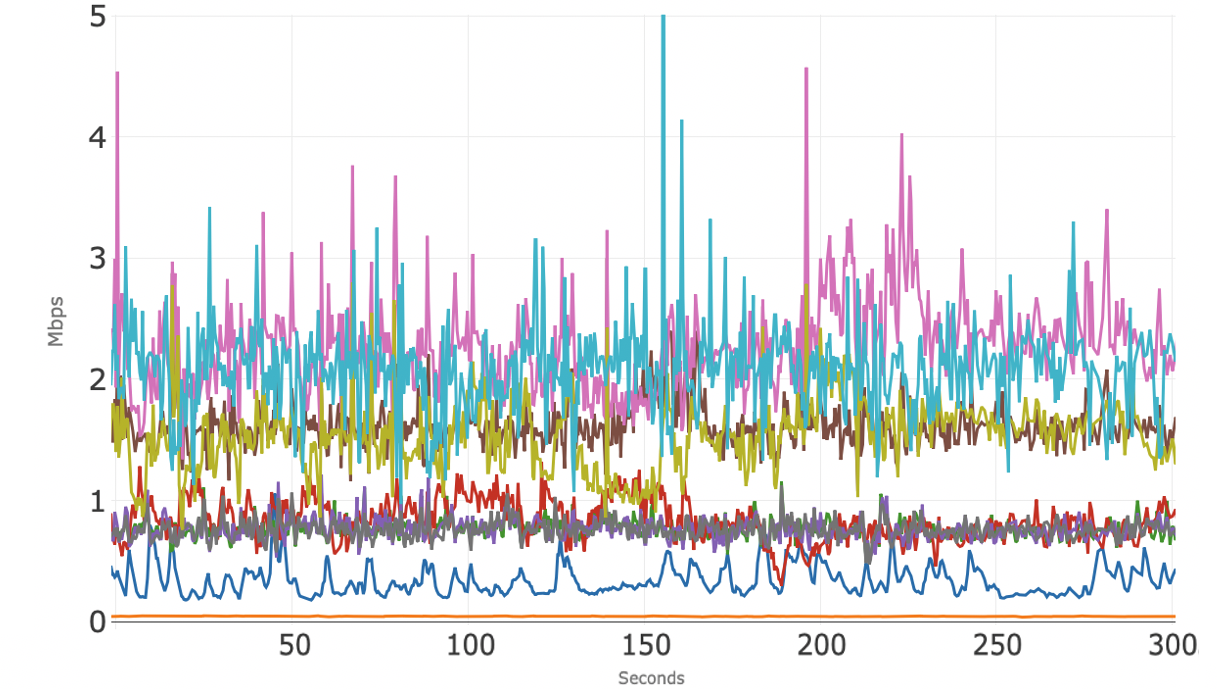
Figure 15 shows the downstream bandwidth usage for the 10 individual conference sessions across the four apps and, again, there are different clusters of sessions. Each of the four apps are following their own algorithms.
In summary, with a 50/5 broadband service, each of the video-conferencing applications supported at least 10 concurrent sessions, both when using a single conferencing application and when using a mix of these four applications. In all cases, the quality of the 10 concurrent sessions was good and consistent throughout. The 5 Mbps of nominal upstream bandwidth was sufficient to support the conferencing sessions without visible degradation, and there was more than sufficient available downstream bandwidth to run other common applications, such as video streaming and web browsing, concurrently with the 10 conferencing sessions.