
Extreme programming (XP) techniques and other advances in software development allow for creation of a code base which is more easily understood and maintained. This often leads to faster enhancements, at a lower cost, and with fewer defects. However, when these practices are not followed, problems within the code base can manifest themselves as technical debt. The following report details the experience of one team in trying to influence toward greater understanding in and investment toward their technical debt problem by making that problem visible. The team hangs large representations of their code base in the walkway by their desks. The charts create conversation in and around the team and eventually shows results.
I. INTRODUCTION
A. The Company
As a general rule it is often said that the larger the company, the more politics you will find. Of course there are exceptions, but its useful to understand that this report takes place in a very large, Fortune 200 financial services company. This particular company had some successful pilots using an Agile approach and was in the midst of a company roll out. Over thirty teams were now writing stories and incrementally delivering software.
B. The Teams
Of the thirty teams moving to an Agile approach three are involved here. For the purposes of this report we will refer to them as the Impossibles, the Cruisers, and the Rolls. These three teams had been formed before the Agile roll out had begun. Thus the teams were originally staffed with people who had little Agile exposure and almost no Agile experience. At the point that this report takes place, the three teams had grown from that point, but not uniformly. The Impossibles benefited from having an embedded coach for six months. This coach paired with developers teaching TDD, continuous integration, and pairing. The coach worked with analysts in getting to smaller stories and becoming more involved in testing. Finally the coach worked with testers to teach development best practices they could use in test automation. The Cruisers and Rolls were not provided similar experiences and were doing their best without it.
C. The Application
These three teams were all working on the same code base at the same time. The code base here will be called the Zip application. Zip was a J2EE web application built around a purchased third party product. The code written for Zip generally centered more on extending the third party product rather than customizing it, but both occurred to some degree.
D. The Debt
As mentioned above, the early days of Zip were in the context of a very traditional plan driven approach. No extreme programming techniques, such as refactoring or TDD, were being employed. It was common for projects to be racing for deadlines. In one instance, after missing an original planned release date, the team was told that meeting the next was a likely condition of continued employment. All of these factors were breeding grounds for problems to emerge within the code. Technical debt is a term that was formed to better relate code issues to those that understand financial debt. The idea is that when a developer cuts a corner (whether they are implicitly asked to do so or not) it is potentially something that the company will pay for down the road. That is because it will generally cost more (sometimes much more) to resolve it later. In addition, should you not resolve the problem, you will be less efficient by working around it or you will find it manifesting as defects. Thus the debt metaphor holds that when you cut corners you incur debt. When you later refactor the code to resolve the situation, you pay down principle. Also, should you work around the problem, you incur interest.
E. The Company
All three teams and the support persons around them had directly or indirectly contributed to the amount of debt in the Zip application. However, the Impossibles learned a lot from their Agile coach. They were now writing unit tests before the code. All code was being written by pairs. Regular refactoring was starting to be recognized as a valid if not responsible activity for the team. Then as we progressively got better at these practices, the Impossibles started to look beyond their own work and at the Zip application as a whole. The Cruiser and Roll teams were at different stages of maturity. Some wrote unit tests after doing development and others none at all. All did their best to write good code, but few had a strong background in Agile techniques on how to get there. Thus, the Impossibles found themselves moving to different areas of Zip and each time running into debt of some kind. It would not be uncommon for this debt to of have been introduced just months before. Also at play were those supporting the three teams. Since Agile was new at the company, the term and concept of technical debt was still foreign to many. The company’s Agile roll out training focused primarily on analysts, testers, and developers; much less so on their managers. Further, the teams were distributed among different organizational boundaries and geographical locations. This meant that a coordinated effort to reduce technical debt felt like it would require something closer to an organizational change management specialist rather than anything the Impossibles could affect on their own. An unlikely barrier to paying down debt came from within the Impossibles. This was from turnover and new developers joining. The new developers came in with the same doubts and perspectives of the world that we had before learning XP techniques. We were slowly converting them, but were looking for tools to help.
II. MAKING IT VISIBLE
A. Financial Counseling
Earlier in this report we covered some of the parallels involved in both financial debt and technical debt. In the case of financial debt, many people seek the help of a financial counselor. Often when these financial counselors start with a new client, one of their early recommendations is for that client to put his/her credit cards aside and move to using cash. This is because the client can physically see their cash being depleted from what they had on hand. In both the case of a credit card and cash, the client is spending the same amount of money. However, it is only when the client can see that money supply being depleted are they able to change their behavior. Another technique used by financial counselors is to help their clients gather facts about their spending and saving history and then to have hard conversations around it. It is through these conversations that the financial counselor helps the individual to better make connections between the trade-offs involved in any action. The Impossibles wanted to bring about change with new members of their team and with members of the other Zip teams. They wanted turn the dial with those around the teams to better understand and be more supportive. Thus it is with these ideas of financial counseling techniques that the Impossibles decided to experiment with a Code Christmas Tree.
B. The Make Up of a Code Christmas Tree
We started with data that was already being captured as part of the open source tool Sonar. We then transformed that XML data, and converted it to a comma separated value (CSV) file. Next we fed that CSV into the open source tool Microsoft Tree Mapper. Finally we took the visual output of Microsoft Tree Mapper and printed four foot tall diagrams of the Zip code base. One example is in figure 1. We went through a number of variations in the first week. We started with a simple code tree that had squares which represented the different classes in the application. Each square was a size in proportion to the lines of code within them. Further each square was colored on a continuum from dark red, to lighter red, to white, to lighter green and finally dark green. The color represented the level of unit test coverage. Dark red, the near universal project management color for trouble, was used for the low areas of coverage. Dark green, the near universal project management color for going well, was used for high areas of coverage. We chose these colors for their emotional response. Even if few could understood the concept of unit test coverage and the lack of it being bad, at least they could take a look at a big chart, see a lot of red toner, and get a feeling that they should ask more questions. From this first chart, soon we created another. The second chart started with the same class boxes sized by lines of code. However, in this instance the coloring we used was based on cyclomatic complexity. Cyclomatic complexity measures the number of linearly independent paths through a program’s source code[1]. We used cyclomatic complexity to help us understand how simple and clear we were keeping our code. Once again we used the red and green to generally indicate possible areas of trouble.
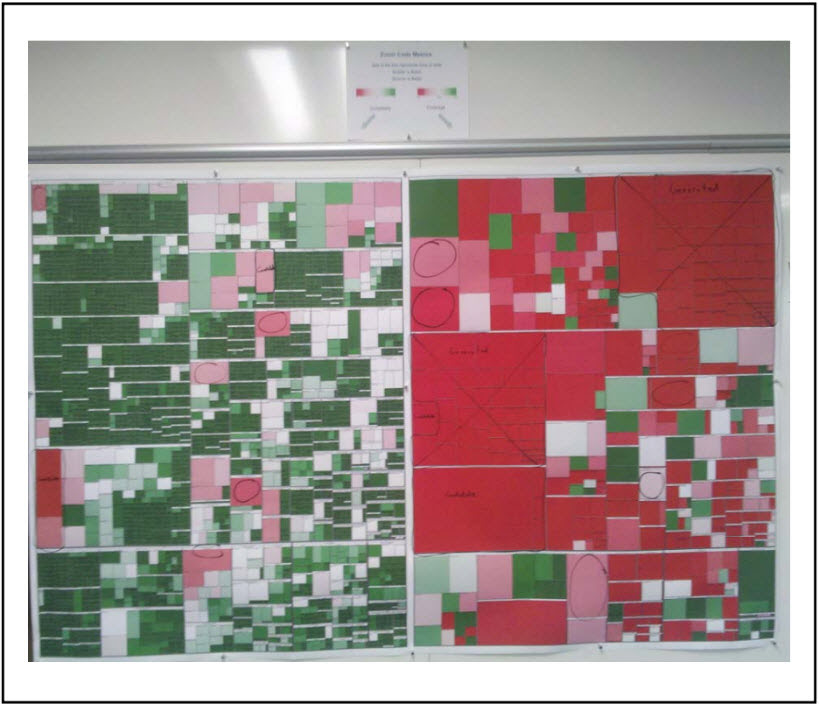 Figure 1. Code Christmas Trees.
Tree on the left is code complexity and tree on the right is code coverage. Note some classes on both charts have hand written circles. Those are ones the team targeted for their next round of clean up.
We hung the charts in the hallway between the Impossible and Cruisers team spaces, so that it was near both of those teams. However, this same hallway was along the route to most meeting rooms on the floor. Thus, even those who were not connected to the Zip application would stop and ask questions. Our experiment with the charts started in December. Thus with their coloring, many people started to call the charts Christmas trees. The name Code Christmas Tree stuck.
C. Team Reaction to the Code Christmas Trees
Other than the large size and posted location of the Code Christmas Trees we did nothing to promote them. However, they started getting more and more attention from people unconnected to Zip. This attention soon caused developers on both teams to want to know more. Developers questions seemed to fall under two main lines of thinking. The first group were those who were enthused XP advocates. They wanted to know how these charts might further their ability to educate others. The second group were those who were concerned that these charts may be used punitively against them. To the group of enthused XP developers we discussed how we might use the charts internally to focus conversations around refactoring or project risk. We started to write on the charts just like we would white boards, furthering our discussions. We identified generated code, realized it was inappropriate for code coverage or cyclomatic complexity measures and removed it from future charts. To the group concerned about punitive uses of the information we looked at sections of the code which had been written by the Impossibles in the past weeks and months. Nearly all of it was shades of green. Our point was that we were already doing good work, and that this was a chance for us to make that good work more visible. The culture on the Impossibles helped to make that explanation enough. The Impossibles had been doing root cause analysis techniques like fish bone diagrams and five whys analysis within a lean systems focus for months. Thus team had history of never stopping with a single individual when searching for the cause of problems. The root cause of red on our Code Christmas Trees, which built up over years by various people in various circumstances, would not and should not rest with any particular person in or around Zip. It was about five days later that we noticed a developer from the Cruisers studying the Code Christmas Tree. When we asked what he thought about it, he asked why a particular method was red. In explaining the tree to him, we learned it was a class he had recently written. Digging a little further we realized that the code was left that way because he felt pressure to achieve a particular iteration commitment. We recognised this as a teachable moment and had an open conversation about how to handle the situation differently in the future. In the following days more conversations happened at the Code Christmas Trees. Many of us felt excited that, in small incremental fashion, we were moving the dial on awareness to technical debt. Perhaps most exciting was that getting there had so far only required making the issue highly visible and being willing to walk up to chat with people when we saw them studying it.
D. External Reaction to the Code Christmas Trees
Earlier we mentioned that both the concept of technical debt and its level of manifestation within the Zip application were not well understood by those surrounding and supporting the three application teams. This lack of understanding contributed toward more difficult conversations with respect to the cost and risk of new enhancements. We were concerned, in particular, about how those leading the three Zip teams might react to the red depicted on the Code Christmas Trees. We imagined a situation where one of those leaders would view the trees to be a negative reflection on them and a political liability. Still we believed that if the situation ever started trending toward a toxic direction, that we could simply take the charts down and call our Code Christmas Tree experiment complete. In our case, the fears proved unfounded. IT leaders unanimously found the charts to be both insightful and useful. In the case of those responsible for application development practices in general, the charts were proposed for expanded pilot within the company. In the case of Zip’s accountable IT Director, he viewed the charts as a tool for him to build further consensus with others. His ability to unilaterally devote project dollars was limited. He took pictures of our charts and shared them with others.
E. Awareness Manifests Into Action
Recently the greater understanding of Zip’s technical debt, combined with other project influences, left the Impossibles with 3 weeks devoted exclusively toward paying down debt. This was a very big win for our efforts. It was evident not just in those around Zip who were pushing for this action, but also with those who traditionally would have opposed it and were now more silent. Still even here we ran into a new challenge. How do we best represent our progress in an iteration demo, when all of our efforts were transparent from the perspective of the user interface? Here we experimented with two approaches. First was to pull up before and after views of the code. Second was to use the Code Christmas Trees themselves. Through some combination of our company culture and Zip’s less technical demo attendees, we did not get far with our approach at sharing views of the code. In fact with some of the questions we were getting, showing the code seemed to create more confusion rather than less. Thus we moved to showing progress through the Code Christmas Trees. In the iteration demo, we were able to share a time series of the Code Christmas Tree section that was targeted. We started with showing them how it initially looked dark red, how we moved it to white, and finally it transitioning to green. While many members of the business team had yet only achieved a surface understanding of technical debt, they understood that we had made progress. They seemed to like seeing this small component of overall project/asset status going from red to green. We were surprised to see the demo end with applause.
III. LEARNING OUTCOMES
We had some key learning outcomes in our experiment with Code Christmas Trees. First was to make the problem visible. The more visible, through size and location, the better. We tried smaller sized Code Christmas Trees and found they got less attention and were less understandable. Next was to use the charts to enable the conversation. We would move conversations about technical debt to the location of the Code Christmas Trees and once there interact with them by pointing and writing. We are still not entirely sure why this was so helpful. However, we think it is similar to the effect we have experienced elsewhere. For instance we have found that communicating fact-to-face is great, but communicating face-to-face with white boards is even better. Finally, we learned to be very aware of our use of color. We are not convinced we would have reached as many, as quickly if not for our use of red and green. Of course, we were aiming to get noticed and we wanted to get a reaction. In other company cultures, with other people, and other organizational maturities; different uses of color may be more effective.
IV. FUTURE CONSIDERATIONS
A. The Dead Guy In The Room
A piece of home ownership advice we once got concerned the story of the dead guy in the room. The story goes that a couple was looking for a new home. Every showing they attended did not have the items they wanted or was outside of their price range. Finally they found a home that had everything … and a dead guy on the floor in the living room. The selling agent explained that a man had in fact died there, but whomever owned the house was free to remove it at any time. So the couple moved forward and purchased the house. They wanted to remove the dead guy but first had to worry about moving out of their former home. Then they wanted to remove the dead guy but first wanted to remodel the kitchen. Soon they had spent so many days walking around the dead guy they started not to care as much. After that they started not to notice at all. Of course, the story of the dead guy in the room is an exaggeration to make a point. You could replace the dead guy with a big carpet stain or a very unfitting paint color. The point is that it is easy to overlook big, visible problems over time when they do not change materially. For instance, while you might be able to notice a big carpet stain less and less over time, it would be much harder to do if the carpet stain progressively grew larger and darker in appearance. With respect to our Code Christmas Trees, and their location in the walkway, we still get reactions from those who are new to them. We also still bring team conversations to the diagrams when we discuss technical debt. However, we are starting to find that interest for those outside the teams has lessened. We fear that since change is rather slow on the trees, that they are starting to take on the properties of the dead guy in the room. We are looking for ways to prevent this from happening. We plan to experiment with a new adaptation of our trees that focus only on trending and as such change much more often. For example a Code Christmas Tree that shows which positive or negative direction each class modified in the last 3 months moved.
B. Expansion Leading to Comparisons
We are currently working with other application teams so that they can experiment with Code Christmas Trees. Much will be learned though their experience. To better enable these teams and others get up to speed faster, we have started a small open source code base which facilitates the transformation of data between Sonar and Microsoft Tree Mapper. Additionally we hope to learn more about what happens when Code Christmas Trees for different applications are shown near each other. Does one application with a lot of red look better when neighboring applications are just as red? Are the Code Christmas Trees less noticed in the hallway when they are a common team artifact? Is there anything that we should do to discourage comparisons between applications?
C. Expansion Encountering Defensive or Punitive
Cultures As we help other teams to implement Code Christmas Trees we expect some will involve people who view the information as a liability rather than as an asset or tool. They will view the red information within the highly visible chart as something that will reflect badly on them personally. We envision persons acting in this manner to potentially attack the existence of the charts, the concept of technical debt, or assigning blame where it is undeserved making the situation worse. Thus for those acting within punitive cultures we suggest you moved forward cautiously, but still move forward. Our team had significant concern about how this information would be used, but are now seeing positive results from taking the risk. You are hanging the charts as part of an experiment within your team. If that experiment is not yielding results in your environment, it might be relatively easy to take the charts down.
D. Class Size, Test Coverage, and Cyclomatic Complexity Are Not The Entire Story
We have found that technical debt most often impacts us when we are called upon to make changes in those debt ridden areas. There are parts of the Zip application which were built years ago and not touched since. It is common for us to find zero unit coverage and high cyclomatic complexity in these areas. Additionally, much of this old code is in parts of the application that have relatively low business impact. In other words, just because this area of the application appears red on both Code Christmas Tree charts, does not necessarily mean that it is our top concern. Thus we are searching for ways to incorporate other considerations for targeting technical debt without sacrificing the visibility we have now. For instance, while we show class size, unit test coverage, and cyclomatic complexity; we have not yet incorporated indicators of where future application activity may occur. Additionally, we have not yet implemented an effective way to demonstrate trending. Thus, as mentioned above with the dead guy in the room, we plan to experiment with Code Christmas Tree charts that show only recent trend information alongside our current versions.
E. Opportunities Over A Single Application Trend Line
Earlier we detailed one of the causes of technical debt within Zip as being a lack of unified training and experience with XP techniques. Up until now, we have not yet been able to make the case for the Cruisers and Rolls to get that type of coaching. All web applications in our company’s Agile roll out are required to track their net unit test coverage percentage trend line. When one small, mature team is the only one developing within an application, this may be enough for governance. However for the Zip application, where there are three teams with varied levels of maturity, the trend line may mask more than it illuminates. For instance, the Zip cumulative trend line has been slowly rising for months. We believe it is not rising faster because the more mature teams are getting very high coverage with their code while the lower maturity teams are getting less or none. The three Zip teams generally work in different corners of the application concurrently. Thus we are interested to see the reaction when we experiment with the trend focused Code Christmas Trees mentioned above. We expect that they will show some clearly red areas and clearly green areas. We hope that, like in our previous experience, just making this information visible will go a far way toward resolving it. However, we have also started having informal conversations with key decision makers and influencers. This to better enable them to have a reaction toward devoting coaching resources rather than any sort of individual blame after the view becomes available.
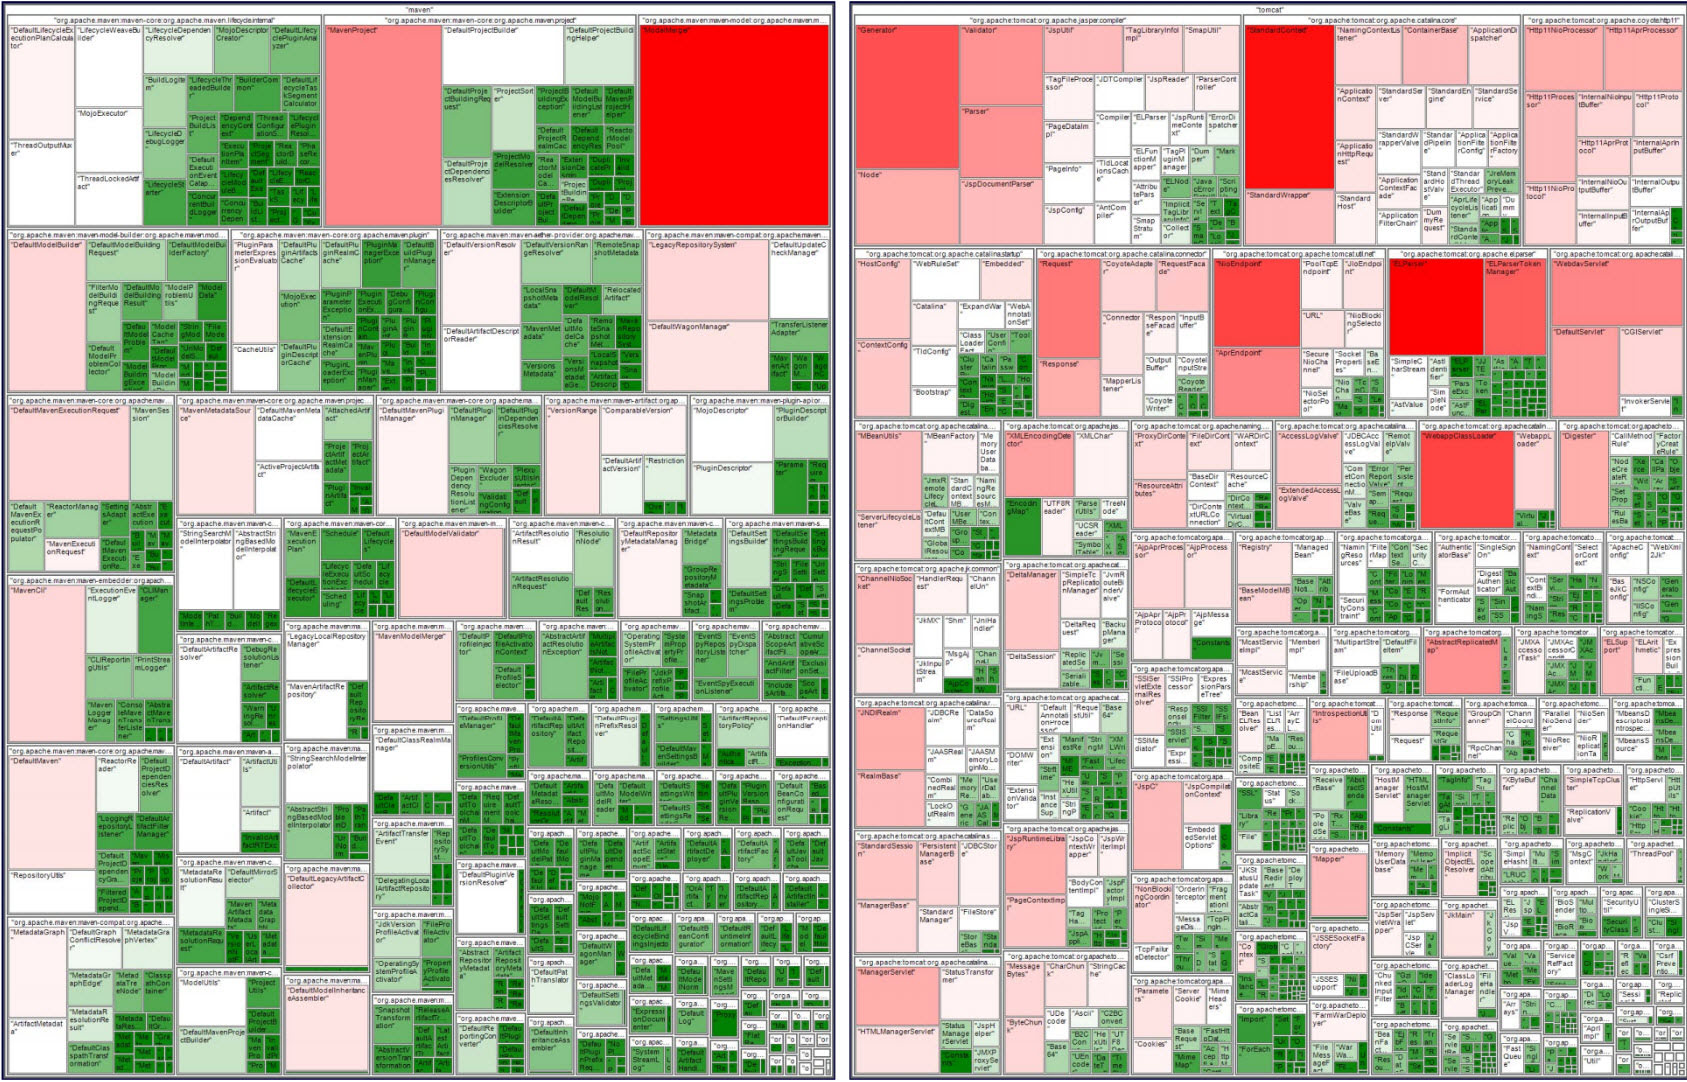 Figure 2. Cyclomatic complexity Code Christmas Trees for open source Maven [2] and Tomcat [3] code bases respectively (March 2011).
ACKNOWLEDGMENT
Thank you to the teams and supporting groups that made this happen. The authors look forward to where you will take this into the future.
REFERENCES
[1] Wikipedia.com, “Cyclomatic Complexity,”
http://en.wikipedia.org/wiki/Cyclomatic_complexity, March 2011 [2] The Apache Software Foundation, Apache Maven Project,
http://maven.apache.org/ [3] The Apache Software Foundation, Apache Tomcat,
http://tomcat.apache.org/