
This article is specifically targeted toward RTE’s, Product Management, and coaches that are currently engaged in establishing a program level workflow (Kanban) that prioritizes the highest valued features as candidates for the Program Increment (PI) Planning event.
The promise of a team of teams achieving a consistent 80% predictability in delivery of PI objectives and tangible business value is one of the most attractive program level metrics for leadership and management. It’s what Agility can provide that traditional project delivery cannot.
It is common and consistent with my experience that PI Planning is often seeded with features that are new (or minimally exposed) to the teams that will be delivering them. The emphasis is on “emerging design” because the PI Planning event is a forum where emergent design is launched by teams collaborating face-to-face, then continues throughout the execution of the PI. If that is the case, AND if at the end of the PI the teams are missing their PI objectives by a significant factor, AND/OR the IP sprint is used as a buffer for continuation of work – there may be a fundamental imbalance between intentional and emergent design for which a resolution could provide improve PI completion predictability.
Within the standard SAFe recommended approach, the popular camp of thought is:
For those teams that do not meet their PI objectives, simply commit to fewer features during PI Planning, thereby widening the buffer for unplanned work. For example, if a team only met half of their commitments, the team should consider reducing their feature commitments during PI planning by about one half. As simple as it sounds, reducing planned throughput by 50% can be a difficult sell to the business, even though the team’s metrics support that and doing so is counter-intuitive to the spirit of the PI Planning event.
Missing the PI objective delivery goal is likely addressed as part of the Inspect & Adapt workshop. If missing PI Objectives continues to persist from PI to PI, the Road Map will also reflect the continued delay of value to the customer, and the promise of predictable delivery will fail to materialize. This is a legitimate leadership concern.
However, there is an alternative approach that aligns with intentional/emerging design within the SAFe framework. First, let’s baseline the issue.
I would like to share a simple metric that has proven valuable when working with ARTs. That being Unplanned Work. Since it’s impossible to know everything at the beginning of PI Planning, coaches recommend only filling the team’s capacity to 80% to allow for the expansion of emerging design. It could be argued that the team is planning for the additional work that will be added.
Two Characteristics of Unplanned Work
- Work that bypasses the Product Manager or Product Owner and goes directly to the team – a debilitating anti-pattern for team velocity. Unforeseen production support, maintenance issues and verbal requests outside the boundaries of the team usually fall into this category. Placeholder stories that are in the backlog and are not sized, may also qualify. This is sometimes called “phantom” or “invisible” work.
- Feature discovery: When additional work is identified and accepted as necessary to deliver the feature as the design emerges during the iteration. Can also be called “feature scope creep”, “feature bloat”, etc.
When Unplanned Work is realized, the implications can be cross-cutting, potentially impacting multiple teams and ultimately resulting in delayed delivery of features and PI objectives.
Before we resolve unplanned work as a probable root cause of delay, we need to measure and validate. For work that sneaks in under the radar and isn’t visible in the backlog, there is a more direct resolution by adhering to the principles of Scrum, albeit it may require coaching at the management level if they are contributing to the anti-pattern. Unplanned work resulting from feature discovery is more complex and is the focus of this article.
Consider this scenario:
During PI Planning, the teams plan their iteration load to 80% capacity as recommended. During PI execution, when they start to work on stories within a feature, additional stories get added as new discovery evolves. This is expected. Here are some typical reasons. (I’d invite to hear others you have experienced.)
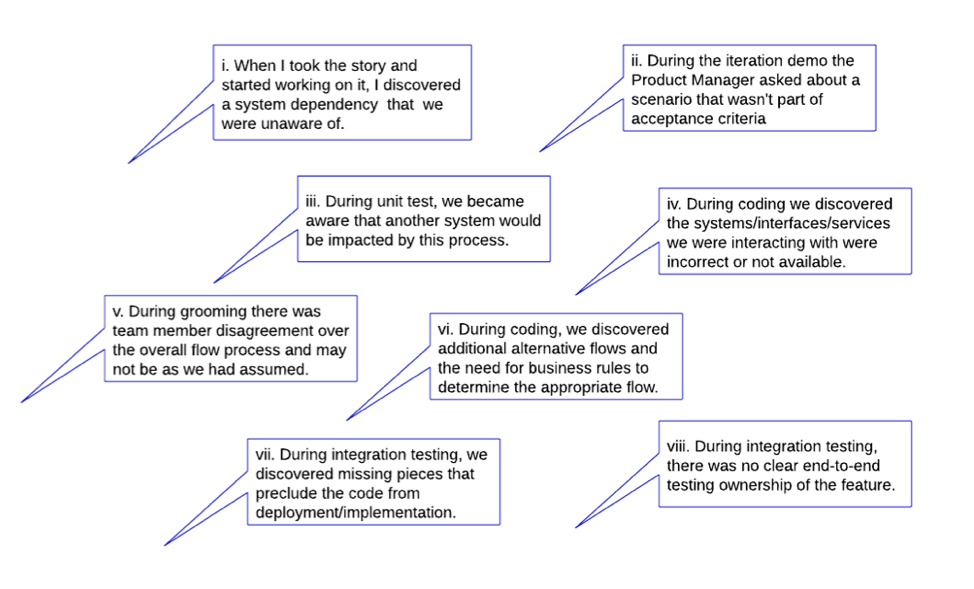
Reasons for unplanned work
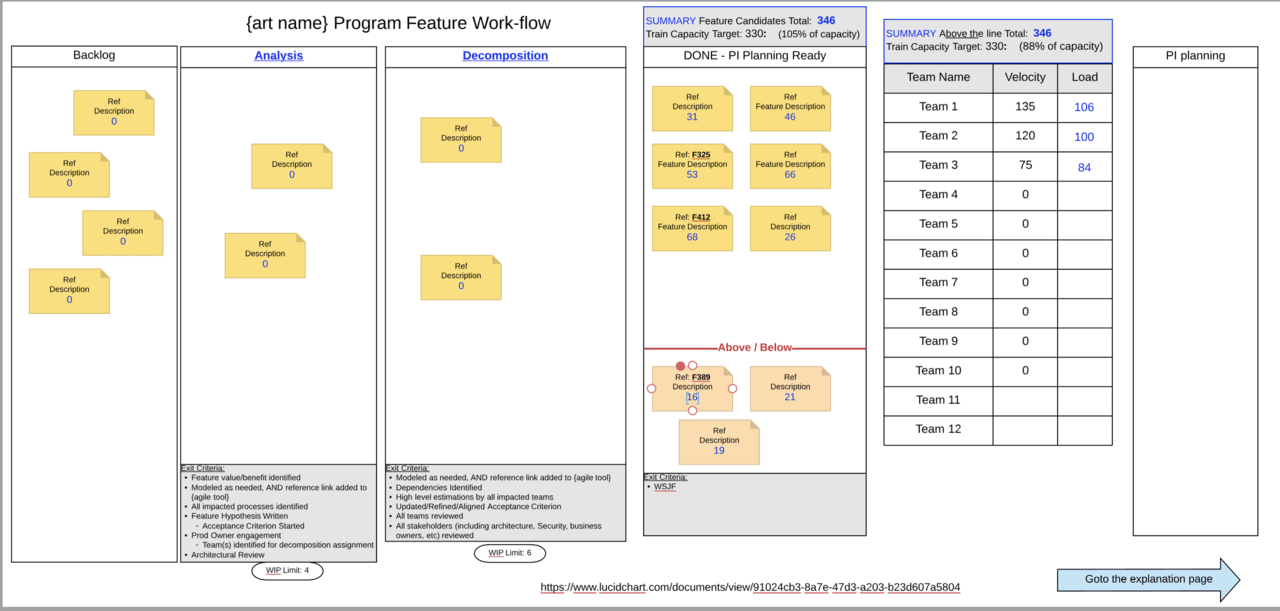
In order to measure unplanned work, it is imperative that ALL team level work is reflected in their backlog, aligned with the delivery of a feature, and is appropriately sized. I will use the Program Board BVIR (Big Visual Information Radiator) as the visibility object to understand the correlation and possible causation of delay during PI execution.
To exemplify I’ll use an interactive online version of a Program Board (created in LucidChart) that has data manipulation capabilities. It’s likely that the something similar can be achieved within your existing tools or a physical board.
window or use this link.
In the above/interactive Program Board, you’ll notice that the Capacity and Load for each team has been baselined from the PI Planning event and appear to the left of the team’s name.
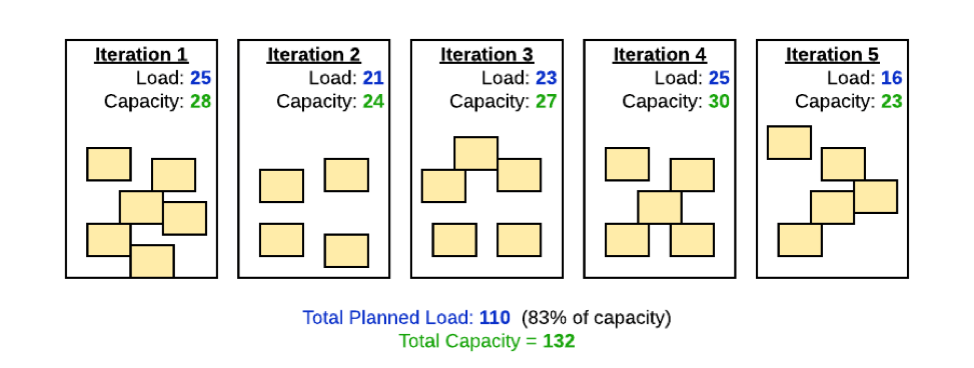
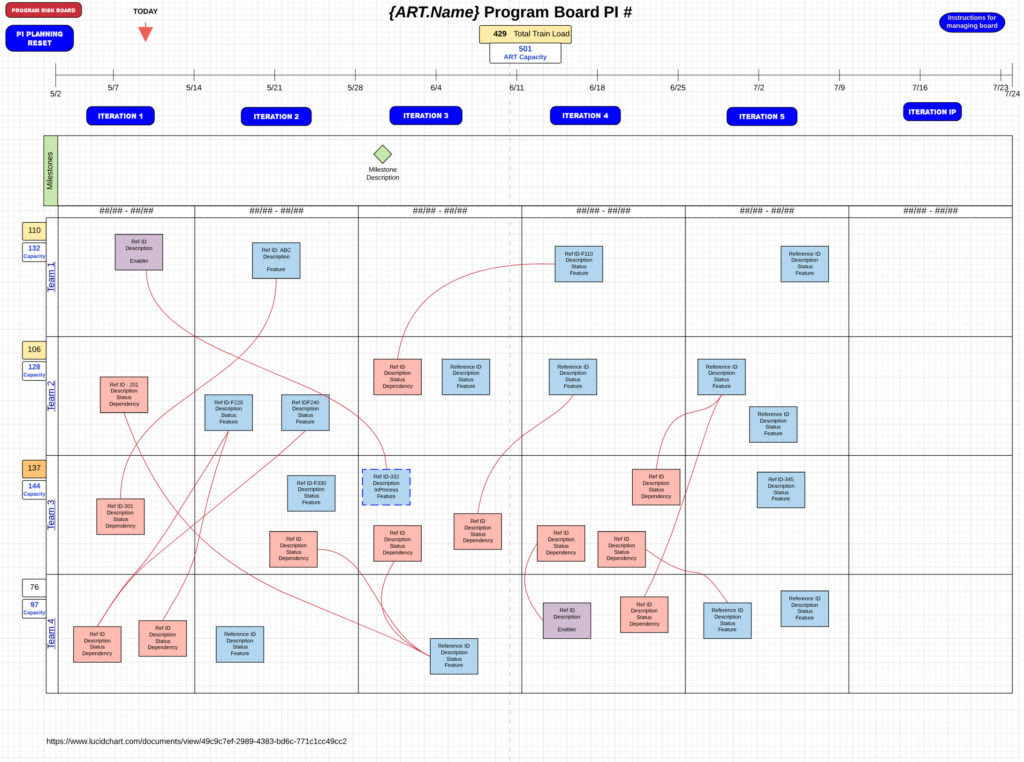
Team-1 has a Capacity of 132 points and has committed 110 Load points for the PI. The Load is 83% of Capacity, and the box is color coded amber. These numbers have been aggregated for each of the teams and summarized at the top. The Agile Release Train has a collective capacity of 501 points and the aggregate team load is 429 point; 85% of capacity.
The board reflects how all teams plan to manage dependencies and deliver features and enablers within iterations throughout the Program Increment. The Load objects are color coded to indicate load/capacity ratio greater than or equal to 80% (amber), 90% (orange), and 100% (red).
Now, <click> on the “Iteration 1” button. Each iteration button displays what has transpired during that iteration and aggregates changes in the team’s Load for an overall train view. You can <click> the “PI Planning Reset” button to return to the initial state.
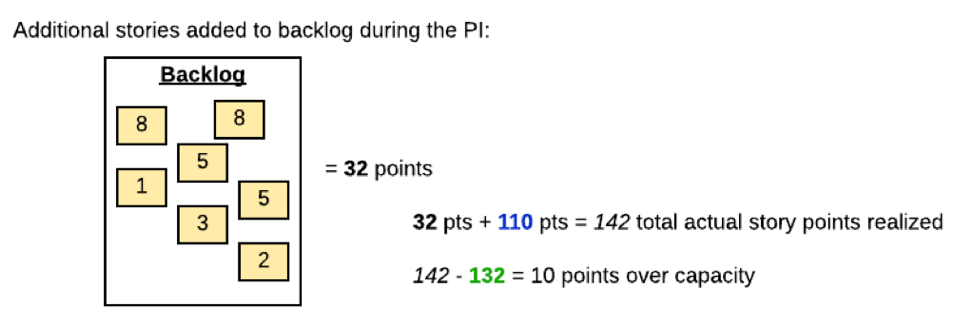
Note that the actual Load metric changes because it includes all new stories added to the baseline backlog.
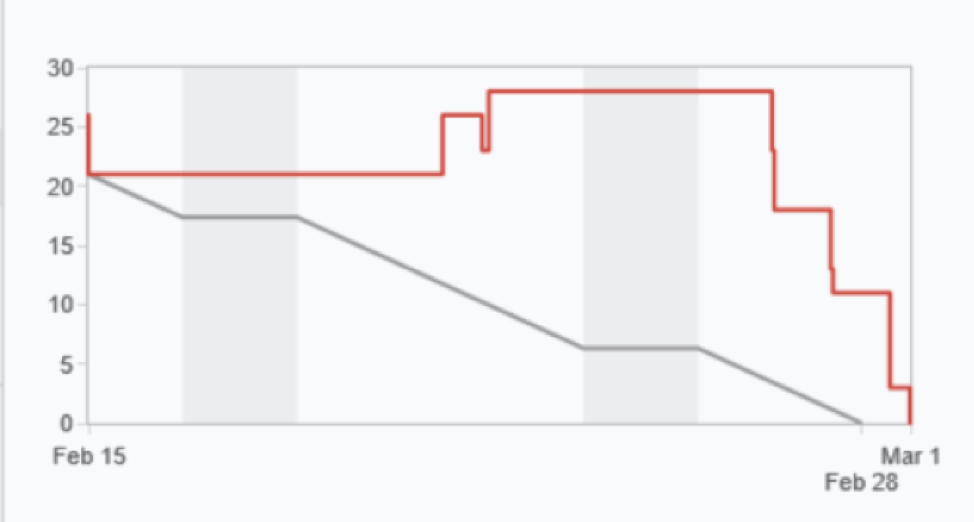
This can be confirmed with the team’s burndown charts that have increasing or flattened graph lines.
There are brief explanation notes for each Iteration.
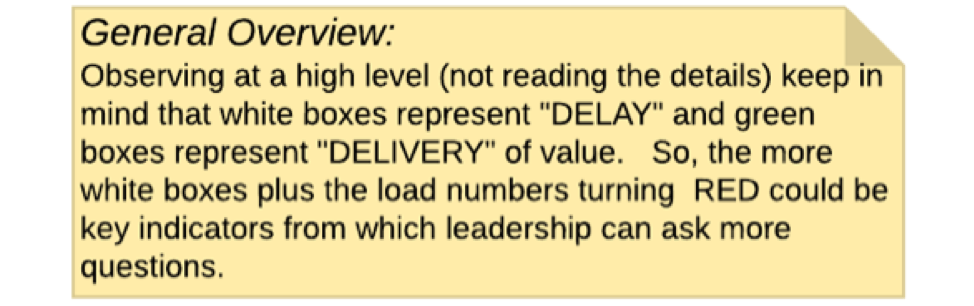
As you click on each Iteration button, note that there are some objects on the Program Board that do not get completed and are moved to a future iteration for completion. This is fairly common,due to the nature of emerging design, or some stories may be missing a singular task for completion and have minimal impact to the subsequent iteration capacity.
These issues are typically discussed during the Scrum of Scrums or Art Sync ceremonies provided any new stories are visible. Encountering the above Reasons for unplanned work could be the source of these new stories.
The teams may add additional stories to the feature that were not considered in the capacity/load allocation during PI Planning. The Product Owner is likely more aware of this condition as they are the owners of the team’s backlog content.
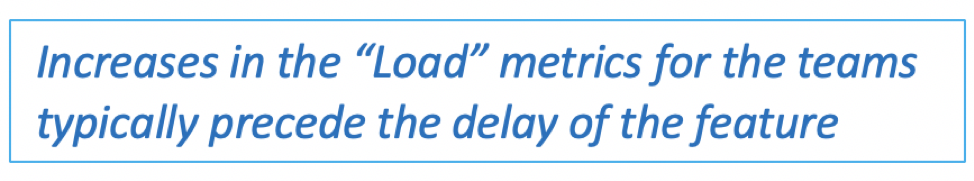
As you continue to <click> the remaining iteration buttons you will also notice increases in the Load metrics for the teams precede the delay (i.e. movement to subsequent sprints) of the program board objects. This should come as no surprise since adding work directly translates into increased WIP, lowering the flow efficiency and increasing the queue wait-times for the remaining feature work. All clearly proven in Don Reinertsen’s Principles of Product Flow, and adopted in the SAFe Principles.
You’ll notice that at Iteration-5, several of the features are pushed for completion to the next PI. It is likely that all the unfinished features/enablers were partially or mostly completed. We would want to validate if the additional work realized early in the PI contributed to the delayed the start on features in later iterations, and the teams just ran out of time to complete.
Regardless of the cause, since there isn’t a 1:1 association between Features and PI Objectives, the PI Demo and Retrospective should summarize the realized benefit based on what is delivered and what can be released and monetized and exclude those that are partially completed. That is, if a team’s PI Objective is based on the delivery of more than one feature and if any of those features are not delivered, is there any partial value to be realized? Understanding the Feature–to–PI Objective–to–Roadmap association is critical to manage the continuous delivery pipeline revolving around the Features. This visibility would allow leadership to quickly course correct if a critical feature to an objective has been blocked with resolution out of the time boundary of the PI. Without that guidance, program backlog prioritization doesn’t reflect the economic vantage point to make the commitment to the Roadmap. Leadership will always ask, “What value am I getting for the cost of the value stream (or ART).” The best answer is “Delivering what they identified on the Roadmap.”
End-of-iteration data that is simple and reliable is the best management tool we can give leadership. In order to provide meaningful data in the context of a Program Board, that data should have a correlation with the objects on the Program Board. The program board would need to reflect iteration progress and not just the initial PI Planning associations between the teams and their feature/enabler/dependency objects. The benefit should help focus on what to consider when working with ARTs that are struggling and/or stalled at less than 80% predictability.
To be continued…
- Information regarding the LucidChart Program Board template can be found here.
- Deb Korbe also contributed to this post.