Diagnosing and troubleshooting CPU problems in production in cloud environments can be tricky. Your application might have millions of lines of code, so identifying the exact line of code that is causing the CPU to spike might be the equivalent of finding a needle in a haystack. This article shows how to find that needle (i.e. CPU spiking line of code) in a matter of seconds/minutes.
To help readers better understand this troubleshooting technique, we built a sample application and deployed it to an AWS EC2 instance. This application when launched caused CPU consumption to spike up to 199.1 percent. Here are the steps we followed to troubleshoot this problem:
- Identify threads that consume CPU.
- Capture thread dumps.
- Identify the lines of code causing the CPU to spike.
Identify Threads Causing CPU Spikes
In the EC2 instance, multiple processes could be running. The first step is to identify which process is causing the CPU to spike up, and the best way to do that is to use the ‘TOP’ command present in *nix flavor of operating systems.
Issue command ‘top’ from the console
<<start:code>>


$ top
<<end:code>>
This command will display all the processes that are running in the EC2 instance, with high CPU consuming processes displayed at the top. When we issued the command in the EC2 instance, we saw the below output:

From the output you see process #31294 is consuming 199.1 percent of CPU, which is high consumption.
Now that we know which process in the EC2 instance is causing the CPU to spike, the next step is to identify the threads within the process that are causing the spike.
Issue command ‘top -H -p {pid}’ from the console. Example:
<<start:code>>
$ top -H -p 31294
<<end:code>>
This command will display all the threads are causing the CPU to spike in the 31294 process. When we issued this command in the EC2 instance, we received the below output:
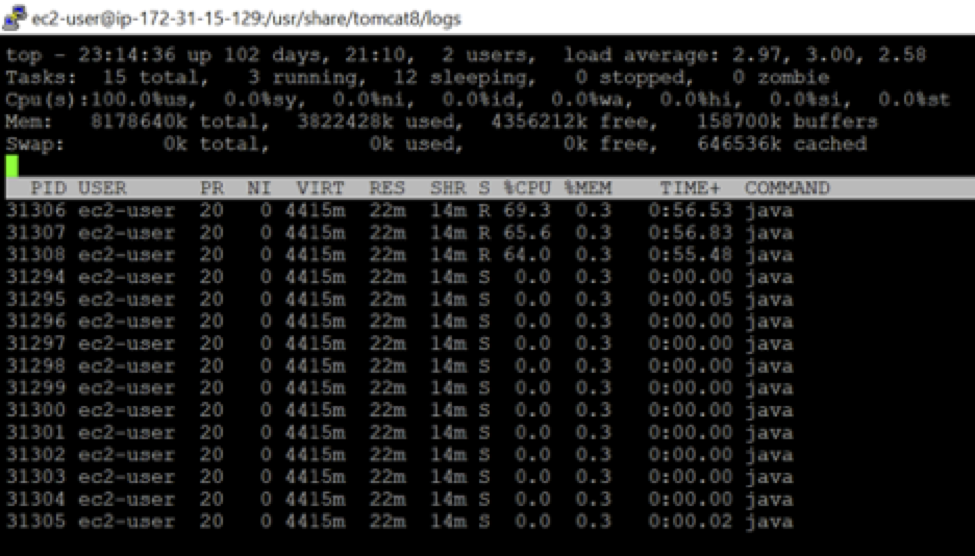
From the output you see:
- Thread Id 31306 consuming 69.3 percent of CPU.
- Thread Id 31307 consuming 65.6 percent of CPU.
- Thread Id 31308 consuming 64.0 percent of CPU.
- The remaining threads consume negligible amounts of CPU.
Now that we have identified the threads that are causing CPU to spike, the next step is to capture thread dumps so we can identify the lines of code that are causing the CPU spikes.
Capture Thread Dumps
A thread dump is a snapshot of all threads that are present in the application. Thread state, stacktrace (i.e. code path that thread is executing) and thread ID-related information of each thread in the application is reported in the thread dump.
There are eight different options to capture thread dumps. You can choose the option that is convenient to you. One of the simplest options to take thread dump is to use tool ‘jstack’ which is packaged in JDK. This tool can be found in $JAVA_HOME/bin folder. Below is the command to capture thread dump:
<<start:code>>
jstack -l {pid} > {file-path}
<<end:code>>
where pid: is the process Id of the application, whose thread dump should be captured and file-path: is the file path where thread dump will be written to.
Example:
<<start:code>>
jstack -l 31294 > /opt/tmp/threadDump.txt
<<end:code>>
In this example, the thread dump of the process would be generated in /opt/tmp/threadDump.txt file.
Identify Lines of Code Causing CPU Spikes
The next step is to analyze the thread dump to identify the lines of code that are causing the CPU to spike. We analyzed our thread dumps through fastThread, a free online thread dump analysis tool.
Once we uploaded the captured thread dump, the tool generated this report with multiple sections. On the right top corner of the report is a search box, where we entered the IDs of the threads consuming high CPU—basically, the thread IDs that we identified in step No. 1: 31306, 31307 and 31308.
fastThread displayed the threads’ stack trace, as shown below.

You can notice all the three threads to be in RUNNABLE state and executing this line of code:
<<start:code>>
com.buggyapp.cpuspike.Object1.execute(Object1.java:13)
<<start:code>>
Apparently following is the application source code:
<<start:code>>
1: package com.buggyapp.cpuspike;
2:
3: /**
4: *
5: * @author Test User
6: */
7: public class Object1 {
8:
9: public static void execute() {
10:
11: while (true) {
12:
13: doSomething();
14: }
15: }
16:
17: public static void doSomething() {
18:
19: }
20: }
<<end:code>>
You can see line No. 13 in object1.java to be ‘doSomething();’. You can see that ‘doSomething()’ method is doing nothing, but it is invoked an infinite number of times because it doesn’t terminate but loops due to line No. 11. If a thread starts to loop an infinite number of times, the CPU will start to spike. That is what exactly happening in this sample program. If the non-terminating loop in line No. 11 is fixed, the CPU spike problem will go away.
Conclusion
To summarize, first we need to use ‘TOP’ tool to identify the thread IDs that are causing the CPU spike, then we need to capture the thread dumps. The final step is to analyze thread dumps to identify exact lines of code that are causing CPU to spike up.
Enjoy troubleshooting and happy hacking!