Network monitoring is critical to ensure stable, performant IT network operation. Typically, network administrators use network management tools that monitor the activity and performance of network devices and network traffic. These network management tools use Simple Network Management Protocol (SNMP) along with remote network monitoring (RMON – an extension of SNMP) probes to collect and manage network data. Network engineers and admins use these tools to optimize network performance.
What is RMON?
Remote network monitoring (RMON) is the process of monitoring network traffic on a remote Ethernet segment to detect network issues such as dropped packets, network collisions and traffic congestion. One of the most successful network management protocols, RMON was originally developed by the Internet Engineering Task Force (IETF), an open organization made up of network designers, operators, vendors and researchers, that develops and promotes voluntary Internet standards.
Developed specifically to help network administrators remotely monitor and analyze data that is collected from local area networks, RMON allows for the collection of network data from LANs without having to reach the site and set up equipment.
With RMON, you can set performance thresholds and generate alerts when the threshold is breached, allowing for proactive network management.
How Does RMON Work?
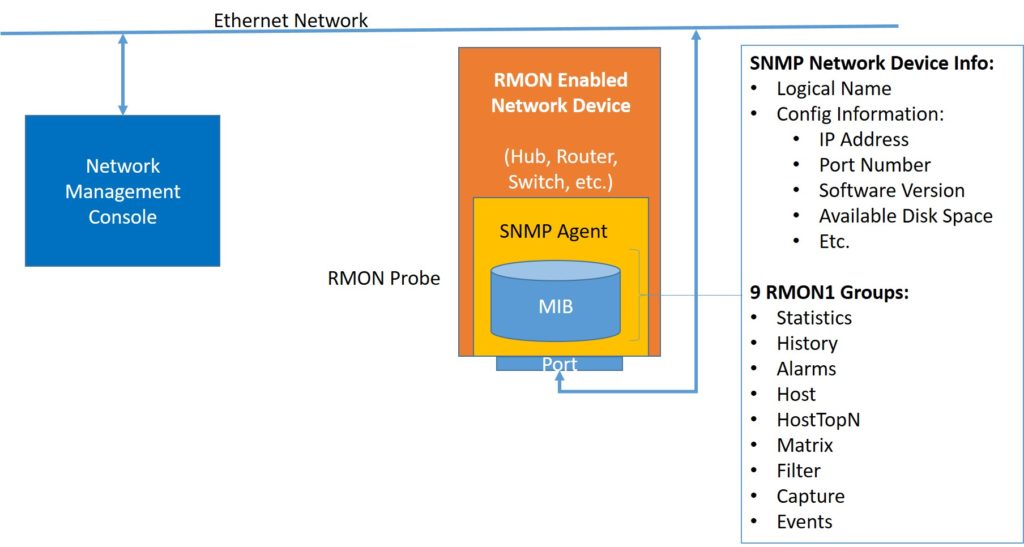
RMON probes or RMON agents are hardware/software components or software embedded into a network device, such as a router or a switch. Typically, the RMON probe is put on just one device or interface on a TCP/IP subnet. The probe software usually runs on the port of the network device to capture information and statistics on network protocols and traffic activity. It can relay this information back to a remote network monitoring console for analysis and reporting.
With an RMON console, network admins can monitor networks, save logs, capture historic performance and get notified in case of an issue – all without interfering with normal operations.
What Is the Difference Between RMON and SNMP?
Simple Network Management Protocol (SNMP) is an application-layer protocol for monitoring and managing network devices on a local area network (LAN) or wide area network (WAN) and is sometimes even used to configure remote devices. SNMP agents are typically included with all network devices to allow communication with the network management system.
As noted earlier, RMON is an extension of SNMP and provides nine groups of monitoring elements to allow the capturing of detailed network information. This data pertains to the physical layer (Layer 1) and the data-link layer (Layer 2) of the OSI model. As RMON agents monitor data over LAN networks, the accumulated information is retrieved by the RMON console using SNMP commands.
SNMP was originally developed as a mechanism for managing Transmission Control Protocol/Internet Protocol (TCP/IP), and Ethernet gateway, an extension of SNMP, was created to allow monitoring of remote networks.
An SNMP device, such as a hub or router, usually needs additional software installed on it to provide RMON functionality and turn it into a probe.
RMON1 and RMON2
There are two remote network monitoring specifications – RMON1 and RMON 2. RMON 2 is an extension of RMON1. It adds nine more groups of data that pertain to the network layer (Layer 3) and application layer (Layer 7) of the OSI model.
RMON1 Management Information Base (MIB) – a hierarchical database that defines the information that an RMON console can request from an agent using SNMP, and provides traffic statistics at the Media Access Control (MAC) and physical layers, such as:
- Statistics – Information such as packets dropped, packets sent, bytes sent (octets), broadcast packets, and multicast packets
- History – Historical data of already selected statistics
- Alarm – Alarms set through SNMP traps are sent when statistics for an event exceed the defined thresholds
- Hosts – LAN statistics for each host (e.g., bytes sent/received)
- Hosts top N – Record of N most active connections in a specific time frame
- Matrix – Traffic matrix for data sent/received between two systems
- Filter – Bit-filter type (mask or not mask), filter expression (bit level), conditional expression (and, or, not) to other filters
- Packet Capture – Includes information, such as size of buffer for captured packets, full status (alarm), and number of captured packets
- Events – Information about event type, description, last time event sent
- Token Ring – Additional statistics for Token Ring networks
RMON2 MIB provides insights into RMON1 traffic statistics by specifying the protocol and applications that compose that traffic. This knowledge is critical to maintaining and troubleshooting today’s client/server environments. The information provided by RMON2 MIB is as follows:
- Protocol Directory – Lists the inventory of protocols that the probe can monitor
- Protocol Distribution – Maps the data collected by a probe to the correct protocol name that can then be displayed to the network admin
- Network Layer Host – Counts the amount of traffic sent from and to each discovered network address
- Network Layer Matrix – Counts the amount of traffic sent between each pair of discovered network addresses
- Application Layer Host – Counts the amount of traffic, per protocol, sent from and to each discovered network address
- Application Layer Matrix – Counts the amount of traffic, per protocol, sent between each pair of discovered network addresses
- User History – Combines mechanisms from the Alarms and History groups to provide history collection based on user-defined criteria
- Probe Configuration – Controls the configuration of RMON features
- RMON Conformance – Describes conformance requirements
RMON2 agents can also monitor the traffic coming to the LAN via routers and not just at the LAN to which it is attached.
RMON2 is not an upgraded version of RMON1 and cannot be considered as a replacement. For complete remote network monitoring, both RMON1 and RMON2 capabilities are required.
Remote Network Management With Kaseya VSA
Kaseya VSA’s network visualization capabilities allow IT teams to remotely identify potential problem sources on the network so they can resolve them more quickly. With VSA, you can automatically discover all endpoints on the network, including Windows, Mac and Linux devices, as well as routers, switches and firewalls. IT techs can move easily from viewing the endpoint on the network topology map to remotely accessing the device to troubleshoot an issue.
Learn more about network visualization and network topology maps here.