February 5, 2019 | Cloud Native, DevOps, Kubernetes, Microservices, Open Source
While Prometheus has fast become the standard for monitoring in the cloud, making Prometheus highly available can be tricky. This blog post will walk you through how to do this using the open source tool Thanos.

An important part of ensuring a system is continuing to run properly is around gathering relevant metrics about the system so that they can either have alerts triggered on them, or graphed to aid diagnosing problems. Specifically within the cloud native space, Prometheus has become the standard open-source solution for applications, especially since the project joined the CNCF.
An open-source monitoring and alerting system, Prometheus is designed to discover & pull metrics from various endpoints and then allow for the querying of these metrics. The metrics are stored in blocks encompassing a configured period of time (by default 2 hours).
To run any service in a cloud environment, including Prometheus, the service needs to be designed to be highly available (HA) so that it can survive the temporary loss of part of the infrastructure, while still continuing to provide the service. This blog post will be exploring just that, with a specific focus on how the inclusion of Thanos helps contribute to making this even more scalable and reliable.
In additional to basic HA requirements, retention of data for analysis and troubleshooting purposes is another key consideration. Note that by design, Prometheus will only keep the metrics for a certain time before they are deleted – it will not retain historical data indefinitely.
The Prometheus website provides some basic details and instruction on how do HA. For most people already operating in the Kubernetes world, the typical way of getting Prometheus to be HA is simply to use Kubernetes itself – i.e to have multiple instances of Prometheus and to deploy it into Kubernetes, so that Kubernetes can manage the temporary loss of infrastructure.
This approach however still leaves some problems unsolved namely:
The third problem can be solved using autoscaling type functionality. For example in AWS with autoscaling groups, the configuration for Prometheus could live in either the user data attached to the autoscaling group, or an S3 bucket, but this still leaves the other problems.
As a way to address many of the problems highlighted above, Improbable open sourced and released a solution called Thanos. Thanos involves (seamlessly) adding a set of components to your existing Prometheus deployments which essentially establishes an unified monitoring system across all your clusters, and additionally provides unbounded historical data storage.
Specifically Thanos allows for the blocks Prometheus stores to be uploaded to long term storage, such as AWS S3, and also for these blocks to be queried. Thanos has the advantage that it exposes a Prometheus-compatible API, so can be directly used by other tools such as Grafana. Thanos is able to query the blocks from multiple Prometheus setups and de-duplicate them into a single response stream.
In order to provide more concrete insight, this blog will describe how to accomplish this within AWS, however the general approach applies to other cloud providers as well. For this setup, we run Prometheus and Thanos on native cloud computing resources.
To run Prometheus HA alongside Thanos requires a number of different autoscaling groups, and some load balancers:
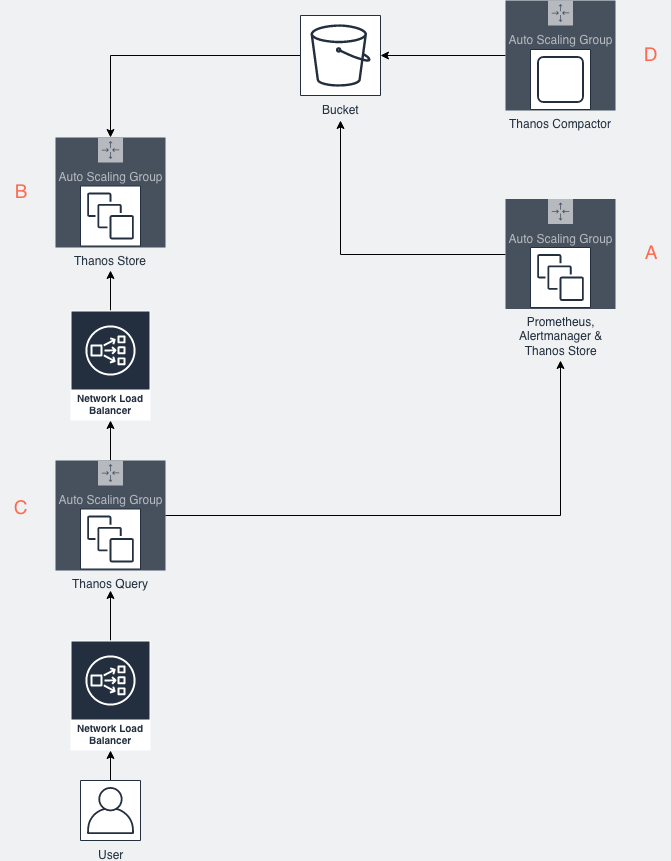
There is a one autoscaling group, labelled as A in the diagram above, which is primarily responsible for running a number of functions:
This is the primary purpose of this whole service – scraping metrics for targets.
One thing to note, in order for the Thanos Query component (labelled C on diagram) to be able to de-duplicate the blocks from different Prometheus instances, you will need to ensure that one of the external_labels differs between each Prometheus server.
Alertmanager is already part of the Prometheus ecosystem, and is responsible for triggering alerts based on configured rules. You must ensure that all instances of the alertmanager are able to discover each other when multiple instances of Alertmanager are running. You need to ensure that they are all able to discover and talk to each other – this is to ensure that alerts can be deduplicated and sent only once. As alertmanager will be running outside of Kubernetes pods, you will need to start alertmanager with the cluster.peer flag set to any other alertmanager instance in the cluster.
The Thanos sidecar component is responsible for both uploading completed blocks, and accompanying metadata such as timespan, to S3 which is a key part of how it addresses the historical data retention issue. It also exposing uncompleted blocks via Thanos StoreAPI so that the Thanos Query component can access them providing a unified consistent view of all data.
The Thanos Store should be run in an autoscaling group and is responsible for downloading metadata about the blocks and then exposing a Thanos StoreAPI endpoint so that the Thanos Query component can query historical data. The Thanos Store autoscaling group is labelled as B in the diagram.
The Thanos Query component, labelled as C in the diagram above, exposes a Prometheus-compatible API and uses all of the Thanos StoreAPI endpoints, exposed via sidecars, to fulfil the request.
All sidecars must be accessed without using a load balancer, to avoid potential problems where a new Prometheus instance hasn’t been able to scrape all of the targets yet. The stores however must be accessed through a load balancer, as Thanos has no concept of load balancing and so will wait for all of them to respond before responding to the users query. This is accomplished through writing a script that will query the EC2 API to output a YAML or JSON file and then feeding that file into the Thanos Query store.sd-files flag.
The Thanos Query component should have the query.replica-label flag set to the name of the external_label that differs between different Prometheus.
The Thanos Compactor reduces the resolution of historical data to improve historical querying. Note that only one compactor instance should ever be running at a given point in time. So whilst it may run in autoscaling group, it will only be for restart reasons and should be set to 1.
We have seen how through careful design, it is possible to have a highly available Prometheus cluster which runs outside of Kubernetes, and is also able to access historical data.
By using Thanos alongside Prometheus, we’re able to make use of Prometheus monitoring ecosystem – such as alertmanager or using Grafana for visualisation – whilst also being able to look through historical records and also take advantage of the outstanding data resiliency that S3 provides.
It should be noted that loss of all Prometheus instances during a single block window will result in Thanos not being being able show any results for that period.
This blog is written exclusively by the OpenCredo team. We do not accept external contributions.
SHARE


Anthos – A Holistic Approach to your Hybrid Cloud initiative
Multi-cloud is rapidly becoming the cloud strategy of choice for enterprises looking to modernise their applications. And the reason is simple – it gives them…
GOTOpia 2021 – Platform Engineering as a (Community) Service
Watch Nicki Watt’s talk on Platform Engineering as a (Community) Service at GOTOpia to learn what it takes to build a platform that is fit…