Metric Analysis, Application Performance Monitoring, and Log Management: Where Does Honeycomb Fit In?
By Nathan LeClaire | Last modified on November 18, 2022If you’re involved in improving the performance of your application, you’ve probably heard about application performance monitoring (APM), metric analysis, and log management. But you might not understand what they are or the differences between them. Well, you aren’t alone.
At Honeycomb, we are frequently asked these questions:
- Do I need them all?
- What’s important? Metrics? Logs?
- What’s the best way to monitor application performance?
- How does Honeycomb compare to what else is out there? Do these other tools offer observability as well?
While metric analysis, log management, and application performance monitoring are closely related, they refer to different processes that help maintain and improve your application’s performance and, for the most part, use different tools. Knowing the differences and relationships between the three can help you understand how each affects your application’s performance.
But how does Honeycomb relate to all three? We’ve found that, in some cases, Honeycomb complements other tools used for metric analysis, log management, and APM. In other cases, Honeycomb can help you reduce your usage of those tools or replace them entirely.
What is metric analysis?
In software development, metrics are quantitative measurements of an application. From this perspective, metric analysis involves performing a detailed examination of metrics data for a greater understanding of your application. It helps you see where you’ve diverged from your expected results and the inefficient parts of your application.
For unusual cases, metric analysis helps you discover how far you’ve fallen from your mean-time-to-resolve (MTTR) baseline and its impact on your application’s performance so that you can make appropriate improvements.
What is application performance monitoring?
As the name implies, application performance monitoring (APM) is the act of monitoring an application’s performance using tools that provide insight into your application. In addition, it helps identify bugs or potential issues in your application.
A poor-performing application does no one any good. There’s only so long your users can wait before churning entirely, and most of them do not leave any feedback. This challenge is a fatal one for businesses, one that application performance monitoring is trying to solve. With APM, you can monitor all services and systems running your application. So, you can see all the factors that may affect your application’s performance and even perform metric analysis based on your application performance monitoring results.
It is crucial to monitor your app if you want to know what variables in your application system are critical for your business. There are many APM tools in the market, and most typically track CPU usage, error rates, app availability, and more.
What is log management?
Log management encompasses all the processes and policies involved in generating, collecting, sorting, analyzing, and archiving log data. It lets you know where related logs are stored to sift through them to find the information you need quickly.
Logs contain information about events and errors that occur within an application. Metric analysis tools and application performance monitoring tools generate logs, either structured or unstructured. Unstructured logs are mostly qualitative logs that tell you what event or error happened at a particular time. On the other hand, structured logs are a combination of qualitative and quantitative logs having structured data which can be aggregated to tell you how many times the event or error has occurred over time.
When you devote time to managing structured logs properly, you can easily trace an error or perform some analysis on our app based on your log files. You can also quickly find information about events, requests, or errors regardless of the time they occurred. A good example is when you need to aggregate some data for a particular function, say, requests to a server. If you don’t manage or structure your logs properly, you may miss vital information because your data is all over the place.
With Honeycomb, it’s more than just metric analysis
In standard metric analysis tools, you typically work with counters that track numbers as they change over time. Some popular things to measure are the number of HTTP requests your app is serving, average latency, and rate of errors. Each one of these counters or gauges will generate one unique time series on a disk.
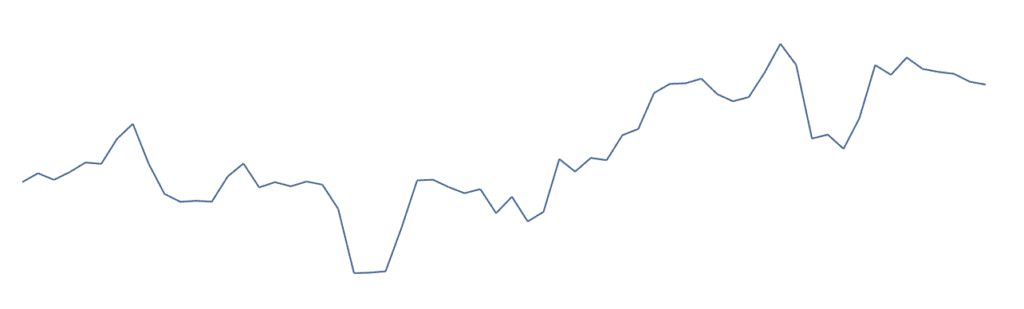
That’s good for a basic start at detecting when problems are probably happening, but we need more context to find out what is going wrong. So, we try to add more context using tags or labels, which generate new time series.
For instance, a metric measuring number_http_requests might get tagged with something like HTTP status code, creating a new time series on disk for each unique value of status code - a new time series is created for number_http_requests:200, number_http_requests:404, number_http_requests:503, and so on.
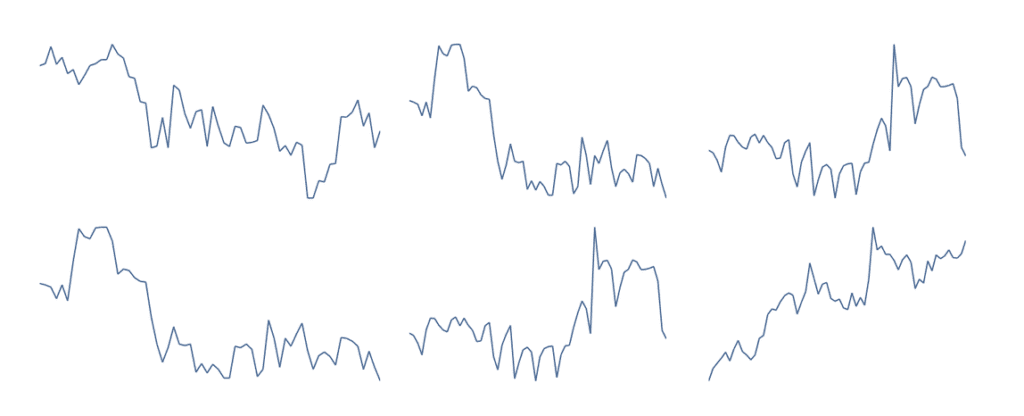
This multiplicative effect gets greater and greater as we add more tags and labels. If we want to know which host a metric came from, or which container, or which user was associated with a given request, and so on, the cost of storing all that data goes up exponentially. Likewise, if we want to track percentiles instead of averages, this will create multiples of the metric(s) in question.
We call this the “Dimensions of Doom” problem. The number of time series quickly becomes overwhelming, and impossible to store for tools that aren't designed to handle it, much less read it back quickly enough to help you figure out where issues lie.
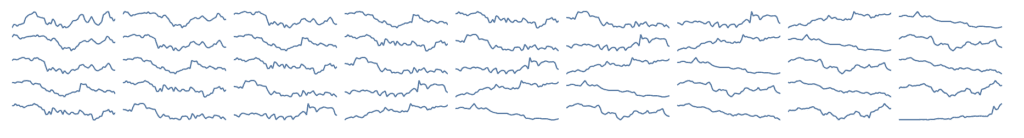
To solve this problem, your metric analysis tool must handle high-cardinality data—data with a lot of distinct possible values. Honeycomb’s storage model solves this entirely by shifting to an event-based model, where raw values are stored and queried instead of aggregating everything upfront.
Metric analysis tools often do something else that’s problematic for fast, interactive DevOps problem solving: they aggregate away raw data to save space over time. For some use cases, this makes sense since it’s rarely necessary to, for example, know exactly which measurement of CPU usage or RAM a server had in a given time window. But this loss of resolution can make it very difficult to ask more data questions and get usable answers when you’re trying to debug a production problem quickly.
With Honeycomb, debugging production issues comes easy, as you have:
- No limit on dimensions: We encourage the exact behavior that metrics systems forbid. Add fields to your events like user or team ID! Tag them with specifics about client versions! Add timers and fields that measure the behavior of third parties! Honeycomb will happily handle it all.
- Freedom to explore: You don’t need to know exactly what to measure ahead of time, just that it might be of interest to solve your issues. Since the cost of adding new dimensions and details to your data is so low relative to metrics, you can augment with all kinds of detail and dive into it later.
- Access to raw data: Sometimes, you want to filter down to only a few events and look at their exact contents. Honeycomb always allows access to the exact and complete details of the events you have retained.
Metrics excel at simple numbers to count, such as number of jobs queued, host-level resource usage, number of requests served by the system, and so on. This aggregation also makes bringing up data across long time intervals fast. But for resolving and preventing issues in production, you absolutely must have the rich details and context that Honeycomb can provide.
Honeycomb helps you go further than APM
Tools for application performance monitoring offer a particular view of the world, but modern application problems are widely varied and general. We find that APM tools usually offer a quick getting-started experience and canned dashboards that are great on Day 1. But isn’t most of your time spent on Day 2 and beyond?
APM tools also tend to be obsessed with latency as a guiding signal—but while latency matters, your apps and users are far more complex and sophisticated than something that can be described (and debugged) in terms of just latency.
At Honeycomb, we put effort into making getting started faster, especially with instrumentation (thanks to OpenTelemetry), and we’re here to support you for the long haul, too. Using OpenTelemetry lets you hit the ground running quickly and even gives you distributed tracing out of the box.
It also puts the full power of the Honeycomb query model in your hands, allowing you to ask sophisticated questions of your data across many dimensions and alert on them, too. You can use Triggers to fire off notifications for the wildest edge cases, expressed as a query across your structured events.
Consider, as well, the question of sampling—application performance monitoring tools sample your data, keeping only the slowest transactions. That’s great for keeping costs under control, but don’t you care about many indicators other than just latency? What if you want to know when an important customer sees errors or just hasn’t shown up for a while? In Honeycomb, you have complete control over how you sample your data—check out our sampling (or Refinery if you have an enterprise account) docs—keeping more of the data you care about while keeping less of the unimportant stuff.
Go beyond the spam of logs with Honeycomb
Everyone’s first program is usually a log to console. It’s no surprise that they are a popular way to gain insight into what is happening in your systems. Unfortunately, incredibly often, they end up full of massive amounts of noise which are little help for problem-solving in production, like this:
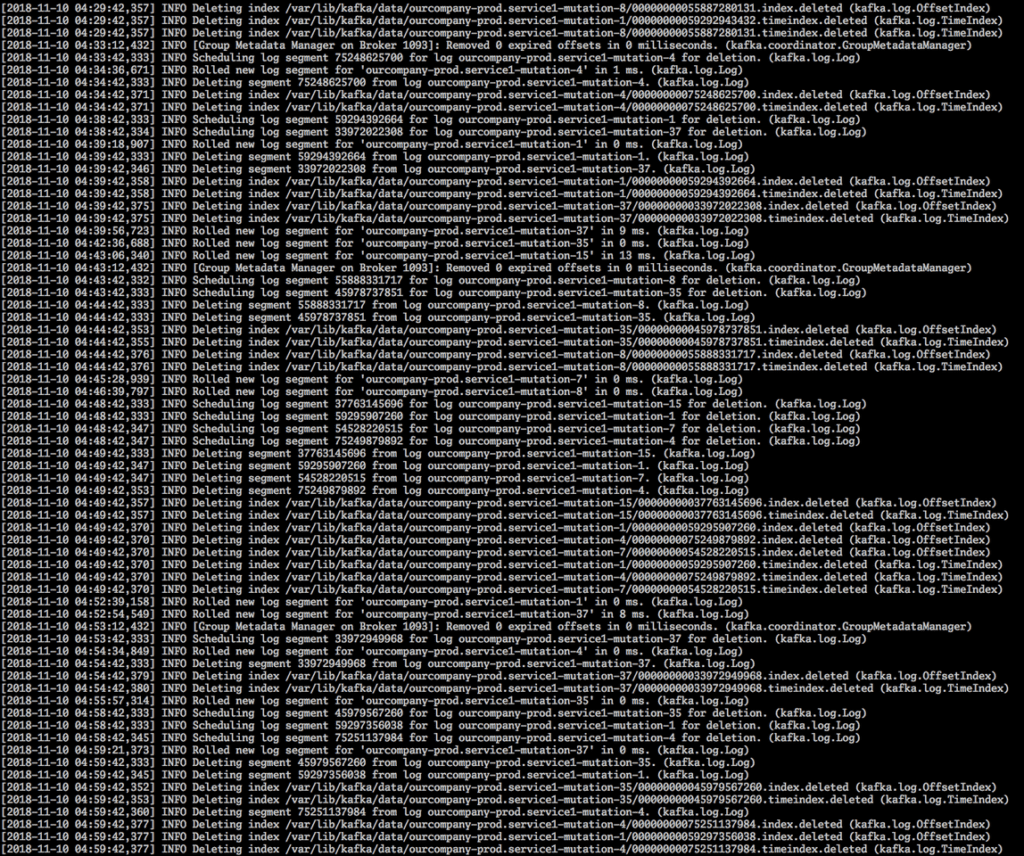
On top of any logs generated by your apps, servers themselves constantly spit out plain text logs (mostly uninteresting) about what’s happening. Finding what you’re looking for in these logs requires knowing precisely what you are digging for ahead of time. By contrast, with Honeycomb’s high-level views, you can zoom up and down through layers of detail to identify potential problem areas and ask more questions.
In our years of operational experience, we’ve found that it doesn’t take long for sending unstructured text logs to a centralized location to become very cost ineffective and slow. To get practical results out of logging frequently requires very high volume, with applications often hiding the most valuable data behind one or more “debug mode” settings that would produce far too many messages if enabled full time in production.
As a result, logging best practices involves setting log levels (DEBUG, WARN, INFO, etc.) and adding structure to your logs to pull out key fields. Sometimes this involves using programs such as Logstash to parse this structure out using complicated and fragile regular expressions.
By the time you’ve implemented this structure, you’re halfway to structured events anyway—but you’re still stuck with all the baggage of legacy logging systems and no futuristic troubleshooting features like distributed tracing and automatic surfacing of outliers.
The signal-to-noise ratio with Honeycomb tends to be much better than trying to blast every unstructured log you have into a centralized store.
Honeycomb solves the headache of log management by providing:
- Efficient storage and querying: Since data in Honeycomb has a structure by default, we store and query it much more efficiently than logging systems. In most logging systems, you have to declare indexes on fields of interest, and you are inherently limited by needing to know what you want ahead of time. Honeycomb doesn’t require you to declare any schemas or indexes upfront—all queries run blazing fast by default.
- Futuristic troubleshooting: Unlike logging systems, we offer the ability to use Honeycomb Tracing to see the lifecycle of a request as it flows through your entire system. Using Honeycomb BubbleUp, you can rapidly identify areas likely related to an issue you are seeing.
- Team features: Everyone on your team can be elevated to the level of your best debugging using features like History, Query Builder, and Boards.
Logs are beneficial for development and some use cases, such as long-term auditing, but Honeycomb has more to offer for rapid exploration and problem resolution.
Do more with Honeycomb
Honeycomb does more than allow you to monitor your applications. We champion observability, which gives you even more visibility into your apps. Honeycomb enables you to observe and debug efficiently and understand how your systems and services work under the hood. And it doesn’t matter where your org is on your observability journey; we’re always ready to help you through the process.
If you’re unsure if and how Honeycomb might complement your current metric analysis, application performance monitoring, or log management tool, you’re just an email away from getting an answer. If you want to find out on your own what you can achieve with Honeycomb, try it out for free.
Related Posts
Real User Monitoring With a Splash of OpenTelemetry
You're probably familiar with the concept of real user monitoring (RUM) and how it's used to monitor websites or mobile applications. If not, here's the...
Transforming to an Engineering Culture of Curiosity With a Modern Observability 2.0 Solution
Relying on their traditional observability 1.0 tool, Pax8 faced hurdles in fostering a culture of ownership and curiosity due to user-based pricing limitations and an...
Honeycomb + Google Gemini
Today at Google Next, Charity Majors demonstrated how to use Honeycomb to find unexpected problems in our generative AI integration. Software components that integrate with...