

When running any performance benchmarking tool on your cluster, a critical decision is always what data set size should be used for a performance test, and here we demonstrate why it is important to select a “good fit” data set size when running a HBase performance test on your cluster.
The HBase cluster configurations and the size of data set can vary the performance of your workload and the test results on the same cluster. You should pick this data set size based on what you are trying to understand about your cluster’s performance. To show the difference between a working set that fits in available memory cache and one that has to be read from underlying storage we ran 2 YCSB workload tests with appropriately chosen data set sizes on the same CDP Private Cloud Base 7.2.2 Operation Database cluster. We used data set sizes of 40GB vs 1TB and the throughput for the different YCSB workloads is compared below, in the chart higher the bar the better the throughput.
Note: Throughput = Operations per second
When an application attempts to make a read from an HBase cluster, the Region Server handling the request first checks if the needed results are in a data block that is already local to its process via its block cache. If the data block is present then the client request can be serviced directly from cache and this counts as a cache hit. However, if the block is not currently local to the Region Server process then that is counted as a cache miss and it must be read from the HFile in HDFS storage. Depending on cache utilization that block will then be saved in the cache for future requests.
As expected and seen in the summary chart, a workload where most data set fits in cache has latencies that are lower and throughput is much higher vs a workload run where data is being accessed from HFiles in hdfs storage.
To pick our workload data set sizes to meet our test goals well, it’s important to check the sizes of RegionServer heaps, L1 and L2 caches, OS buffer caches and then set an appropriate data set size. After a YCSB workload run has completed a good parameter to check as a way of verifying that things ran as expected is how much of the data was serviced from the cache (a cache hit) and how much was accessed from hdfs storage. This ratio of Region Server cache hits to the total read requests is the cache hit ratio.
You can find this info from the L1 cache hit ratio “l1CacheHitRatio” config. If you have both L1 and L2 caches set in your cluster then the L1 cache serves the index blocks and the L2 cache serves the data blocks, and you can record both L1 “l1CacheHitRatio” and L2 “l2CacheHitRatio” configs for reference.
The rest of this blog post will walk through details of our test setup, choosing the data set size, and then running YCSB with those data set sizes.
HBase cluster configuration used for this test:
- Cluster used : 6 node cluster (1 master + 5 region servers)
- Description: Dell PowerEdge R430, 20c/40t Xenon e5-2630 v4 @ 2.2Ghz, 128GB Ram, 4-2TB disks
- Security: None configured (No Kerberos)
- CDP version: CDP Private Cloud Base 7.2.2 6 node HBase cluster with 1 Master + 5 Region Servers
- JDK used jdk1.8_232
- HBase Region servers were configured with 32GB heap
- HBase master was configured with 4GB heap
- L1 cache with LruBlockCache was used with 12.3 GB cache size
- Total L1 cache in cluster is 61 GB (12.3 * 5 = 61GB)
- L2 off heap cache was not configured on the cluster
Sizing Case 1: Data completely fits into available cache on the cluster
In our HBase cluster, we configured a total of 61GB (12.3GB *5) across the 5 region servers allocated for L1 block cache. For a data set that completely fits into cache, we chose a data set that was 40GB in size.
Sizing Case 2: Data set bigger than the available cache on the cluster
For the second scenario we want the data to be much larger than the available cache. To pick an appropriate data set size we looked at both the configured HBase block cache and the OS buffer cache in the cluster. In our given HBase cluster the configured L1 block cache is 61G when aggregated across the RegionServers. The server nodes had a total of 128G RAM each and any memory not dedicated to a server process can be used by the OS to effectively cache the underlying HDFS blocks and increase overall throughput. In our test configuration there is about 96G OS cache available on each region server node for this purpose (ignoring the memory used by the DataNode or OS processes to simplify things). Aggregating this across the 5 region servers, we had a potential of almost 500G for buffers (96G * 5 region servers). Thus we chose a data set size of 1TB, exceeding both the configured block cache and available OS buffer cache.
Turning Target Data Sizes into YCSB parameters
In YCSB, a row is 1KB by default so depending on how many rows you load into the YCSB ‘usertable’ you can easily estimate your YCSB ‘usertable’ table data size. So if you upload 1 million rows, you have uploaded 1,000,000 * 1KB = 1GB of data into the YCSB ‘usertable’.
The data set sizes used for our two tests were:
- 40 GB data with 40 million rows
- 1 TB data with 1 billion rows
Test Methodology
CDP Private Cloud Base 7.2.2 was installed on the 6 node cluster and workload data with 40 million rows (total data set size => 40 GB ) was generated and YCSB workloads were run. After loading, we waited for all compaction operations to finish before starting the workload test.
YCSB workloads that were run on HBase were
- Workload A: 50% Read and 50% Update
- Workload C: 100% Read
- Workload F: 50%Read and 50% Update/Read-Modify-Write ratio: 50/50
- Custom Update Only workload: 100% Update
Each YCSB workload(A,C,F and UpdateOnly) was run for 15 min each, and the complete run was repeated 5 times with no restarts between runs to measure YCSB throughput*. The results shown are averages taken for the last 3 runs from the 5 runs. The first 2 test runs were ignored to avoid the first and second run penalty.
Once 40GB runs were completed, we dropped the usertable and re-generated 1 billion rows to create 1TB data set size and re-ran the tests with the same methodology on the same cluster.
Test Results
YCSB Results with 40GB
In the 40GB case the data can completely fit into the 61GB L1 cache on the cluster. The L1 cache hit ratio observed in the cluster during the test was close to 99%.
Tip: For smaller datasets where data can fit into cache, we can also use the cache on load option and pre-warm the cache to get 100% cache hit ratio using table option PREFETCH_BLOCKS_ON_OPEN
We ran each YCSB workload for 15 min each 5 times and took averages from the last 3 runs to avoid the first run penalty.
Results seen with 40G L1 cache hit ratio 99% on the region servers are shown below in table:
| Operation | Num Ops | Throughput | Avg Latency | 95 Latency | 99 Latency |
| (Num ops/sec) | (ms) | (ms) | (ms) | ||
| Workload C | 148558364 | 165063 | 0.24 | 0.30 | 0.48 |
| UpdateOnly | 56727908 | 63030 | 0.63 | 0.78 | 1.57 |
| Workload A | 35745710 | 79439 | 0.40 | 0.54 | 0.66 |
| Workload F | 24823285 | 55157 | 0.58 | 0.70 | 0.96 |
YCSB Results with 1TB data set
In the 1TB case the data doesn’t fit into the 61GB L1 cache on the cluster or the 500GB OS buffer cache. The L1 cache hit ratio in the cluster observed during the test was 82-84%.
We ran each workload for 15 min each 5 times, and took averages from the last 3 runs to avoid the first run penalty.
Results seen with 1TB L1 cache hit ratio 82-84% on the region servers are shown below in table:
| Operation | Num Ops | Throughput | Avg Latency | 95 Latency | 99 Latency |
| (Num ops/sec) | (ms) | (ms) | (ms) | ||
| Workload C | 2727037 | 3030 | 13.19 | 55.50 | 110.85 |
| UpdateOnly | 56345498 | 62605 | 0.64 | 0.78 | 1.58 |
| Workload A | 3085135 | 6855 | 10.88 | 48.34 | 97.70 |
| Workload F | 3333982 | 3704 | 10.45 | 47.78 | 98.62 |
*Throughput (ops/sec) = No. of operations per second
Analysis:
Comparing the test results for the two different data set sizes above, we can see how the same workload throughput can vary from 3K operations per second to 165K operations per second when data is accessed more swiftly from the 40G dataset with warmed up cache vs from hdfs storage.
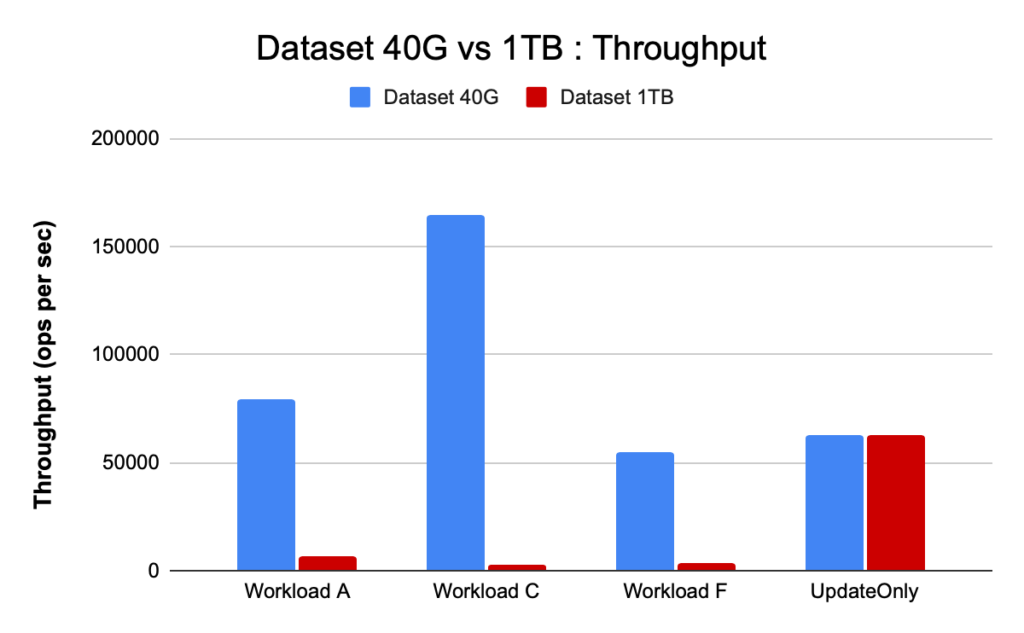
The chart below shows the throughput and compares how throughput changed for different workloads when run with the 2 different size datasets. In the chart higher the bar the better the throughput.
Note: Throughput = Operations per second
As seen in the chart, the YCSB workloads which read data like Workload A, Workload C and Workload F had a much better throughput in the 40G case where the data easily fit into cache vs the 1TB data size case where the HFile data had to be accessed from HDFS
Looking at the cache hit ratios, the 40G dataset had a cache hit ratio of close to 99%, and the 1TB data set had a cache hit ratio of around 85%, so 15% of the data in 1TB case was accessed from hdfs storage.
The YCSB custom update-only workload we ran had the same throughput in both the cases since it only did updates and no reads.
During HBase performance we look closely at the 95th and 99th percentile latencies. The average latency is just the total throughput divided by the total time however the 95th percentile and the 99th percentile show the real outliers that affect the total workload throughput. In the 1TB case, the high latency outliers in the 95th and 99th percentile cause the throughput to slow down, and in the 40GB case the low latency cache hits in the 99th percentile lead to increased total throughput.
Chart below shows the latency comparison for average latency, 95th percentile latency and 99th percentile latency and how it differs for different workloads when run with different size data sets.
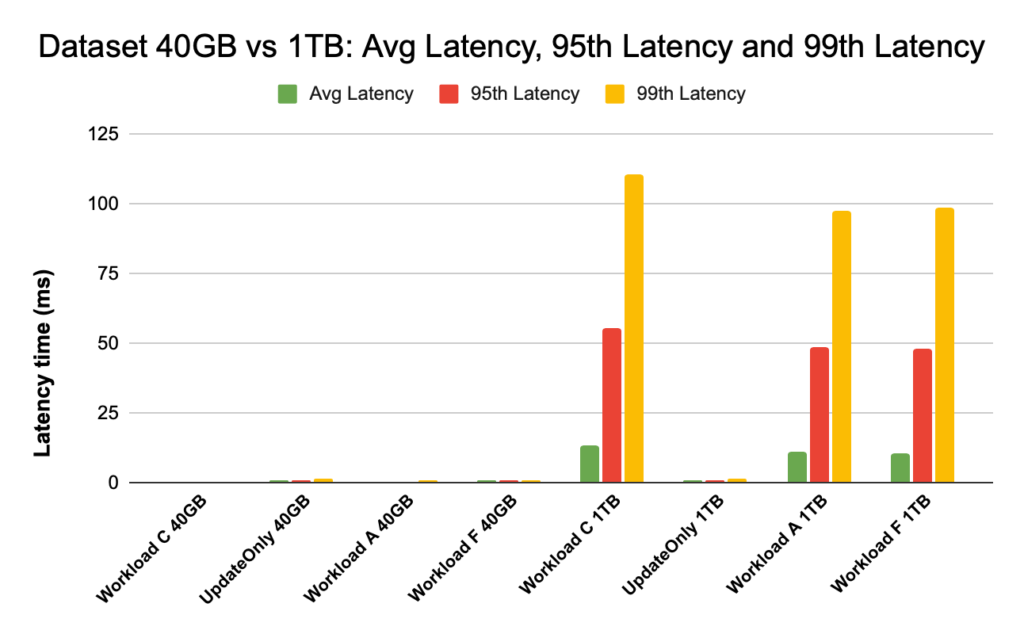
In the above chart, it’s hard to see the bars representing latency for the 40GB data set since they are extremely low as compared to latency observed for the 1TB dataset accessing data from hdfs.
We plotted the latency graph using log of the latency values to show the difference in the chart below
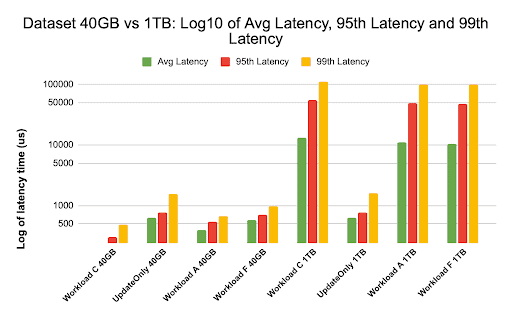
As seen above the latencies are much lower in the 40GB case where the cache hit ratio is close to 99% and most workload data is available in the cache. In comparison for the 1TB data set, cache hit ratio was around 85% as HFile data had to be accessed from HDFS storage.
The average and 99 latency for Workload C in the 40G case where 99% data is returned from the warmed up cache was around 2 – 4 ms. The 99th percentile latency for the same Workload C in the 1TB case was around 100ms for Workload C (read only workload).
This shows that a cache hit from the on-heap block cache returns a read in around 2 ms and a cache miss and getting a record from HDFS could take around 100ms on this cluster.
Recommendation:
When running a YCSB benchmarking test the data set size makes a substantial difference in the performance results, and therefore sizing the test appropriately is very important. At the same time looking at the cache hit ratio and latency differences between the min and the 99th latency will help you find the latency of a cache-hit as compared to when data is accessed from underlying storage in the cluster.
Tip:
For checking the cache hit ratios of your workload on a region server you can use the below command
curl http://<region-server-host>:22102/jmx | grep -e l1CacheHitRatio -e l2CacheHitRatio
You can also view Cache Hit ratio from the HBase Web UI following the below steps:
- From the HBase Web UI click on the region server
- Under the Block cache section select L1 (and L2 if L2 is configured) to review the cache hit ratios.
A screenshot showing the cache hit ratio from the L1 block cache is shown below:
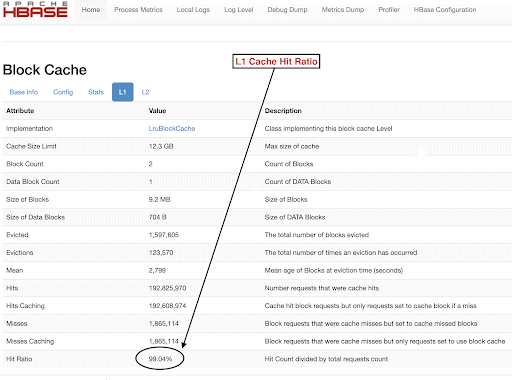
Here is a link to more info around HBase screenshot shown above and block cache https://docs.cloudera.com/runtime/7.2.2/configuring-hbase/topics/hbase-blockcache.html
About YCSB
YCSB is an open-source specification and program suite for evaluating the retrieval and maintenance capabilities of computer programs. It is a very popular tool used to compare relative performance of NoSQL database management systems.
To use YCSB to test the performance of Operational Database, check out the blog How to Run YCSB for HBase
Editor's Choice


Nice Article and very informative. Can you please tell me what options were used to run the workloads ? how many threads ?
Thanks