


If you’ve attended our annual technical trends webinars before, you know that causal inference is something that we’ve been talking about for the last few years. As the last installment of this series where we’ve been transcribing the various ML trends from this year’s webinar so the takeaways are more digestible by topic, Léo Dreyfus-Schmidt (Dataiku’s VP of Research) takes us through causal inference for machine learning (and how it ties to Reda’s markdown optimization project). Enjoy!
Léo Dreyfus-Schmidt:
Okay, great. Cool. Thanks a lot. So well, thanks for having me over to the causal inference topic because I'm very excited. As some of you know, if you've been following this ML webinar in the past years, I've been talking about this for quite a while, so it's time for us to deliver. But it's also time for us to give a quick refresher and see for you, Reda, how that ties to this type of project.
If you remember, this is the exact same image I showed last year, but I think it's the full scope of repetition. I want to stress once again, what we're talking about when we talk about those big fancy words today, which are causal inference, causal ML, or maybe for the marketers, prescriptive analytics. First, to understand in general, and when we do ML, we are in a stationary environment, where we're trying to make predictions without taking action somehow.
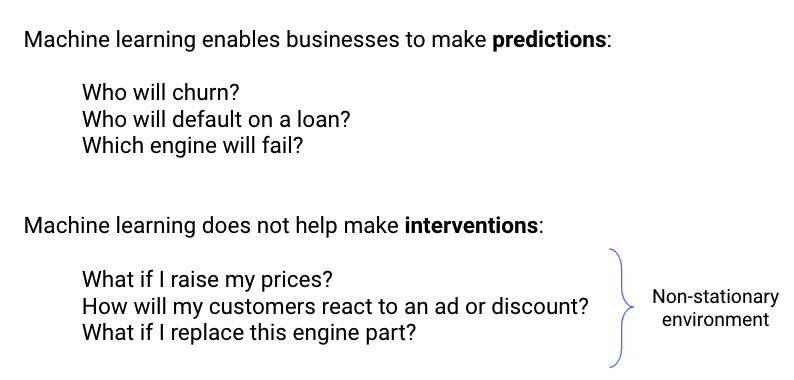
If you're trying to predict who's going to churn, you might do a follow-up action, but on its own, you're just trying to make a prediction. If you're trying to predict who will default on a loan, it's the same thing. It's only about prediction. Well, you can see, actually, on the right hand side of the screen, it's this little drawing, which is extracted from a book of Judea Pearl and it's called The Ladder of Causation.
It would be level one, it's about seeing and being able to predict what we saw, if it was going to be the same in the future. And then there's the second layer, the second rung of the ladder, which is making intervention. This is where you take action on an environment. So then you are shifting the dynamic of the environment and it becomes non-stationary because you've learned something, but then you're going to act upon it, so what you've learned will have changed.

Which is exactly what you've been discussing, Reda, is you've learned on a given environment how people interact, how people buy their product, things like that. But then when you start thinking about what if I raise more prices, what will happen? How you got to change that environment and people might behave differently, so that actually raised a lot of questions.
It actually ties nicely and we could talk maybe for next time, about reinforcement learning because there's a lot of analogies that we can make between the two. And causal inference and causal ML here are trying to help us move forward on that ladder and trying to see how we can think about those interventions? What can we say with them? How can we try to estimate the effect of those interventions? So it says globally and I hope is giving you the high level picture of what this is about, really about making interventions.
Generally, I think what we're all trying to do is we're trying to get better and closer to the decision making. We don't only stick to predictions. Who cares if you know who will churn if you don't act upon it? You're going to have to do a follow-up action and this is what we're going to do every time we're using machine learning models.
So this change of paradigm is really putting the focus into the action, into the treatment, the intervention at the center of the models. I want to take the project you've just presented to us, Reda, and highlight it with a causal lens somehow. What you see here, if I were to use a fancy word, is a causal graph. It's where we have nodes that represent events and then we try to connect them in a casual manner.
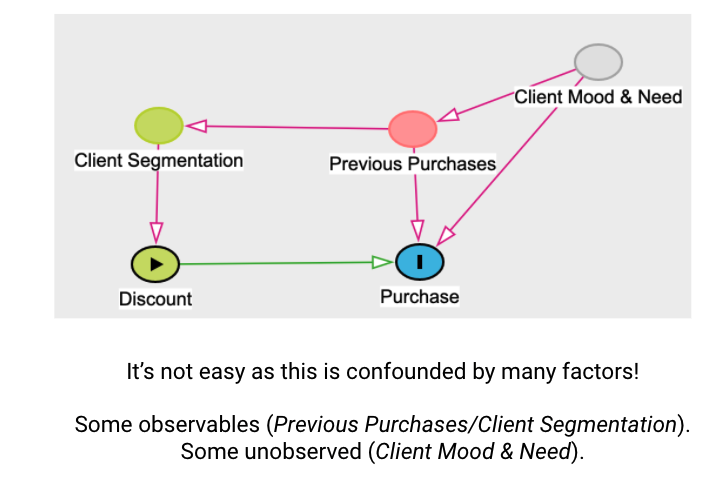
It's really fuzzy and it's actually very, very hard to be defined properly. But I'm trying to picture what's happening under the hood. Probably in most companies, you have client segmentation. It might be gold, it might be silver, it might be bronze, whatever it is. This is usually used to drive the discount policy, which is another factor that you get. So here, I'm talking about, to be totally honest, another part, which is if you were to do personalized discounts for individuals, not for products, but just to give a different perspective. And then you know that discount will have an effect on purchase, which is exactly what Reda had been saying. We think that the more discount I give you on most products, the elasticity will say that you'll purchase more.
But then you have another type of causal, edges here in that graph, which is the way you use to buy. So basically, your previous purchases kind of drive your purchase. For instance, if you're running out of something that you need, I don't know, milk, then you're going to go and buy another one, independently of the discount, perhaps because you just need it. And then I try to put it on top, on the upper right, this fuzzy thing, which we would call an unobserved variable or an unobserved confounder here, which is a client mood and need, which is something I can't really measure. If we think about that graph, what we're really trying to do with Reda's project is we're trying to see how can I change the discount, the different level of discounts, so they're going to impact the purchase? If you want to do that, you really want to isolate the impact of the discount.
But here we can see what we're going to call back doors, which is all those paths that connect the outcome purchase to other things. Here, we see that I can go from purchase back to client mood, to previous purchase and to client segmentation, for instance. That means that the discount effect on purchase is confounded by things like that. To put it differently, if you are a gold member, maybe I give you a lot of discounts because you're a gold member, but maybe you will buy anyway, so I don't know if it's because I gave you the discount that you buy, or it's because of the way I did the segmentation myself previously. This is, I guess, an introductory discussion on what are causal graphs and how we can model use cases like that. What we want to do, if we really want to identify the impact of discount on purchase, is we actually would try to do random allocation.

That's what you can see with the little scissors here. I'm just going to cut down the client segmentation part. I'm just going to try to be, and this is, if I'm understand correctly, a bit what has been done on your project, Reda, is for a lot of product, there has been different types of discounts observed in the past, more or less randomly, I understand, which could bring some questions for me later on. But if you do that in that graph, well, you know for sure because there's nothing that impacts the discount here, so there's nothing that connects purchases back to discount, that whatever you're going to be measuring really adds, I guess, the volume of purchase with discount minus the volume of purchase without discount is really, really due to the discount itself. I don't know if it makes a lot of sense, but I just want to give this as a way to think of these use cases to be careful when you really try to pinpoint an effect of an action on something, is that it could be confounded, it could be misleading and biased in the end by a lot of other factors.
What that actually means in terms of techniques, and this is where we're going to talk about uplift modeling, that different type of way to model that. What I want to say is what's important here and it's usually what's most important in many ML projects is how are you going to measure success? Which metrics are you going to use? And for those types of projects to try to measure the impact of the treatment of an action on something, you need specific measures, which I call uplift metrics.
This is what you can see, even though I'm not going to go into the details of this, there's a cumulative gain curve, there's an uplift curve and this little formula, same thing. I'm just going to limit it to the beauty of mathematics. I'm not going to go and explain what it is, but it is what we should take away from this, if you need to think of different models, but especially of different metrics to measure the impact of the policy you're thinking of.

The good news is that those things exist already because a lot of people have been thinking about that fact. And so there's a lot of existing open source solutions that can help you bootstrap your way into this. As much as everybody has been so familiar and so thankful for scikit-learn and packages like this, there are other packages. I picked one because we've been talking about this in the past and because it's been one of the first at that level who came from Uber, which is CausalML, and really just to say it's not what I say you should do that, but you can really think, just change a little bit of your code. And you can go from an API where you have X and Y (which is your features in your target) to add a little T for treatment for action.
And then you can leverage existing open source solutions. There are others from Microsoft and other tools, but it's just to say that it's out there and it's easy to use. And we've actually been working in trying to make this easier for our users to leverage within our platform, actually. And I want to conclude this and then tie it back to you, Reda, saying that we need to be careful when using those techniques and it's easy to give impact where there is no impact. There's this assumption of positivity. So I'm just going to say quickly, you need to make sure that you've observed a certain type of discount for all of your products. Otherwise, you're going to be extrapolating. That's a big issue.
Hopefully, next year, we can present to you our solution on uplift modeling, with guardrails. I want to thank you, Reda, for presenting those super cool topics and I hope I gave you some different perspective on this.