Dynamic Sampling by Example
By Liz Fong-Jones | Last modified on June 10, 2019Last week, Rachel published a guide describing the advantages of dynamic sampling. In it, we discussed varying sample rates to achieve a target collection rate overall, and having different sample rates for distinct kinds of keys. We also teased the idea of combining the two techniques to preserve the most important events and traces for debugging without drowning them out in a sea of noise.
While these techniques work out of the box in our log ingestion agent honeytail, you may want to know how exactly it works under the hood, or want to implement it yourself! This week I'm doing a show-and-tell to demonstrate these techniques. This pedagogical example is in Go but is straightforward to port to any language that supports hashes/dicts/maps, pseudorandom number generation, and concurrency/timers.
Our base case
Let's suppose we would like to instrument a high-volume handler that calls a downstream service, performs some internal work, then returns a result and unconditionally records an event to Honeycomb (or another instrumentation collector):
func handler(resp http.ResponseWriter, req *http.Request) {
	start := time.Now()
	i, err := callAnotherService()
	resp.Write(i)
	RecordEvent(req, start, err)
}
This is unnecessarily noisy; in Honeycomb, this would result in a shortened retention period for the dataset. With a different collection provider, this would result in a sky-high bill proportional to your traffic volume.
Fixed-rate sampling
A naive approach might be probabilistic sampling using a fixed rate, by randomly choosing to send 1 in 1000 events.
var sampleRate = flag.Int("sampleRate", 1000, "Static sample rate")

func handler(resp http.ResponseWriter, req *http.Request) {
	start := time.Now()
	i, err := callAnotherService()
	resp.Write(i)

	r := rand.Float64()
	if r < 1.0 / *sampleRate {
		RecordEvent(req, start, err)
	}
}
Then, on the receiving end at Honeycomb or another instrumentation collector, we'd need to remember that each event stood for sampleRate events and multiply out all counter values accordingly.
Go to the next page to learn about adjusting the sample rate.
Recording the sample rate
What if we need to change the flagged value at some point in the future? The instrumentation collector wouldn't know exactly when the value changed. Thus, it's better to explicitly pass the current sampleRate when sending a sampled event -- indicating the event statistically represents sampleRate similar events.
// Note: sampleRate can be specific to this service and doesn't have to be universal!
var sampleRate = flag.Int("sampleRate", 1000, "Service's sample rate")

func handler(resp http.ResponseWriter, req *http.Request) {
	start := time.Now()
	i, err := callAnotherService()
	resp.Write(i)

	r := rand.Float64()
	if r < 1.0 / *sampleRate {
		RecordEvent(req, *sampleRate, start, err)
	}
}
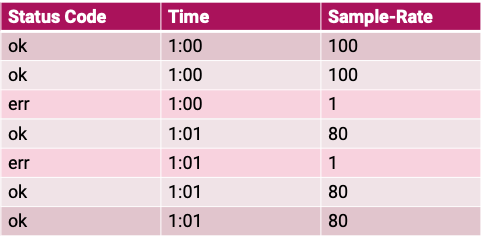
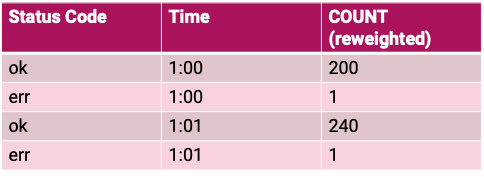
This way, we can keep track of the sampling rate in effect when each sampled event was recorded. This gives us the data to accurately calculate even if the sampling rate is different. For example, if we were trying to calculate the total number of events meeting a filter such as "err != nil", we'd multiply the count of seen events with "err != nil" by each's sampleRate. And if we were trying to calculate the sum of durationMs, we'd need to weight each sampled event's durationMs, multiplying it by sampleRate before adding the weighted figures all up.
There's more to consider about how sampling rates and tracing work together though in the next section.
Consistent sampling
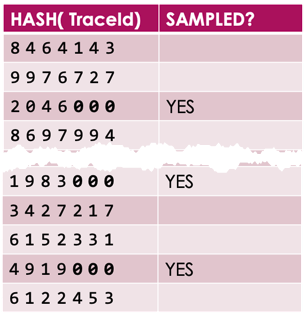
We also need to consider how sampling interacts with tracing. Instead of independently generating a sampling decision inside of each handler, we should use a centrally generated "sampling/tracing ID" propagated to all downstream handlers. Why? This lets us make consistent sampling decisions between different manifestations of the same end user's request. It would be unfortunate to discover that we have sampled an error far downstream for which the upstream context is missing because it was dropped. Consistent sampling guarantees that if a 1:100 sampling occurs, a 1:99, 1:98, etc. sampling preceding or following it also preserves the execution context. And half of the events chosen by a 1:100 sampling will be present under a 1:200 sampling.
var sampleRate = flag.Int("sampleRate", 1000, "Service's sample rate")

func handler(resp http.ResponseWriter, req *http.Request) {
	// Use an upstream-generated random sampling ID if it exists.
	// otherwise we're a root span. generate & pass down a random ID.
	var r float64
	if r, err := floatFromHexBytes(req.Header.Get("Sampling-ID")); err != nil {
		r = rand.Float64()
	}

	start := time.Now()
	// Propagate the Sampling-ID when creating a child span
	i, err := callAnotherService(r)
	resp.Write(i)

	if r < 1.0 / *sampleRate {
		RecordEvent(req, *sampleRate, start, err)
	}
}
Now we have support for adjusting the sample rate without recompiling, including at runtime. But why manually adjust the rate? In the next chapter, we'll discuss Target Rate Sampling.
Target Rate Sampling
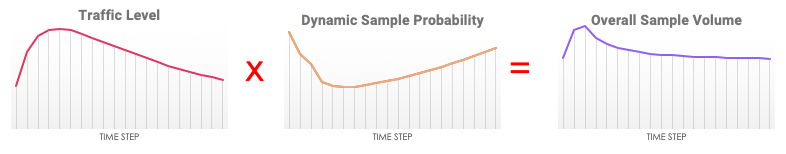
We don't need to manually flag-adjust the sampling rates for each of our services as traffic swells and sags; instead, we can automate this by tracking the incoming request rate that we're receiving!
var targetEventsPerSec = flag.Int("targetEventsPerSec", 5, "The target number of requests per second to sample from this service.")

// Note: sampleRate can be a float! doesn't have to be an integer.
var sampleRate float64 = 1.0
// Track requests from previous minute to decide sampling rate for the next minute.
var requestsInPastMinute *int

func main() {
	// Initialize counters.
	rc := 0
	requestsInPastMinute = &rc

	go func() {
		for {
			time.Sleep(time.Minute)
			newSampleRate = *requestsInPastMinute / (60 * *targetEventsPerSec)
			if newSampleRate < 1 {
				sampleRate = 1.0
			} else {
				sampleRate = newSampleRate
			}
			newRequestCounter := 0
			// Production code would do something less race-y, but this is readable
			requestsInPastMinute = &newRequestCounter
		}
	}()
	http.Handle("/", handler)
	[...]
}

func handler(resp http.ResponseWriter, req *http.Request) {
	var r float64
	if r, err := floatFromHexBytes(req.Header.Get("Sampling-ID")); err != nil {
		r = rand.Float64()
	}

	start := time.Now()
	*requestsInPastMinute++
	i, err := callAnotherService(r)
	resp.Write(i)

	if r < 1.0 / sampleRate {
		RecordEvent(req, sampleRate, start, err)
	}
}
The previous code lets us have a predictable retention window (or bill, with another collection service). However, it has one significant drawback, which we'll address in the next chapter on per-key rates.
Having more than one static sample rate
If the sampling rate is high, whether due to being dynamically or statically set high, we need to consider that we'll miss long tail events -- for instance, errors or high latency events, because the chance that a 99.9th percentile outlier will also be chosen for random sampling is slim. Likewise, we may want to have at least some data for each of our distinct customers rather than have the high-volume customers drown out the low-volume customers.
So, we'd like to sample events by a property of the event itself, such as the return status, latency, endpoint, or a high cardinality field like customer ID. For properties present in the request itself such as endpoint or customer ID, we can perform "head sampling" and make the decision to sample or not at the start of execution and propagate that decision further downstream (e.g. with a "require sampling" header bit) so we get full traces.
But for return status and latency, we know only in retrospect whether they're interesting outliers; this is "tail sampling". Downstream services already have independently chosen whether to discard or instrument, so at best we'll have the outlying downstream spans, but none of the other context. To collect full traces and perform tail sampling, some collector-side logic is required to buffer entire traces and retrospectively decide what to keep. This buffered sampling technique is not feasible entirely from within the instrumented code.
Let's start varying the sample rates by key. We can sample the baseline non-outlier events at 1 in 1000 and choose to tail sample the errors & slow queries 1:1 or 1:5. This is still vulnerable to spikes of instrumentation cost if we get a spike in the rate of errors. Modifying the original flat sampling code, we get:
var sampleRate = flag.Int("sampleRate", 1000, "Service's sample rate")
var outlierSampleRate = flag.Int("outlierSampleRate", 5, "Outlier sample rate")

func handler(resp http.ResponseWriter, req *http.Request) {
	start := time.Now()
	i, err := callAnotherService(r)
	resp.Write(i)

	r := rand.Float64()
	if err != nil || time.Since(start) > 500*time.Millisecond {
		if r < 1.0 / *outlierSampleRate {
			RecordEvent(req, *outlierSampleRate, start, err)
		}
	} else {
		if r < 1.0 / *sampleRate {
			RecordEvent(req, *sampleRate, start, err)
		}
	}
}
So we can support having multiple different sample rates. But how does this work with Target Rate Sampling?
Sampling by key and target rate
Putting the two techniques together: let's extend what we've already done to target specific rates of instrumentation: if a request is anomalous (has latency above 500ms or is an error), let's choose it for tail sampling at its own guaranteed rate, while ratelimiting the other requests to fit within a budget of instrumented requests per second as per before:
var targetEventsPerSec = flag.Int("targetEventsPerSec", 4, "The target number of ordinary requests per second to sample from this service.")
var outlierEventsPerSec = flag.Int("outlierEventsPerSec", 1, "The target number of outlier requests per second to sample from this service.")

var sampleRate float64 = 1.0
var requestsInPastMinute *int

var outlierSampleRate float64 = 1.0
var outliersInPastMinute *int

func main() {
	// Initialize counters.
	rc := 0
	requestsInPastMinute = &rc
	oc := 0
	outliersInPastMinute = &oc

	go func() {
		for {
			time.Sleep(time.Minute)
			newSampleRate = *requestsInPastMinute / (60 * *targetEventsPerSec)
			if newSampleRate < 1 {
				sampleRate = 1.0
			} else {
				sampleRate = newSampleRate
			}
			newRequestCounter := 0
			requestsInPastMinute = &newRequestCounter

			newOutlierRate = outliersInPastMinute / (60 * *outlierEventsPerSec)
			if newOutlierRate < 1 {
				outlierSampleRate = 1.0
			} else {
				outlierSampleRate = newOutlierRate
			}
			newOutlierCounter := 0
			outliersInPastMinute = &newOutlierCounter
		}
	}()
	http.Handle("/", handler)
	[...]
}

func handler(resp http.ResponseWriter, req *http.Request) {
	var r float64
	if r, err := floatFromHexBytes(req.Header.Get("Sampling-ID")); err != nil {
		r = rand.Float64()
	}
	start := time.Now()
	i, err := callAnotherService(r)
	resp.Write(i)
	if err != nil || time.Since(start) > 500*time.Millisecond {
		*outliersInPastMinute++
		if r < 1.0 / outlierSampleRate {
			RecordEvent(req, outlierSampleRate, start, err)
		}
	} else {
		*requestsInPastMinute++
		if r < 1.0 / sampleRate {
			RecordEvent(req, sampleRate, start, err)
		}
	}
}
Whew. That has a number of awkward cut-pastes, so we probably shouldn't paste again to support a third category. Instead, we need to support arbitrarily many keys.
Sampling with dynamic rates on arbitrarily many keys
What if we can't predict a finite set of request quotas we want to set -- e.g. if we want to cover the customer id case above? It was ugly enough to set the target rates by hand for each key ("error/latency" vs. "normal"), and incurred a lot of duplicate code. We can refactor to instead use a map for each key's target rate and number of seen events, and do lookups to make sampling decisions. And this is how we get to what's implemented in the dynsample-go library, which maintains a map over any number of sampling keys and allocates a fair share to each key as long as it's novel. It looks something like this:
var counts map[SampleKey]int
var sampleRates map[SampleKey]float64
var targetRates map[SampleKey]int

func neverSample(k SampleKey) bool {
	// Left to your imagination. Could be a situation where we know request is a keepalive we never want to record, etc.
	return false
}

// Boilerplate main() and goroutine init to overwrite maps and roll them over every interval goes here.

type SampleKey struct {
	ErrMsg        string
	BackendShard  int
	LatencyBucket int
}

// This might compute for each k: newRate[k] = counts[k] / (interval * targetRates[k]), for instance.
// The dynsample library has more advanced techniques of computing sampleRates based on targetRates, or even without explicit targetRates.
func checkSampleRate(resp http.ResponseWriter, start time.Time, err error, sr map[interface{}]float64, c map[interface{}]int) float64 {
	msg := ""
	if err != nil {
		msg = err.Error()
	}
	roundedLatency := 100 *(time.Since(start) / (100*time.Millisecond))
	k := SampleKey {
		ErrMsg:       msg,
		BackendShard: resp.Header().Get("Backend-Shard"),
		LatencyBucket: roundedLatency,
	}
	if neverSample(k) {
		return -1.0
	}

	c[k]++
	if r, ok := sr[k]; ok {
		return r
	} else {
		return 1.0
	}
}

func handler(resp http.ResponseWriter, req *http.Request) {
	var r float64
	if r, err := floatFromHexBytes(req.Header.Get("Sampling-ID")); err != nil {
		r = rand.Float64()
	}

	start := time.Now()
	i, err := callAnotherService(r)
	resp.Write(i)

	sampleRate := checkSampleRate(resp, start, err, sampleRates, counts)
	if sampleRate > 0 && r < 1.0 / sampleRate {
		RecordEvent(req, sampleRate, start, err)
	}
}
We're close to having everything put together. But let's make one last improvement by combining the tail-based sampling we've done so far with head-based sampling that can request tracing of everything downstream.
Putting it all together: head and tail per-key target rate sampling
If you want to make head sampling automatically instrument everything downstream, make sure you pass the head sampling decision and corresponding rate from parent to child span (e.g. via HTTP header) to force sampling even if dynamic sampling at the lower level's context would not have chosen to instrument the request.
var headCounts, tailCounts map[interface{}]int
var headSampleRates, tailSampleRates map[interface{}]float64

// Boilerplate main() and goroutine init to overwrite maps and roll them over every interval goes here. checkSampleRate() etc. from above as well

func handler(resp http.ResponseWriter, req *http.Request) {
	var r, upstreamSampleRate float64
	if r, err := floatFromHexBytes(req.Header.Get("Sampling-ID")); err != nil {
		r = rand.Float64()
	}

	// Check if we have an non-negative upstream sample rate; if so, use it.
	if upstreamSampleRate, err := floatFromHexBytes(req.Header.Get("Upstream-Sample-Rate")); err == nil && upstreamSampleRate > 1.0 {
		headSampleRate = upstreamSampleRate
	} else {
		headSampleRate := checkHeadSampleRate(req, headSampleRates, headCounts)
		if headSampleRate > 0 && r < 1.0 / headSampleRate {
			// We'll sample this when recording event below; propagate the decision downstream though.
		} else {
			// clear out headSampleRate as this event didn't qualify for sampling.
			headSampleRate = -1.0
		}
	}

	start := time.Now()
	i, err := callAnotherService(r, headSampleRate)
	resp.Write(i)

	if headSampleRate > 0 {
		RecordEvent(req, headSampleRate, start, err)
	} else {
		// Same as for head sampling, except here we make a tail sampling decision we can't propagate downstream.
		tailSampleRate := checkTailSampleRate(resp, start, err, tailSampleRates, tailCounts)
		if tailSampleRate > 0 && r < 1.0 / tailSampleRate {
			RecordEvent(req, tailSampleRate, start, err)
		}
	}
}
That was complicated, but is extremely powerful for capturing all the necessary context we need to effectively debug our modern, high-throughput systems. There's even more interesting ways to combine head and tail based trace sampling, such as temporarily increasing the probability of head sampling on the request's head sampling key if a tail heuristic saw an error in the response.
And, of course, collector-side buffered sampling allows deferring sampling decisions until after an entire trace has been buffered, bringing the advantages of head sampling to properties known at the tail.
Conclusion
Hopefully this practical, iterative set of code examples inspired you to get started with dynamic sampling in your own code. And if you're interested in overcoming the limitation of per-process sampling decisions and be able to make tail-based sampling decisions based on buffered execution traces, Honeycomb has an upcoming buffered sampling feature. Email solutions@honeycomb.io to request early access.
For more information, read the Honeycomb documentation on sampling, or look at our sample code in Go or JavaScript, and Travis-CI's Ruby port! Our friends at Cribl have also written a post on dynamic sampling of log data, with no new code needed! Write to me at lizf@honeycomb.io if you have comments or questions!
Related Posts
Instrumenting a Demo App With OpenTelemetry and Honeycomb
A few days ago, I was in a meeting with a prospect who was just starting to try out OpenTelemetry. One of the things that...
OpenTelemetry Best Practices #2 Agents, Sidecars, Collectors, Coded Instrumentation
For years, we’ve been installing what vendors have referred to as “agents” that reach into our applications and pull out useful telemetry information from them....
What Is Application Performance Monitoring?
Application performance monitoring, also known as APM, represents the difference between code and running software. You need the measurements in order to manage performance....