GitLab plans to make observability a more integrated element of its continuous integration/continuous delivery (CI/CD) platform after acquiring Opstrace.
Opstrace’s open source project exposes a horizontally scalable application programming interface (API) created by Cortex for Prometheus, an open source monitoring platform being advanced under the auspices of the Cloud Native Computing Foundation (CNCF). It then makes use of a Loki API to collect log data.
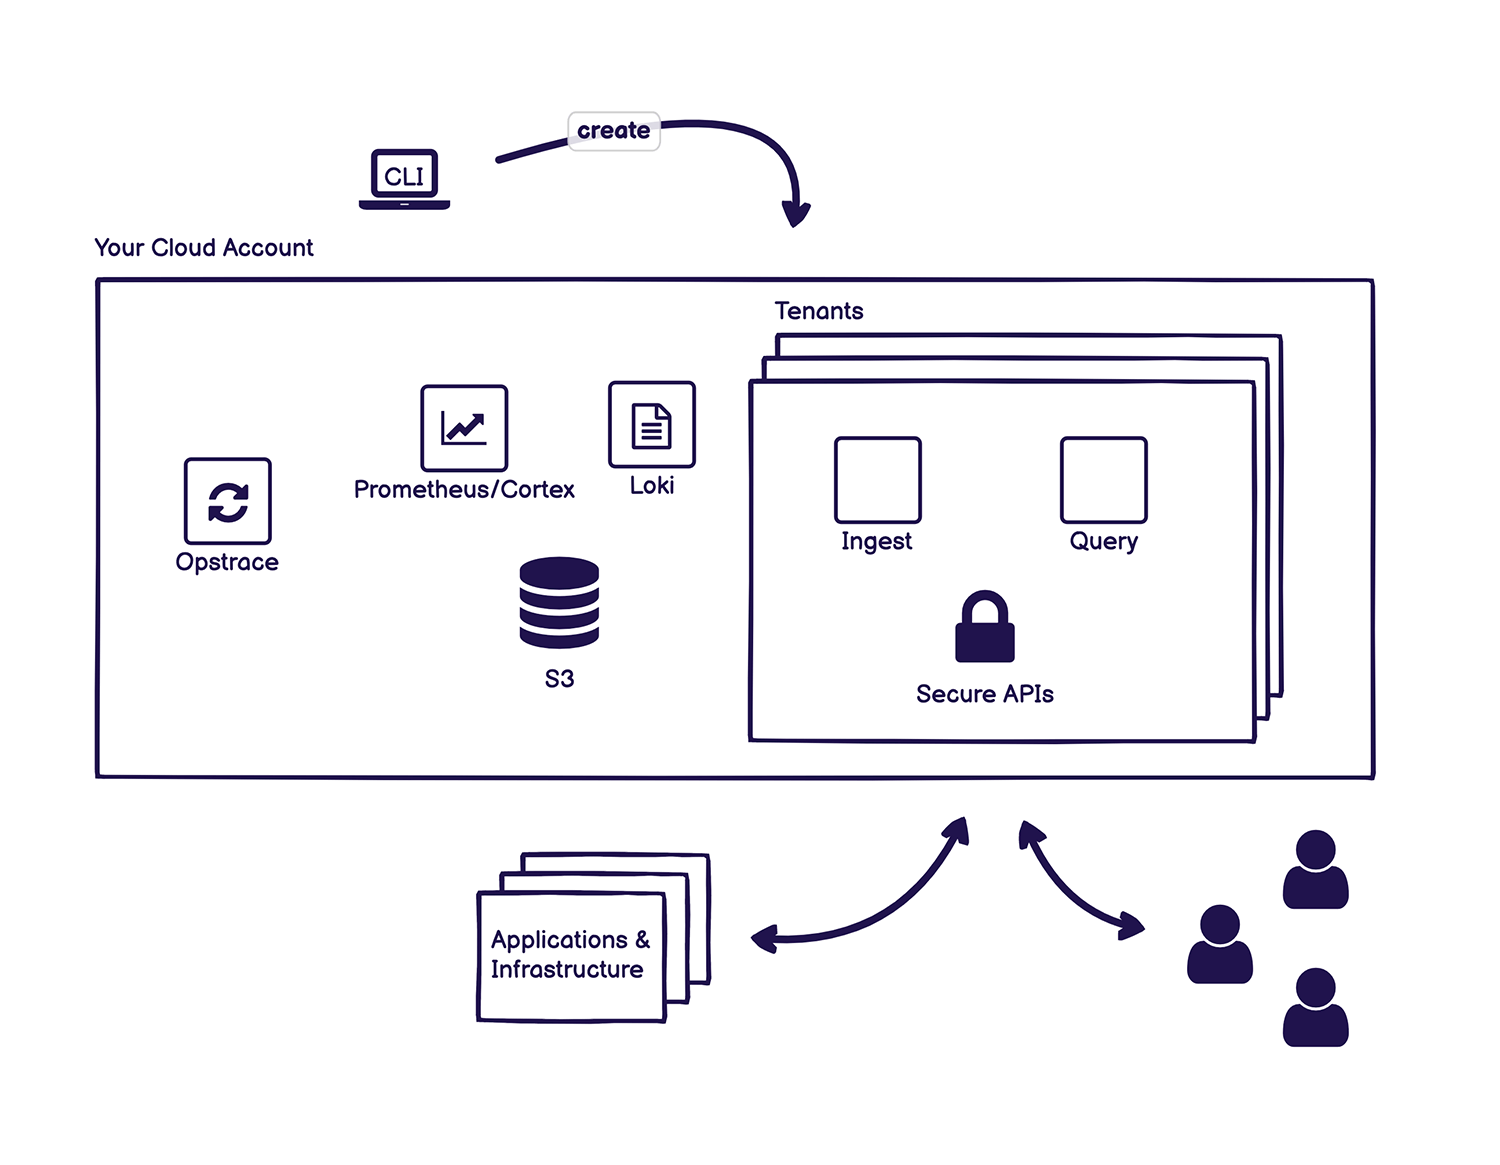
DevOps teams can also point an existing instance of Prometheus to Opstrace or any instance of Fluentd or Promtail software they are using to collect log data, with support for a wide variety of other APIs, such as the Datadog agent, planned. A command line interface (CLI) is provided to set an instance of Opstrace that creates a controller through which the collecting of log data is managed.
Kenny Johnston, senior director for product management for GitLab, said as part of an ongoing effort to make observability more accessible, GitLab plans to integrate Opstrace by default with GitLab Monitor for organizations that use either the self-managed version of GitLab or the software-as-a-service (SaaS) platform.
Opstrace currently collects logs and metrics and support for distributed traces is planned. The goal is to extend the overall scope of observability capabilities that GitLab already provides within its CI/CD platform, noted Johnston. The goal is to make it simpler for DevOps teams to employ observability capabilities and interrogate data to optimize workflows without acquiring a separate observability platform, he added.
GitLab is betting that, as Prometheus continues to gain traction, more DevOps teams will prefer to extend its reach into the realm of observability rather than having to manage a separate platform.
Although observability has always been a core tenet of DevOps best practices, achieving it has proven to be a challenge. At best, most organizations can continuously monitor IT environments based on predefined metrics that identify when a specific platform or application is performing within expectations. Observability combines metrics, logs and traces—a specialized form of logging—to instrument applications in a way that makes it simpler to troubleshot issues without having to rely solely on a limited set of pre-defined metrics that have been created to monitor a specific process or function.
The rate at which DevOps teams will embrace observability will naturally vary. In 2022, the biggest obstacle might not be the technology as much as it is simply understanding what queries can help DevOps teams better understand the root cause of an IT issue before there is a major disruption. In the long term, it’s expected that machine learning algorithms will leverage the data collected by observability platforms to automatically identify issues that might lead to a disruption long before it actually occurs.
One way or another, the ability to discern events even within the most complex IT environment is steadily improving. Whether that’s accomplished as an extension of monitoring or by embracing true observability may not be all that relevant—as long as the ultimate goal is achieved.