Mastering Sustainable Startup Growth and Finding Your Relevant KPIs
To unlock growth in a company, you must first find the KPI that is core towards increasing company value. More effective knowledge of growth comes from a deeper understanding of the characteristics of a “perfect client,” the trends between user cohorts, and finding the tipping point that solidifies retention and engagement.

To unlock growth in a company, you must first find the KPI that is core towards increasing company value. More effective knowledge of growth comes from a deeper understanding of the characteristics of a “perfect client,” the trends between user cohorts, and finding the tipping point that solidifies retention and engagement.

Erik’s a VC GP who has invested into over 50 tech companies and realized notable exits, two of which were sales to Box and Twilio.
Expertise
PREVIOUSLY AT

Executive Summary
For a company to grow, it first must understand the components that actually drive the growth of its value.
- The quest for growth is at the front of mind for all businesses, yet many businesses gauge their growth on metrics that are not aligned with company value maximization.
- Founders should select one KPI that is rooted within the problem that they are are solving and that is represented in the action clients take to receive the solution being offered.
- Early-stage companies often focus on revenue as the main KPI, which tends to represent value capture over value creation. Focusing on KPIs, such as active users, is more useful, because it is centered around the validation of the business model.
Once a KPI target has been set, dive into the characteristics of the users to understand the perfect client profile.
- Cohort analysis is critical for unearthing user trends over time periods. Because startups change quickly and deploy different growth experiments, each cohort (batch) of new customers tends to behave in different ways.
- Growth occurs from three actions: paid PR/marketing, organic inbound, and referral traffic. Each have different trajectories of behavioral responses from users.
- Use statistical analysis to dive further into cohort data, such as Chow test and viral coefficient methods. Linear regression analysis will allow for the significance of each variable to be tested.
To sustain growth, measure the actions that correspond to user retention and focus on them going forward.
- With the best clients identified, we now need to isolate the tipping point action, which hooked them on the product and increased their engagement.
- This could be, for example, the moment a customer makes their third purchase on a marketplace platform. At which they now trust the service and are comfortable with it.
- In order to guide users towards this moment, growth efforts must focus on the UX of the customer journey and using both data and design to ensure that it is seamless.
- Now, with more understanding of past data and the actions that correspond with success, you and your company will have more insight to drive sustainable growth going forward.
How Do We Unbundle the Components of Growth?
My partners and I co-founded Firstrock Capital to help startups grow, working with them to meet whatever challenge they might face in any particular week. Over the years, the most important means to that end revealed itself to be that of helping them break down and scientifically manipulate the underlying drivers of startup growth itself. So many of our companies were achieving great things in terms of raising capital, building stunning technologies, and attracting clients and media attention, but when the conversations turned to, “What truly defines our growth, and are we growing the right way with the right users day-over-day, week-over-week?” matters too often became more uncertain.
This realization prompted us to begin formalizing certain tools and processes for helping our portfolio companies with this approach so that we could focus on the most impactful matters as quickly as possible. As we began to deploy them, our conversations changed from “the car is moving but there appears to be an issue with the engine” to “here’s what is and is not working, now let’s fix this.”
This article outlines the tools and techniques that we have found the most useful and is intended to be a map for various aspects that can be further unpacked, debated, and refined. While working with our portfolio companies, my partners and I found that once growth data had been parsed into its key drivers such as retention, core action, and defining characteristics of best users and cohorts, it was almost invariably a revelation for all parties.
1. Define the Metric That Truly Captures Growth in Company Value
The first step to mastering startup growth metrics, so obvious it is often glossed over, is specifying exactly what to grow in the first place. Founders should select one key performance metric (KPI) that is rooted in the problem that they are are solving and that represents the action their clients take to receive the solution:
- If all users are roughly proportionate in their use and/or if value comes from how many distinct users are on the platform, then total active users may be best (e.g., social networks).
- If clients are disproportionate in their use of the product and contributions to the company’s value, then total actions taken may be the more correct KPI (e.g., marketplaces, where factors such as repeat usage and higher revenue for larger ticket items, makes some users more valuable than others).
Any given situation lies along a spectrum; for example, a professional networking app may initially track how many prospective professionals and employers are actively using it. They would likewise then need to define what they mean by “active,” either based on the hypothesis of how often a user should perform the relevant action or by a frequency analysis of how often the users are doing so on average.
If the business model is based on advertising or analytics on aggregate user behavior, then this KPI may be correct. However, if the business model is to receive a percent-based commission of the value of the contracts that result from it, then the relevant KPI measurement would be the dollar volume of contracts executed via the platform. The key is to be clear on how the underlying value is created and your business model for receiving a portion of it.
Selecting this metric enables success to be defined amidst the organized chaos of an early-stage company and aligns all team members towards its vision and strategy. Several of my portfolio CEOs have found that it helps to post the current months’ KPI goal and progress to date on dashboards ranging from simple whiteboards to in-house platforms and then respond to any idea by asking how it would contribute to hitting that goal—this instills not only focus but also the anchoring for greater creativity.
The primary KPI for an early-stage company is rarely revenue. Revenue is, of course, important within startup metrics and becomes increasingly so as companies scale, but represents value capture rather than value creation. More valuable at the early stage than quantity of revenue is exponential growth in your KPI and business model validation via monetization experiments. Potential KPIs to select based on business model include, but are not limited to:
| Business | KPI Measurement |
|---|---|
| Personal app |
|
| Marketplace |
|
| Fintech |
|
| Enterprise SaaS |
|
| Internet of Things |
|
The KPI may change as the company evolves, and this is not only fine but can also give evidence of a healthy and dynamic company. Once this KPI is established and you have achieved buy-in of all team members, some of them may receive their own sub-KPIs that directly feed into it. A sub-KPI for the PR and Marketing team, for example, may be the total number of people who click through the articles to your site or app, which can be increased through the number of articles, average quality of articles, and strategies for distributing them.
2. Set a Growth Target and Measure Its Main Drivers
Once the defining KPI measurement has been selected, founders should drive its continuous growth using the various levers available. Top-line growth metrics can be broken down into underlying drivers that can be experimented with to bring in more users and maximize the engagement and value of those already in place.
Step 1: Breaking Down Growth Metrics into User Cohorts
Firstly, growth metrics must be broken down into user cohorts to assess retention over time, which will determine the true value of the users and how dependent the company is on constantly bringing in new ones. The profiles of those users who are most engaging with the product can then be determined from the data as well as the key differentiating factors for the strongest vs. weakest cohorts so that the company can better focus its efforts and messaging.
Step 2: Finding the Core Action Most Correlated with Engagement
Somewhat analogous to statistically profiling the best users and cohorts is then finding the core action that is most correlated with long-term user engagement and the sequence of events that most often lead to this core action’s completion. This information then allows for implementing more rigorous statistical testing of the magnitude and durability of the effects of the company’s various growth efforts. I have witnessed the analysis of the above factors completely revamp companies’ understanding of who their clients are, how they are engaging, and how to best drive their growth and product vision.
Primary Sources of Growth
Growth occurs from three main sources, discussed below in descending order of their impact on company value.
| Paid PR and Marketing Efforts |
|
|---|---|
| Organic External |
|
| Referrals from Existing Users |
|
In practice, any given user or strategy may blend more than one driver. Startups often offer incentives to clients to refer other clients, which can be a powerful strategy so long as the company targets those clients who are most likely to remain engaged. Paypal offers a famous example of using a referral program as a growth catalyst:
In contrast, eCommerce companies can risk extreme and broad-based discounts on products that essentially purchase users without necessarily validating any hypotheses or setting the stage for sustainable engagement. Be clear on the profile you are targeting and model out the sustainability of the strategy.
All else equal, incentives based on offering more of a premium version of your product are preferable to cash rewards or discounts as they bring increased engagement from the user and tend to be more affordable (assuming reasonable marginal cost of the additional service).
Study your growth data points meticulously. Many startups, for example, host and participate in events to drive interest among target clients—hackathons and meetups, commercial or industry conferences, and social or networking outings. Beyond tracking the conversion rate of those who directly participated in these events, analyzing subsequent user growth in the event’s geography and target profile can provide critical insight. Any causality must be taken with skepticism, but, for example, if I become a user and then shortly thereafter other people “close” to me become users in the absence of other developments, this may signal enough information to run an experiment.
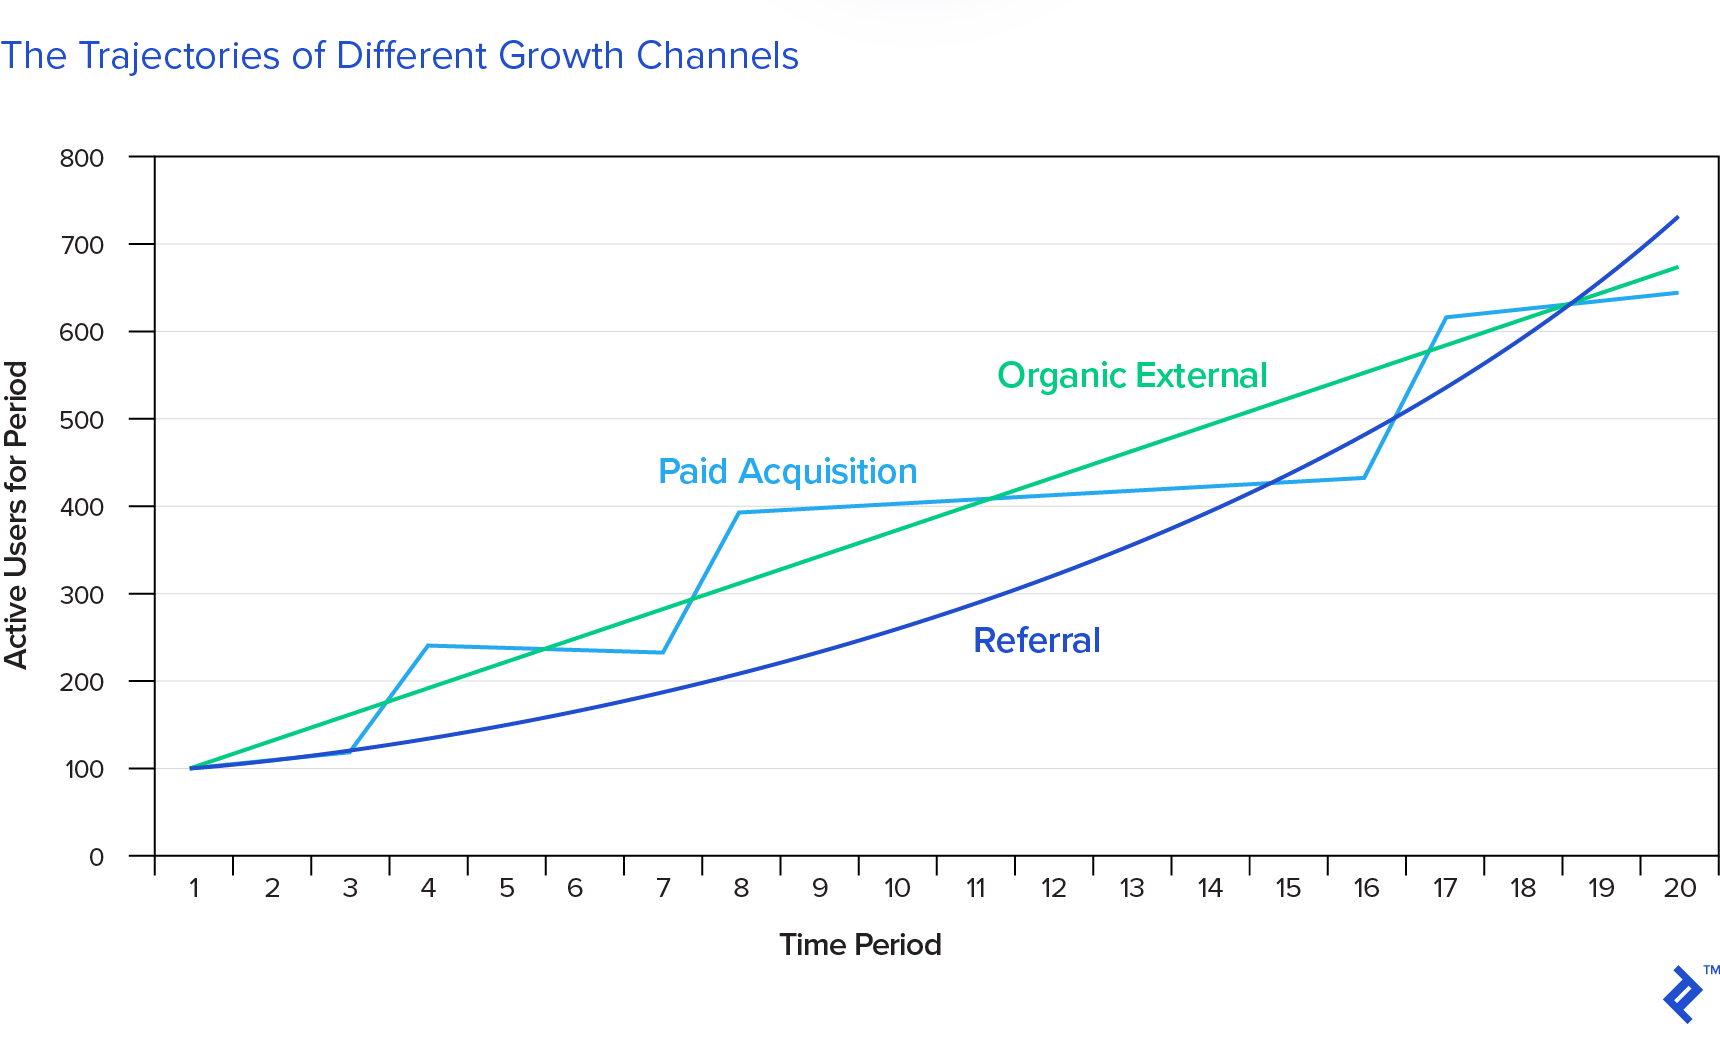
The three growth drivers described in the table above often take different trajectories that can be analytically differentiated. “Paid users” from specific articles or other singular events tend to show an irregular trajectory characterized by spikes (and, unfortunately, often reversals), organic external users tend to show smooth though linear growth, and finally, a healthy referral dynamic shows a curve:
As more data becomes available, more advanced techniques for breaking down your growth into these key drivers include:
- Structural break tests (sudden change in the nature of your growth) such as the Chow Test
- Viral coefficients which show on average how many new customers each current customer is bringing to the business.
- The second derivatives of your growth trajectory. The first derivative is the rate of growth itself and the second is the rate of change in your growth, so a positive second derivative suggests your current users are populating the world with more users through the natural course of their day.
3. Measure Retention Across Cohorts and Compare to Relevant Benchmarks
Once you are clear on the driving KPI for company value, it is time to delve into how your user or client behavior is driving its growth. Considering this in terms of cohorts is important for gleaning your growth’s true sustainability in that it forces you to consider not only how many active users you have today but how those who previously joined are still performing.
Based on scope and frequency of available data, divide your users into cohorts based on a reasonable time interval such as weeks or months. As previously noted, a simple frequency analysis can help to determine the proper time interval:
- Sort the data by user and action timestamp.
- Take the difference for each unique user between the actions executed, expressed in minutes or days.
- Create a histogram of the results and select the period where data are most clustered.
If the usage is very high frequency, then you may wish to simply use weekly cohorts. If it is lower frequency—for example, every ten days or every month, then set the cohort intervals based on this. Means of visualizing this retention over time then include:
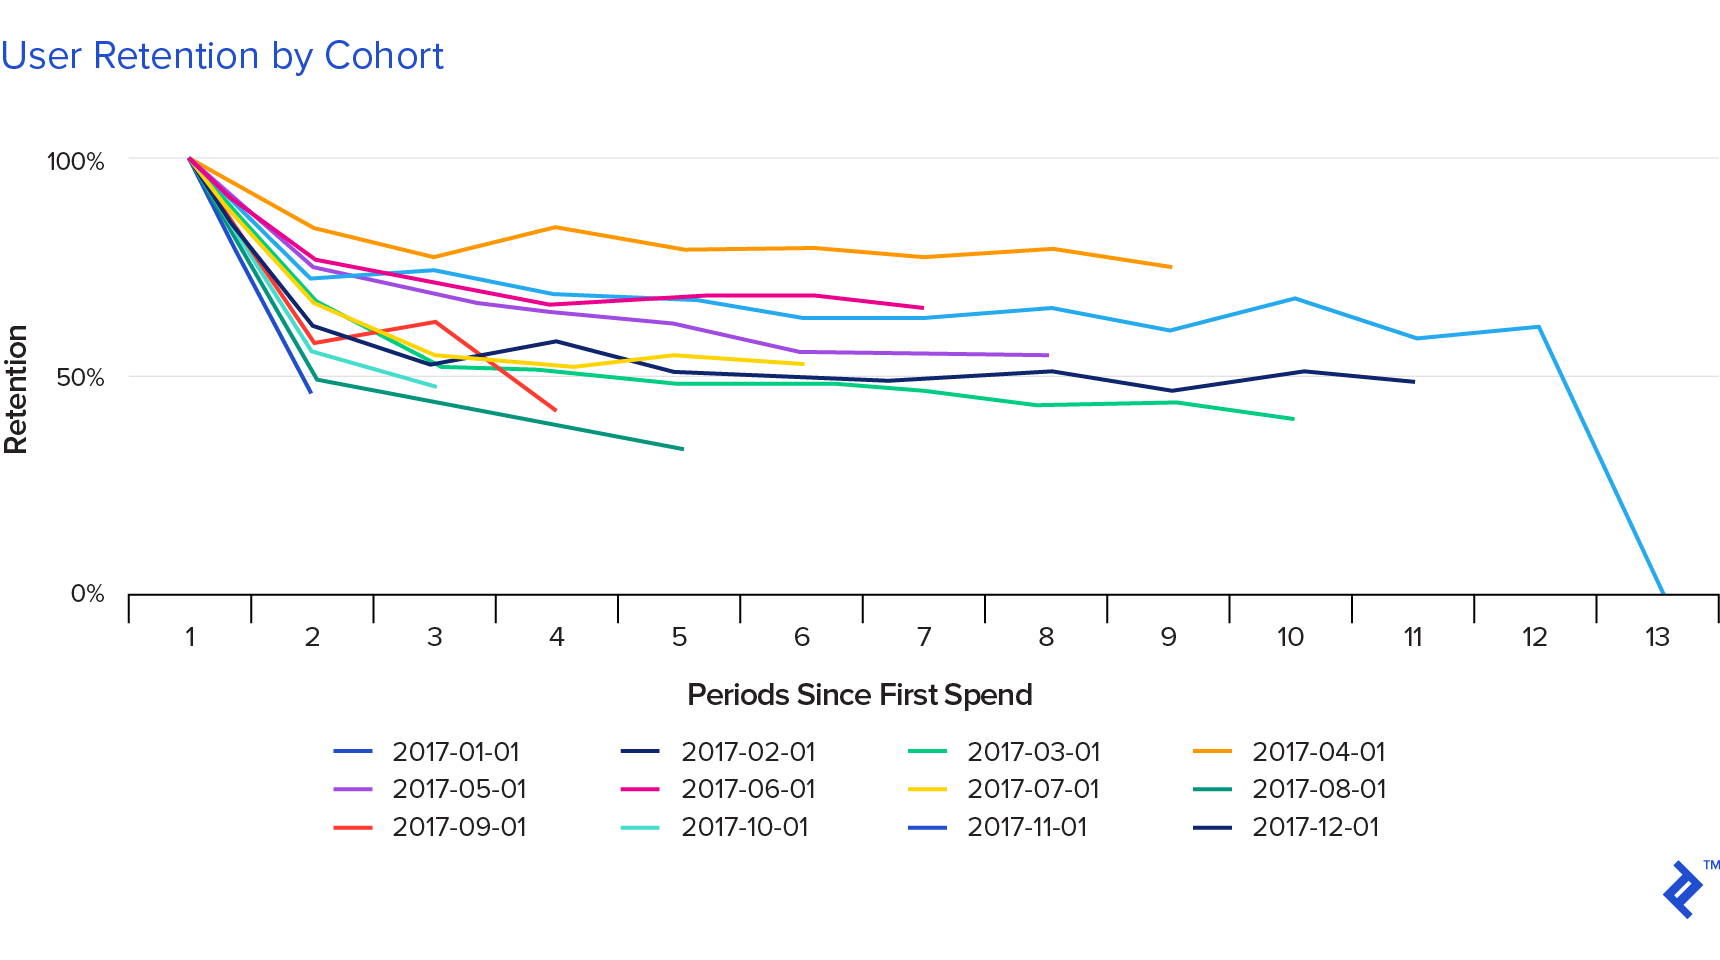
- The standard cohort graph, which shows the ongoing number of active users over time for each respective cohort:

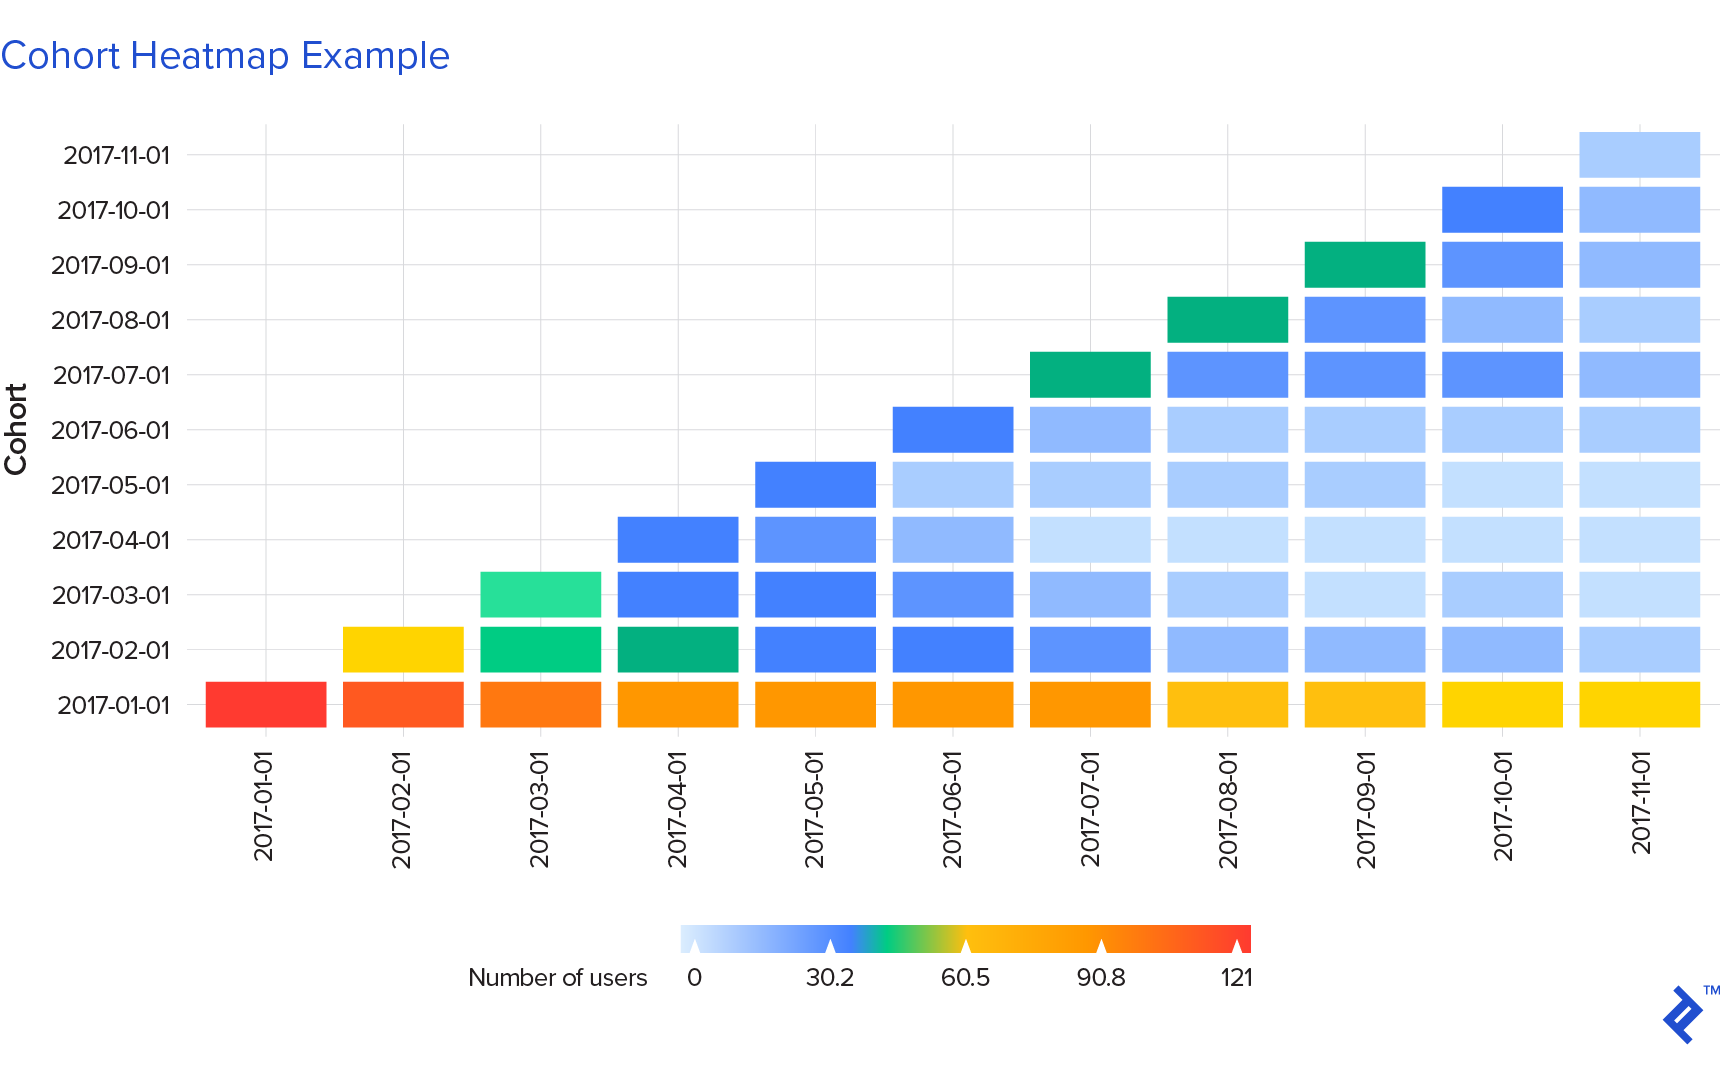
- The “heat map,” which shows how many original users for each cohort remain engaged over time:
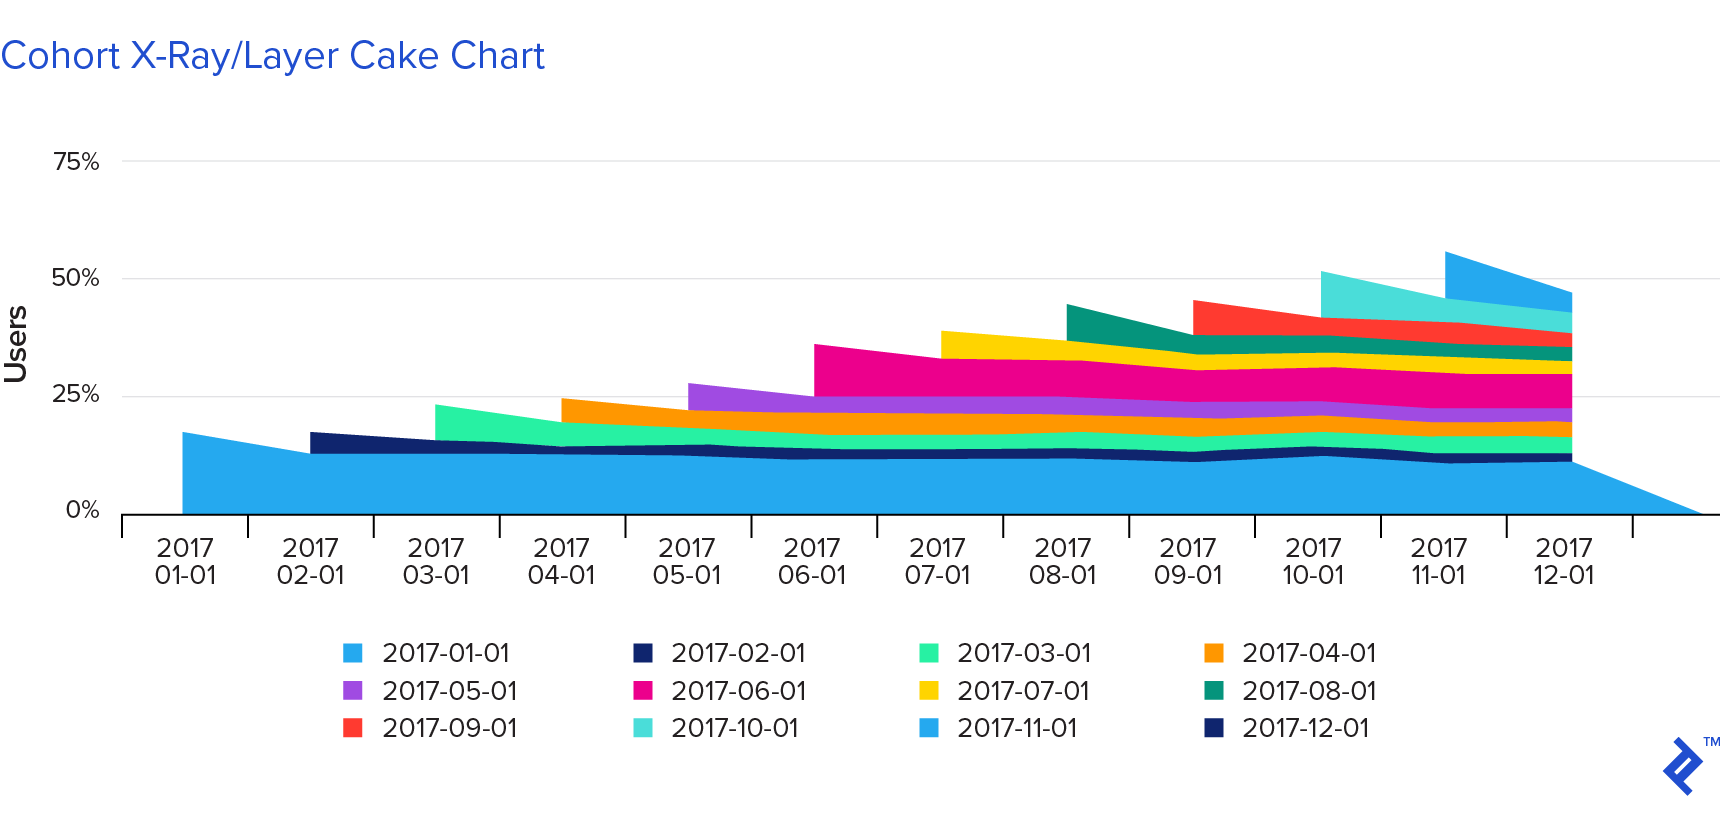
- The “layer cake,” or X-ray graph, which shows the successive cohorts building upon each other over time to reach total active users:
Average retention can then be compared to benchmarks for the company’s sector, which can be found, for example, at Anu Hariharan’s Y Combinator post. How the company compares to these numbers indicates how it is doing versus its potential competitors both for users and for the next capital raise. This work can bring some tough love, and founders should not feel discouraged if retention below the benchmark is discovered. This analysis is so valuable in the first place precisely because retention so often presents the main challenge to early stage companies, and the subsequent sections will discuss ways to hone in on what is working.
4. Identify the Defining Characteristics of Best Clients and Cohorts
The data collected on your users can be deployed to analyze the characteristics that are most correlated with engagement, both on the individual and the cohort basis. Entire cohorts might have their own specific characteristics due to factors such as:
- Evolution of the product over time as the new users receive different experiences
- External seasonal effects such as those activating during the holiday season
- Company-specific efforts such as a specific promotion or marketing campaign
The type of analysis for both individual users and cohorts is very similar in terms of functional form, with the main difference residing in the definition of the inputs.
Linear Regression
Best user profiles can be calculated using a linear regression if data permits, and such a model would return the expected level of engagement or lifetime value based on the user characteristics. The dependent variable is a measure of the strength of engagement or retention, and the independent variables are then the factors available from the data collected on the users both from their profiles and their behavior. Example variables for conducting a test on individuals users might include:
| Dependant Variable |
|
|---|---|
| Personal or corporate profile |
|
| Activity |
|
Probit Model
An alternative specification would be a probit model, which returns the probability of something based on independent variables. This particular functional form can then give the probability of churn for a given user. However, in most scenarios, a linear regression should be the default option, unless you have a specific reason why another form is preferible. Having an overly-advanced specification can either cloud the finding or risk mistaking the model for the real world. Keep it simple and save your energy for interpreting and acting upon the results.
Cohorts Have Different Behavior Points
Cohorts tend to have three key moments of user actions:
- An initial plummet in which many initial users or clients drop off.
- A subsequent decay curve based on further churn.
- Then (hopefully), a linear portion in which the cohort stabilizes into those users who are in for the long haul. The linear portion may of course still show a trend, but it has stabilized into gradual linear change rather than exponential decay.
The three respective areas are shown in different colors below:
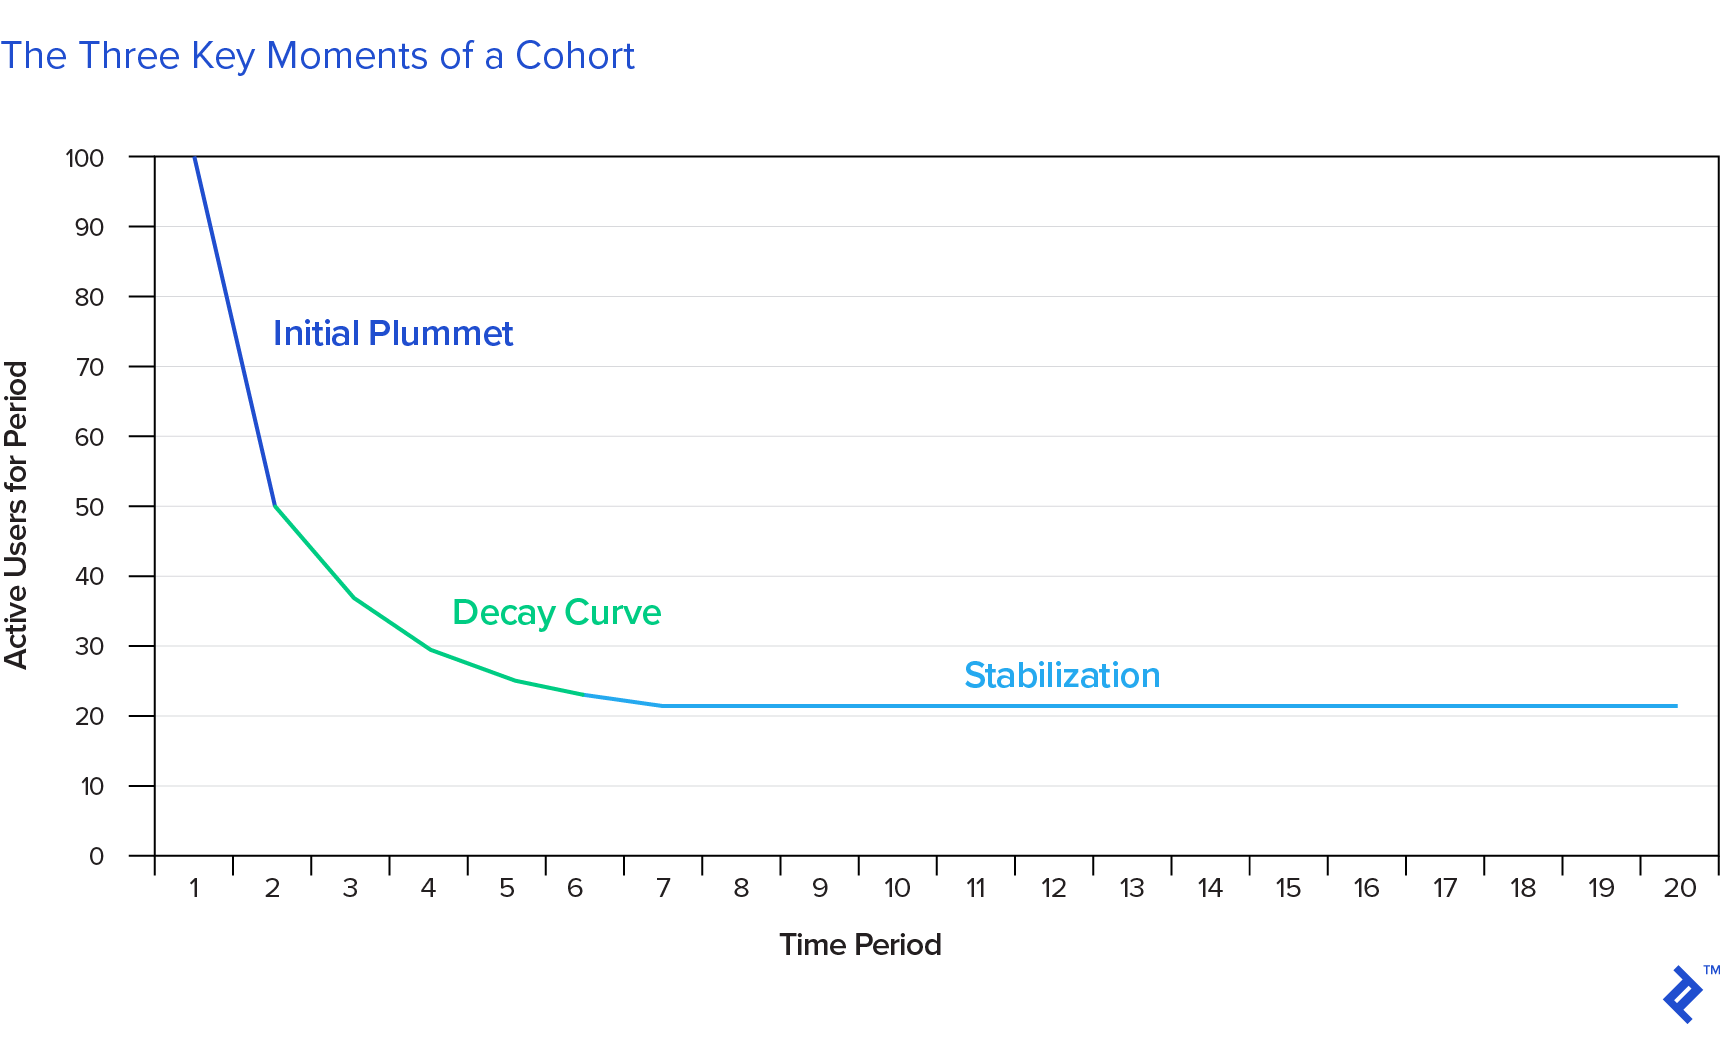
With low data availability, the three areas can be eyeballed, and with more data, the moment at which the cohort passes from exponential decay to linear stability can be tested using the same Chow structural break test previously discussed. The initial plummet in blue is arguably part of the subsequent downwards curve showed in green, but can be useful to consider separately as it may carry different interpretation. The signals from the three areas may be simplistically conceptualized as:
| Initial plummet |
|
|---|---|
| Downwards curve |
|
| Stabilization level |
|
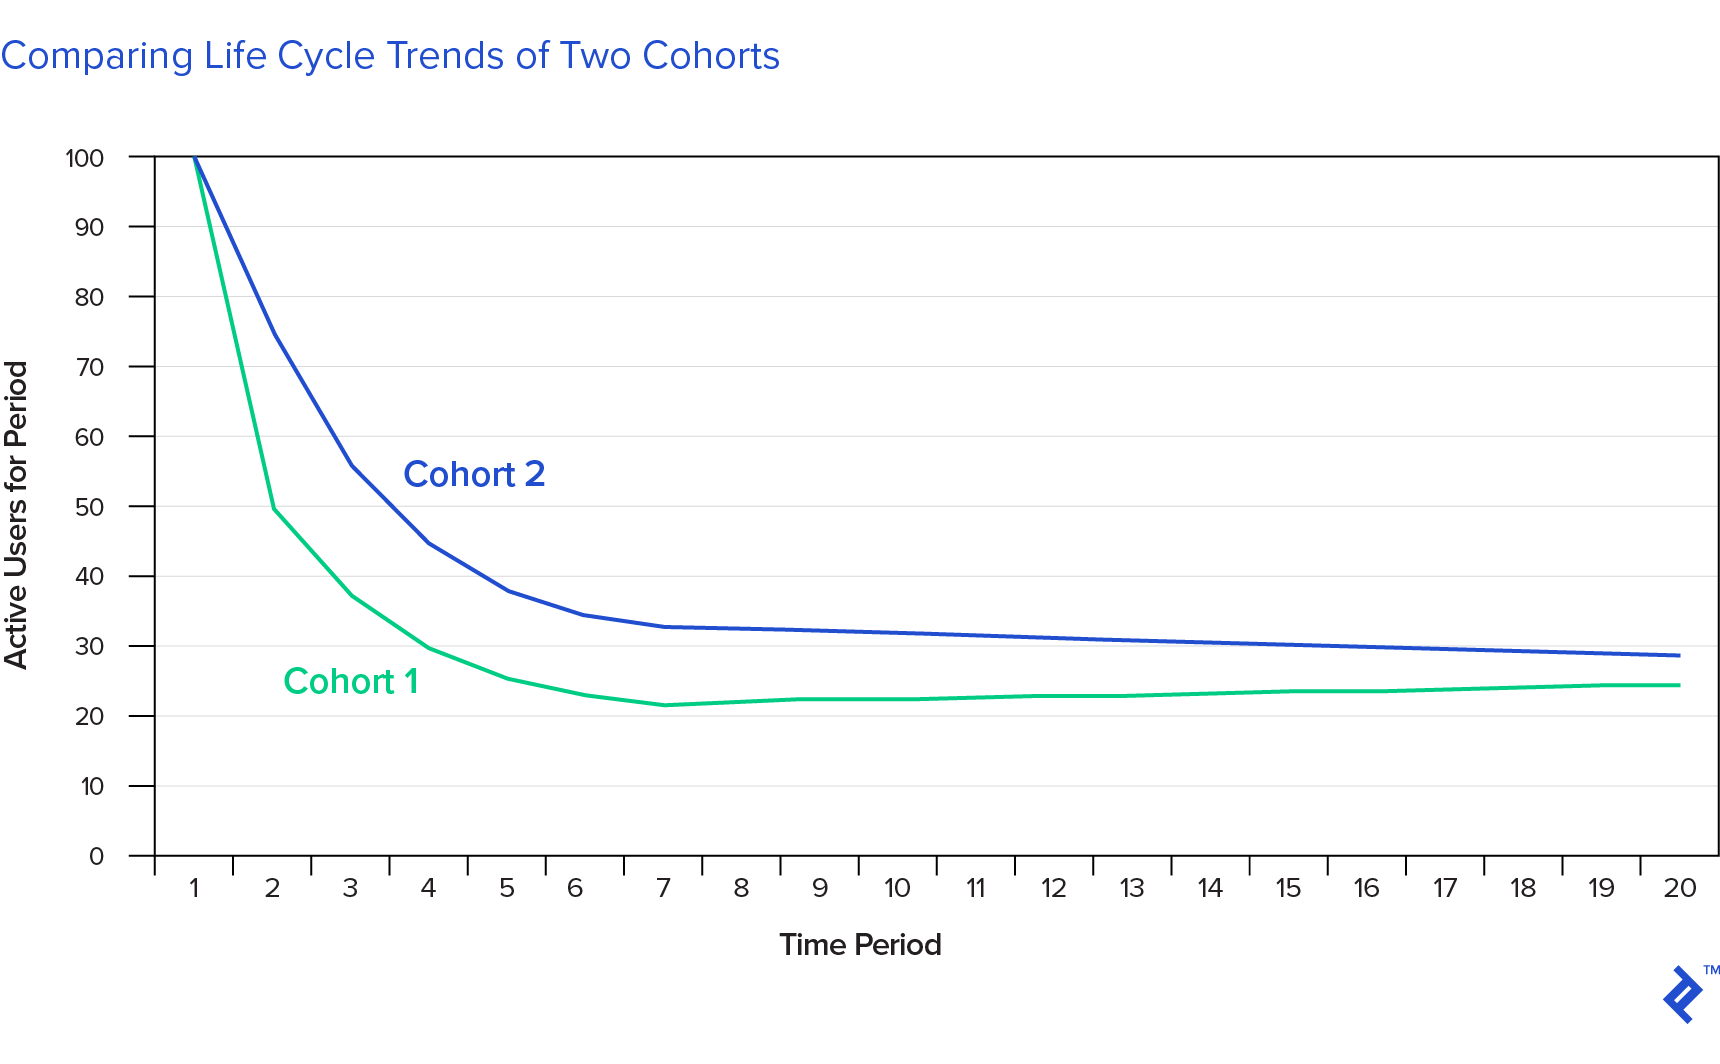
Companies define their best cohort based on size (how many users), trajectory (how quickly users drop off from the cohort over time), and level at which the engagement stabilizes (% of users in for the long haul). The latter two are arguably two sides of the same variable. As with anything with early-stage startup metrics, trajectory should carry the most weight. Of the two cohorts below, Cohort 1 is stronger. It may plummet more and even first stabilize at a lower level, but it then shows a linear trend towards users reactivating while the blue cohort continues to decrease.
Reach out to those users who dropped off to see what you can do to reactivate them or at least to learn from them. Those people on the borderline of using your product but ultimately elected not to represent one of the richest pools of potential information as well as the lowest-hanging fruit for further growth.
5. Identify the Core Action Most Associated with Retention and Engagement
Once you identify your most engaged clients, you will want to learn how they become most engaged. The central step is to identify the core action that is most associated with long-term engagement. Think of this action as the tipping point at which you’ve hooked the client, and analysis of the flow of actions taken may reveal a moment of disproportionate expected engagement and retention. For a marketplace platform, it may be successfully realizing the first three sales. It’s the user’s “ah ha” moment—the “Wow, this thing actually works” moment. Find it.
Once the core action is identified, the logical next question is how to get users to it as quickly and surely as possible. The next step in the analysis is therefore to identify the sequence of events that are most likely to lead to the core action being taken and use this to refine your product UX to bring the user through them as seamlessly as possible. Eliminate as many requisite steps as possible; creating beautiful UX is like sifting for gold and represents a process of reduction and distillation rather than addition.
Think in Logarithms over Percentages
Whenever possible, define your variables in terms of change rather than absolute state. For any company, but for startup metrics especially, the rate of change is what defines your valuation and competitive advantage. When calculating change, use natural logarithmic change rather than percent change. Percents do not fit well into statistical analysis due to their lopsidedness; for example, if your active users increase 10% from 100 to 110 but then decrease 10%, you’re down to 99. Natural logs do however have this symmetry, are just as easy to calculate as percents, and can be converted into percents for final interpretation using a simple transformation formula as well.
The analyses described through this point are historical, but will allow for more granular prediction of future growth based on underlying drivers, which are useful for founders to track their likelihood of hitting internal targets or benchmarks for their next funding round, and for investors for estimating a company’s trajectory. As discussed in the next and final section, it also sets the stage for results-driven experimentation for product evolution and startup growth strategies.

Section 6. Measure the Impact of Actions on Sustainable Growth
With this understanding of the forces that have shaped your growth thus far, you can run experiments on how to strengthen them in sustainable ways via product updates, marketing and PR, and business development. Using your historical growth metrics and engagement levels as baselines, the true impact of your various efforts can be assessed. This is where creativity truly comes into play, but creativity rooted in empirical validation.
A baseline is used to indicate what your growth would have otherwise been without the action taken. A simple baseline could be historical growth, and more advanced ones could use the aforementioned underlying drivers to predict a baseline future growth. Under some circumstances, the baseline could even be the reactions from prior similar events. With the baseline at hand, the following steps would involve statistical analyses of the data to ascertain what growth was attributed to the actions taken (i.e., in line with historic changes) and what was “abnormal.”
Above all, these tests should establish the learning process by which the company and product become smarter and stronger with every single user action. Your product and business model as they exist at any given moment can be copied; but processes and moving targets represent far more sustainable competitive advantages. Use these experiments and feedback loops to make your product a living thing that constantly grows more sophisticated. Likewise, the most valuable commodity in the world is information, both to you and to your current and future clients.
The insights you glean into what drives growth and engagement of your users and clients may itself become the product that you eventually sell; the most valuable tech companies almost all evolved at some point from being valued based on their client growth to being valued based on the information they create. Effective understanding of startup metrics is the first step to take in this journey.
Understanding the basics
What is a metric in business?
A metric is a quantifiable target measure set by a business in order to track its performance. Success is judged on how metrics perform, compared to benchmarks and projections.
What is a growth metric?
A growth metric is a target that specifically focuses on the underlying growth of a business, as opposed to say, financial stability or efficiency. Growth metrics can be revenue, active users or average customer spend
Why are key performance indicators important?
KPIs are tangible benchmarks that can allow for appraisal of both the business and staff within it. Having KPI targets also provides a goal for the company to work towards and galvanize actions.
Erik Stettler
New York, NY, United States
Member since November 21, 2017
About the author
Erik’s a VC GP who has invested into over 50 tech companies and realized notable exits, two of which were sales to Box and Twilio.
Expertise
PREVIOUSLY AT