
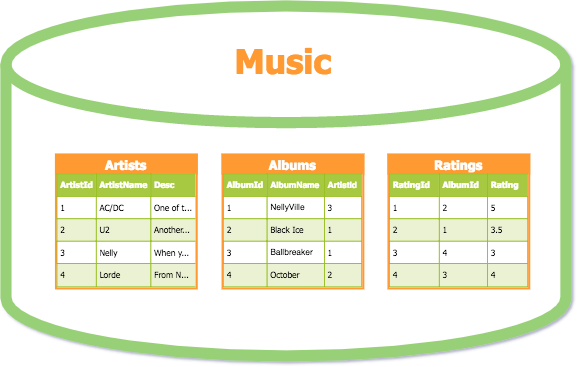
An example of database tables, structuring music by artists, albums, and ratings dimensions
Source: database.guide
For the most part, businesses use databases to record transactions. This is an operational need, as we have to save our sales results, customer information, etc. Later, this data can be- modified to maintain the relevance of what was stored;
- used by business applications to perform its functions, for example check product availability, etc.; and
- used for analytical purposes to understand how our business is running.
In this article, we’ll talk about such a solution — Online Analytical Processing or OLAP technology. We’ll cover the fundamentals of OLAP and see how it works in contrast to transactional databases. Namely, we’ll explain what functions it can perform, and how to use it for data analysis.
As the topic is closely related to business intelligence (BI) and data warehousing (DW), we suggest you to get familiar with general terms first.
A guide to business intelligence
An overview of data warehouse types
Extract, transform, load or ETL process guide
Optionally, you may study some basic terminology on data engineering or watch our short video on the topic.
What is data engineering
What is data pipeline

What is OLAP: Online Analytical Processing
Online Analytical Processing can be defined as a set of tools and approaches to represent data from multiple dimensions. In a broader sense, it includes a bunch of practices aimed at modeling data/databases and creating specific analytical solutions. OLAP systems are capable of combining classic tables in a sort of table of tables, which can be visualized as a 3D OLAP Cube for simplicity.A typical OLAP system will include the following components that perform dedicated functions to handle analytical queries.
Data source. This could be a transactional database or any other storage we take data from. The data in its standard format isn’t optimized for OLAP queries, so it requires transformation and remodeling before it can be used.
OLAP database is where we store data for analysis. Usually, transformation takes place before the data is uploaded to a database, but the approach may vary.
OLAP cube is basically a tool for representing multidimensional data for analysis. As we’re talking about online analytical processing, cubes are deployed on a dedicated server.

Analytical interface. The interactions with cubes and other analytical tools for data visualization and reporting is done via a dedicated interface. The majority of interfaces are represented by business intelligence dashboards. Cubes can be accessed via these dashboards, providing more control to a user.
The easiest way to understand how OLAP works is to compare OLAP and OLTP databases and explore how they structure and process data.
OLTP vs OLAP: technology comparison
There are numerous differences between OLTP and OLAP databases in terms of purpose, information structure, and data access capabilities. The table below compares the main aspects of these two systems.
A comparison chart of OLTP and OLAP database features
Now, we’ll look in more detail at how both types can be used, what operations they run, and how the data is structured for OLTP and OLAP purposes.Data operations in OLTP
A transactional or OLTP database is a common storage solution we deal with to record any business information. Say, we’re selling a new type of a smartphone to the customer and we want to record this transaction, including the product type, price, date, customer info, sales person name, etc. All of these items will be stored in a flat view, which allows us to quickly operate and search for the required information.The data will be saved as a set of items and values that relate to this transaction. An OLTP solution will allow a user to perform the following operations with this data:
- insert,
- copy,
- paste,
- edit/update, and
- delete.
Analytical requests are often much more complex than “show me total sales amount.” More often than not, we need to compare things to each other and look at the data from different dimensions. That’s where an OLAP technology kicks in.
Data operations in OLAP
OLAP or Online Analytical Processing aggregates transactional data from a storage to transform it into a feasible form for analysis. As a source of data, OLAP can use some type of unified storage like a data warehouse, data lake, or data mart, or simply any place you store the historical data.But to run complex custom queries, we must structure data properly. That’s why in most cases, there is a need for a separate OLAP database or warehouse that will model data for multidimensional analysis.
The query in OLAP may look something like this:
- “show 64GB smartphone sales in Winnipeg for the last 6 month,”
- “compare 64GB model sales across Canada to 256GB in the 4thQ,”
- “group all 64GB model returns for the 2021 sold by John Doe salesperson,” and
- “show average margin for a given smartphone vendor for this year.”
OLAP models a database in such a way that it becomes possible to quickly gather the data and present it to analysts in a multidimensional mode rather than a flat table. That’s why OLTP and OLAP databases will differ in numerous ways.
Now, we have to answer two simple questions. How is OLAP data modeling different from transactional databases? And why can’t we run such complex queries in OLTP?
Data modeling in OLTP
Traditional databases (OLTP) use a relational data model, hence the name “relational database.” The relations are nothing but tables of values. Each row in the table denotes a real-world relation of an item to its attribute. For example, a customer may have related attributes such as address, email, credit card, name, etc.
Relational data model example
Source: comparitech.com
This is the most standard way we store data and make modifications to transactional information. Such an approach works great for simple queries to modify transactional data. But if we need to query something like “compare sales of a given item in the 3rd quarter for the last three years in the US” — the relational database will require enormous resources because it will scan each table entirely to find all the related values.Moreover, the query will return disparate data items with a lot of unnecessary information, as the relational model doesn’t support filtering by multiple dimensions at once (product type, time period, location).
Data modeling in OLAP
In contrast, OLAP uses star and snowflake schemas for data modeling.In a star schema we structure data around facts, providing the keys to every dimension for measurement. A fact, in this case, is a category of related business items, e.g., product, sales amount, revenue, customers, time, location, etc. Each of these items is a separate dimension that includes subcategories. So we can divide, for example, time by year, quarter, month, week, and day.
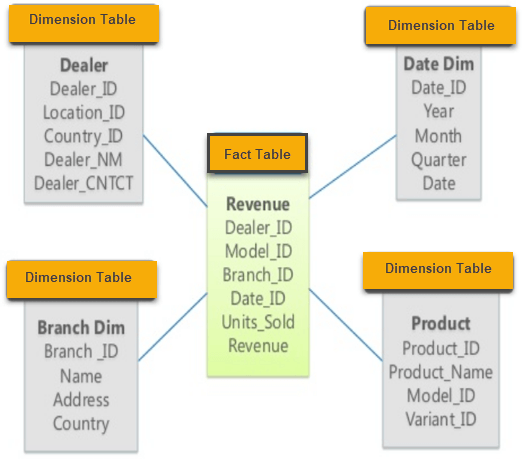
Star schema in OLAP
Source: www.guru99.com
A snowflake schema is an extension to a star schema: Basically, it adds more dimensions to the existing ones. But data is still organized around factual tables. So if we add more dimension tables, the database starts to take a “snowflake shape.”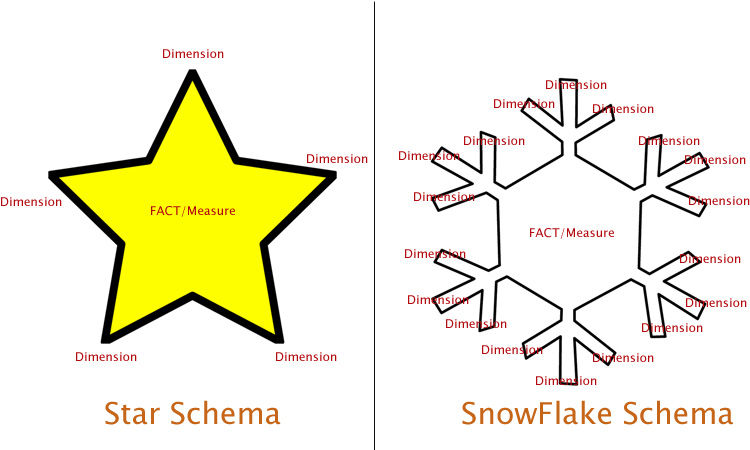
A snowflake schema extends the star schema with more dimensions
Source: www.learnmsbitutorials.net
A multidimensional model of data is what makes it possible for OLAP systems to extract the required information, perform complex filtering, and allow for analysis of this data.Online Analytical Processing Architecture
When we talk about analytics, we generally mean business intelligence systems, where a data warehouse is a central point uniting all the corporate data. A data warehouse can be used differently depending on the goals of the organization.- A corporate DW can be used as a unified storage for historical data, optimized for transaction or simple analytical tasks.
- Or it can be optimized for OLAP queries applying star or snowflake schemas.

BI system architecture with OLAP layer
So let’s analyze OLAP workflow in such architecture.Data extraction. First, the data is extracted from its original sources and uploaded to a unified data storage. In the case of BI, a data warehouse will be the place we upload data to.
Data preparation. Once we’ve got the data, it requires optimization and modeling for multidimensional analysis. In some cases, corporate DW can be optimized to run OLAP queries, but a more typical case is to use a separate OLAP database. Here are a few reasons why.
- Running analytical and transactional queries on separate databases eliminates the risk of overloads and database downtimes, while guaranteeing decent performance of the two.
- Applying data models is easier when we use a storage for a single purpose.
Building a cube. Once the data is prepared, a group of responsible data engineers will model cubes and deploy them on the dedicated server. Creating a cube is a custom process each time, because data can’t be updated once it was modeled in a cube. So, for each specific query, a new cube will be created.
Accessing data. As an end point in the system, OLAP cubes will be accessed through analytical interfaces. Here, analytics can type in commands and perform cube-specific operations to analyze data.
Now, let’s look at the cubes themselves and define the capabilities they give to the analyst.
How OLAP cubes work
The cube may consist of several dimensions that can be used to filter the required information and form reports. OLAP systems use a specific SQL language called MDX or Multidimensional Expressions. Standard SQL queries are also supported by the most databases to perform OLAP analysis.There are five basic types of OLAP multidimensional analysis operations.
Drill down allows a user to move from high-level data (e.g., annual sales) to a lower level (e.g., monthly sales). Here we use the concept of hierarchy that applies to every single dimension. So, in the “time” dimension, we can move down from yearly figures to weekly or even daily records. This depends on how you store your data and model the actual cube.
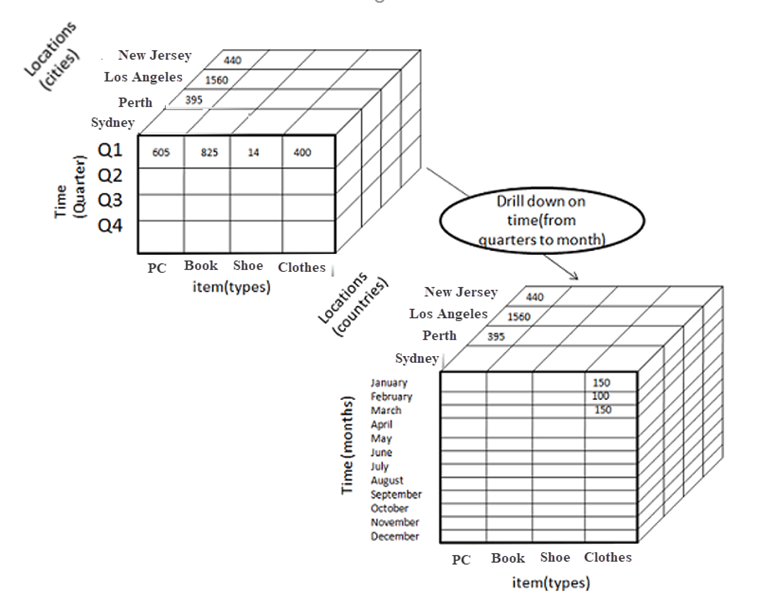
Drill down into the time dimension
Source: www.guru99.com
Roll up is the opposite of drill down, as it basically lifts the data in hierarchy levels. Both operations either make the data more or less detailed, or add/remove dimensions for the analysis.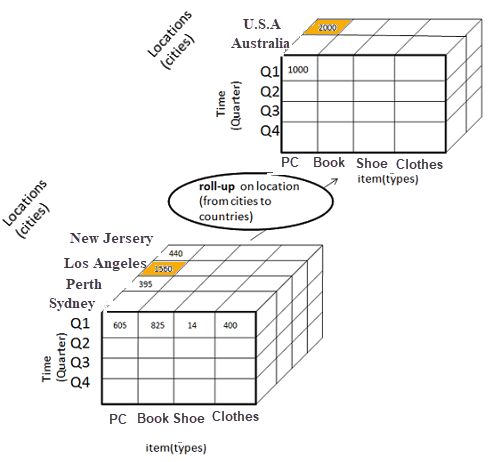
Roll up the location dimension
Source: www.guru99.com
Slice operations help you divide a certain dimension into a separate table (one-dimension view). “Slice” can detach, say, the city's dimension from the rest of the cube, which will create a separate spreadsheet. This way we can analyze low-level information in the isolated environment.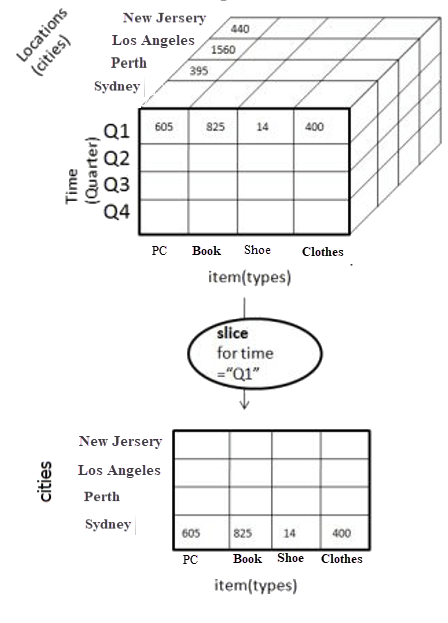
Slicing a location dimension in a hierarchy level of cities
Source: www.guru99.com
Dice provides the same separation functionality, but allows you to choose more than one dimension, producing a separate cube.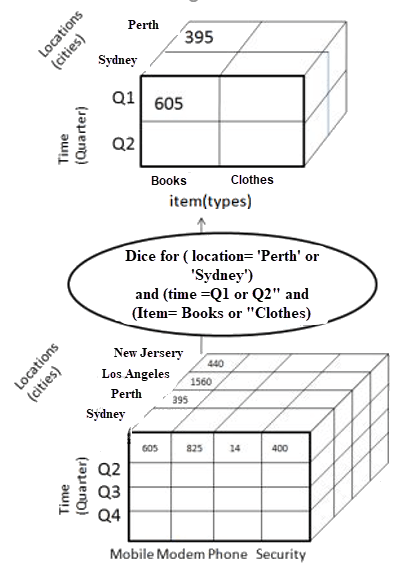
A dice operation with the choice of time and location dimensions
Source: www.guru99.com
Pivot is a similar operation to create pivot tables in Excel. This function allows us to rotate a cube to get a different representation of data in between the dimensions.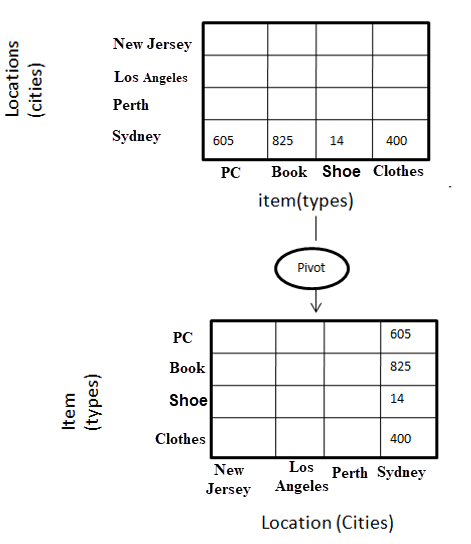
Pivot example on a single dimension of the cube
Source: www.guru99.com
All in all, the functions can be used in conjunction, which gives huge flexibility to use a single cube for multiple purposes. But, as we mentioned before, each time there is a modification to data, the cube will require reuploading the information or remodeling the existing OLAP DB.OLAP providers
OLAP is a vital part of any BI system. Despite its resource-intensive nature, OLAP remains a standard solution for complex analytics that can’t be done in the usual databases. As the technology appeared in the early ‘90s, the market of solutions is quite large. And the main proposal comes from data warehouse/business intelligence providers.Nearly any provider these days supports all of the basic functions of OLAP and allows the creation of multidimensional cube systems as a part of their BI platform. Now, let’s look at some popular products that can be used as a separate OLAP tool.
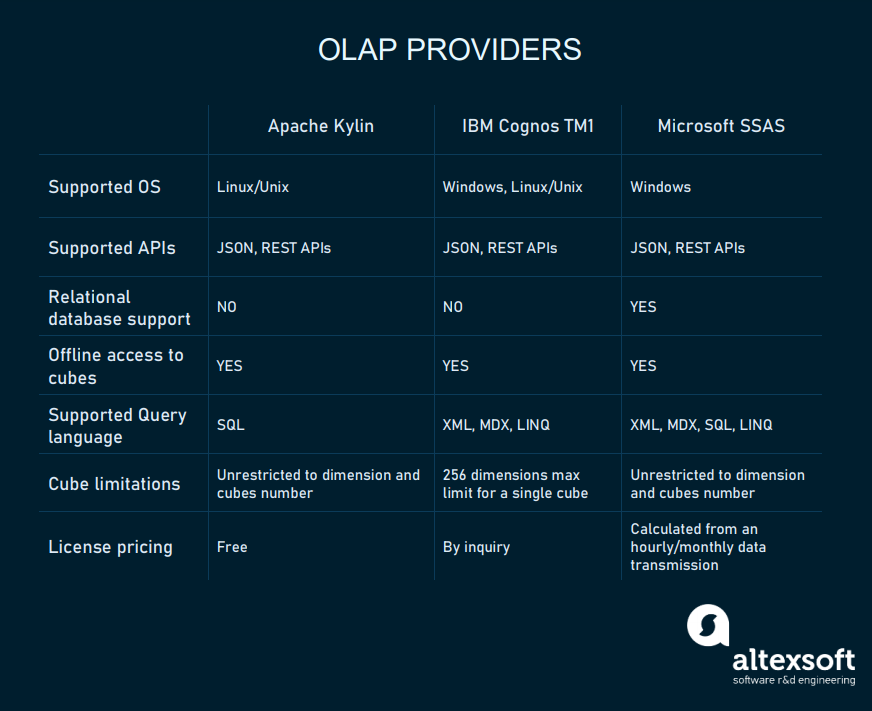
OLAP providers chart
Apache Kylin is an open-source distributed data warehouse for big data and OLAP. Kylin was developed for internal analytics on Ebay. Since 2014, it has gone open source and is distributed by a free license. While it focuses on analyzing big data, Kylin can also be used for corporate warehouses of medium size. Plus, Kylin integrates with the popular BI interfaces such as Tableau, Superset, Qlik, and Zeppelin.Microsoft SQL Server Analysis Services (SSAS). As a part of its Azure Cloud Platform and PowerBI analytical solutions, Microsoft offers a separate product for OLAP. Currently, they call it Azure Analysis Services.Basically, it’s an OLAP modeling and processing tool integrated with PowerBI. The pricing is calculated like all the Azure products, based on computation resources. You can check pricing on the corresponding page.
IBM Cognos TM1 is another platform that consists of multiple tools for data analysis, cube modeling, and data visualization. As with Microsoft, TM1 includes a broad range of Watson Analytics products and a dedicated analytical server. The pricing for TM1 can be gotten from IBM on their price planning page.
But while software vendors offer tools for data modeling and analysis, you’ll still need data engineers/data analysts to model and analyze the information. In other words, OLAP falls into a category of specific analytical tools that require data engineering or BI development expertise to work with. In this case, you may think of hiring a data specialists team to handle a custom project for your corporate needs.
The rise of column databases or a new OLAP
Currently, OLAP remains quite a cumbersome technology, because it requires modeling a separate database to build cubes. And the more data you need for analysis, the more likely you’ll need a data warehouse only for OLAP needs. But things may change with the emergence of column databases.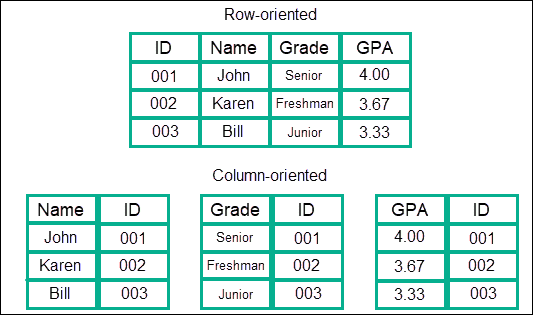
A comparison of a relational DB row-table, and a column-table.
Source: www.kdnuggets.com
As you might remember, a traditional relational database stores values in rows, while columns denote categories of items. A column database is a type of schema that uses columns to organize tables in DB. As simple as that, this type of schema provides capabilities similar to what an OLAP database does. Each table will represent a dimension that can be quickly scanned and analyzed.Column databases can potentially be used as a data warehouse capable of handling OLAP queries by nature. While this approach was described way back in 2012 in different studies, it gained popularity only a few years ago. So this led to the emergence of column-oriented cloud data warehouses.
- AWS Redshift offers columnar storage as an option for high-volume analytical queries. The concept of a column database in Redshift is described on a dedicated page.
- Apache Kudu is an analytical data store that relates to the Apache Hadoop Kudu is an open-source solution designed specifically for analyzing dynamically changing data.
- MariaDB ColumnStore is a distributed data storage solution based on the MariaDB Enterprise server.
- Google Cloud Bigtable is a part of the Google Cloud ecosystem designed for large volume data analysis, big data, and streaming analytics.
- Azure Synapse Analytics connects a range of services for data warehousing, data integration (ETL), and big data analytics.
But there is a drawback to keep in mind. In case you’ll have to run a massive update of your data, a column database will need to read every single row one by one. The process of updating currently remains much more time-consuming and complex for column databases than it is for traditional SQL databases.
What does it mean in the context of analytics? Historical data often doesn’t require any updates, so if you're analyzing large amounts of transactional data from the past, the updating issue is not really valid. But in case you're trying to analyze dynamically updating data, a traditional SQL database remains the best choice.