

HFC Network
Testing Bandwidth Usage of Popular Video Conferencing Applications

This year we have seen a shift toward working and learning from home and relying more on our broadband connection. Specifically, most of us use video conferencing for work, school and everyday communications. With that in mind, we looked at how much video conferencing a broadband connection can support.
In the U.S., the Federal Communications Commission (FCC) defines broadband to be a minimum of 25 Mbps downstream and 3 Mbps upstream. So, we started there. The investigation looked at how many simultaneous conferencing sessions can be supported on the access network using popular software including Google Meet, GoToMeeting, and Zoom. The data gathering used typical settings and looked at both upstream and downstream bandwidth usage from and to laptops connected by ethernet cable to a modem connected to a wired broadband connection. To avoid any appearance of endorsement of a particular conferencing application, we have not labeled the figures below with the specific apps under test.
Since this is CableLabs, we used DOCSIS® cable broadband technology. A Technicolor TC8305c gateway was used, which is a DOCSIS 3.0 modem supporting 8 downstream channels and 4 upstream channels. Note that this modem is several years old and not the current DOCSIS 3.1 technology. The modem was connected through the cable access network to a CommScope E6000 cable modem termination system (CMTS).
Laptops used ethernet wired connections to the modem to ensure no variables outside the control of the service provider would impact the speeds delivered, and conferences were set up and parameters varied while traffic flow rates were collected over time. Various laptops were used, running Windows, MacOS and Ubuntu – nothing special, just laptops that were around the lab and available for use.
Most broadband providers over-provision the broadband speeds delivered to customers’ homes – this is for assorted reasons including considering protocol overhead and ensuring headroom in the system to handle unexpected loads. For this testing, the 25/3 service was over-provisioned by 25%, a typical configuration for this service tier.
At a high level, we found that all three conferencing solutions could support at least five concurrent sessions on five separate laptops connected to the same cable modem with the above 25/3 broadband service and with all sessions in gallery view. The quality of all five sessions was good and consistent throughout, with no jitter, choppiness, artifacts, or other defects noticed during the sessions.
This research doesn’t take into account the potential external factors that can affect Internet performance in the home, from the placement of Wi-Fi routers, to building materials, to Wi-Fi interference, to the age and condition of the user’s connected devices, but it does provide a helpful illustration of the baseline capabilities of 25/3 broadband.
The data is presented below where samples were collected every 200 milliseconds using tshark (the Wireshark network analyzer).
Conferencing Application: A
The chart below (Figure 1) shows access network usage for the five concurrent sessions over 300 seconds (five minutes) for one of the above conferencing applications. The blue line is the total downstream usage, and the orange line is total upstream usage. Note that the upstream usage stays below 2 Mbps over the five minutes.
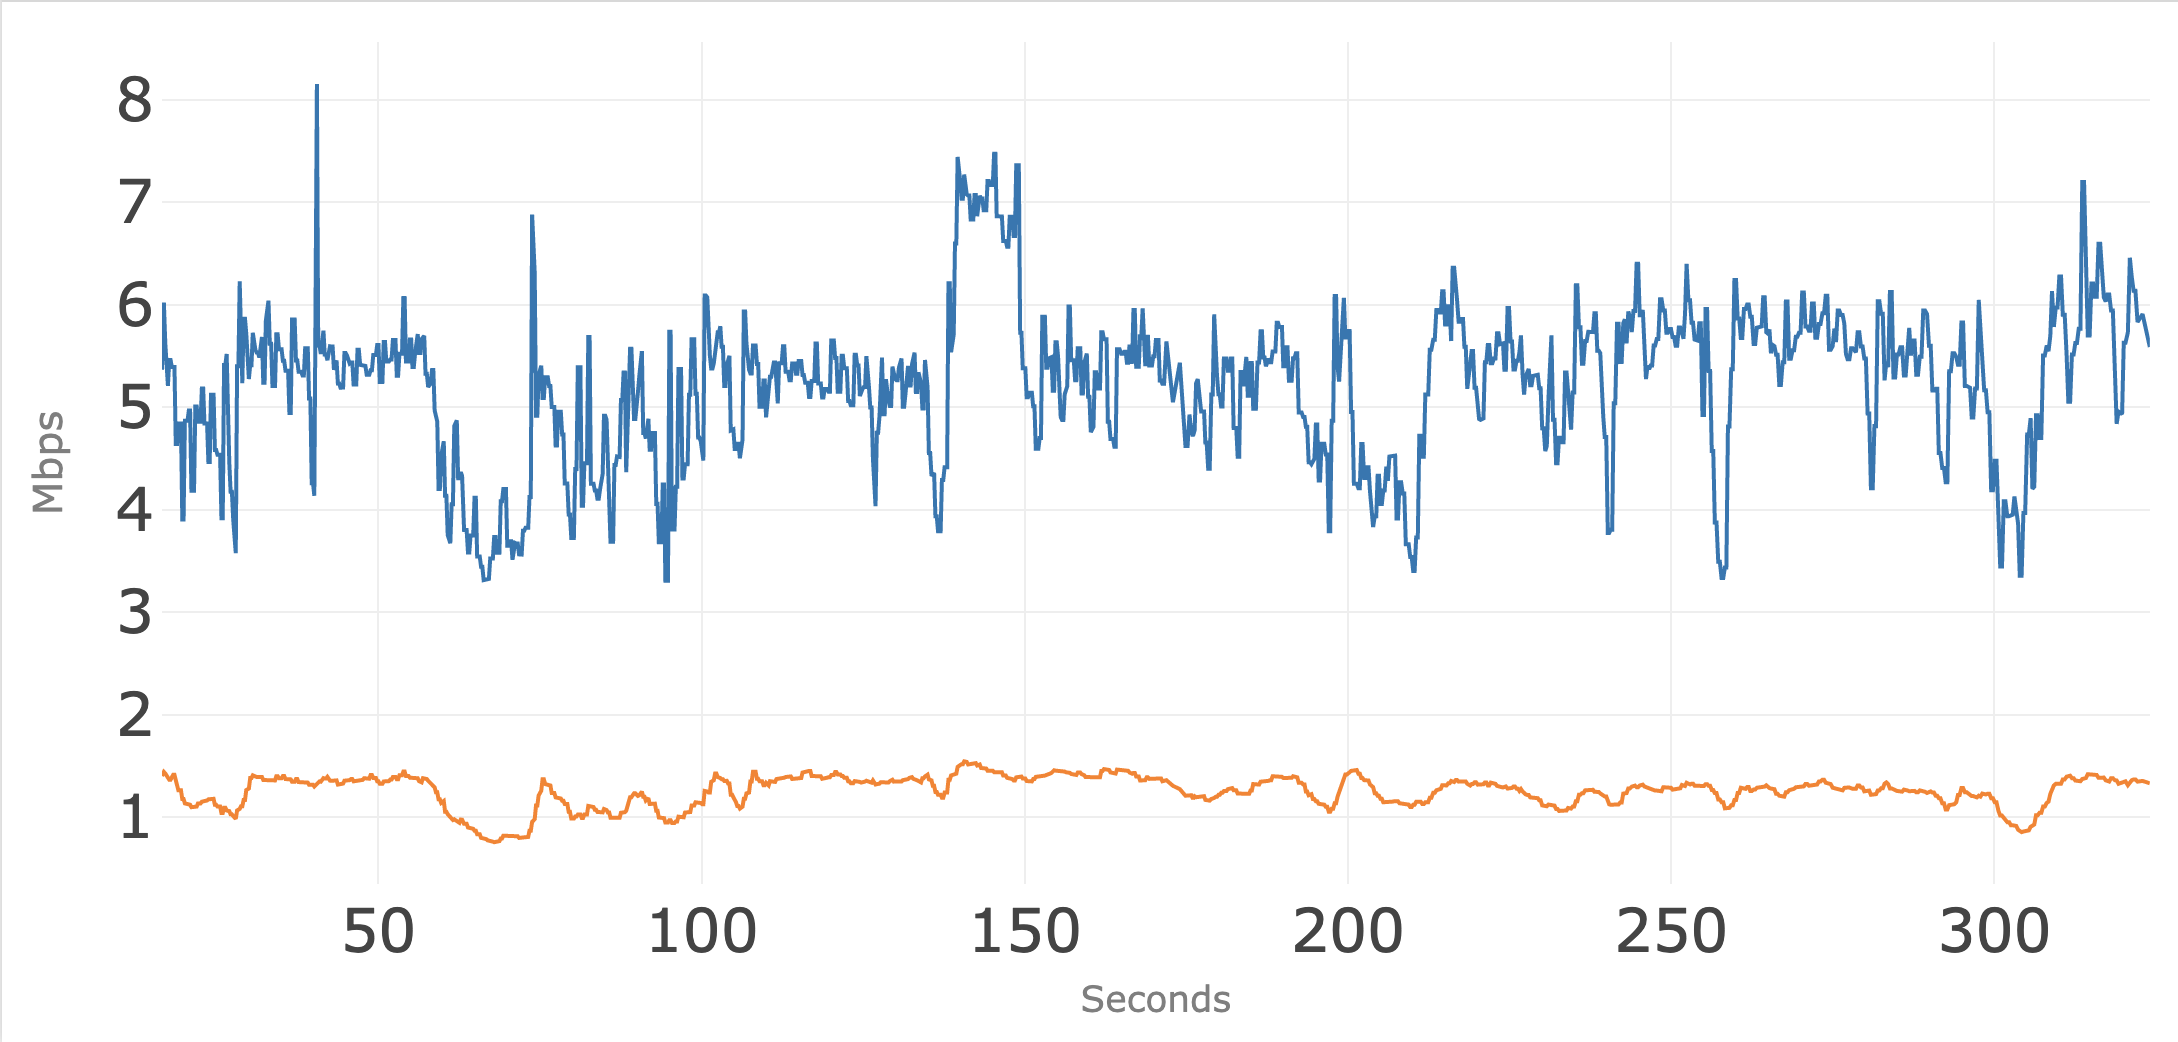
Figure 2 shows the upstream bandwidth usage of the five individual conference sessions where each is below 0.5 Mbps.
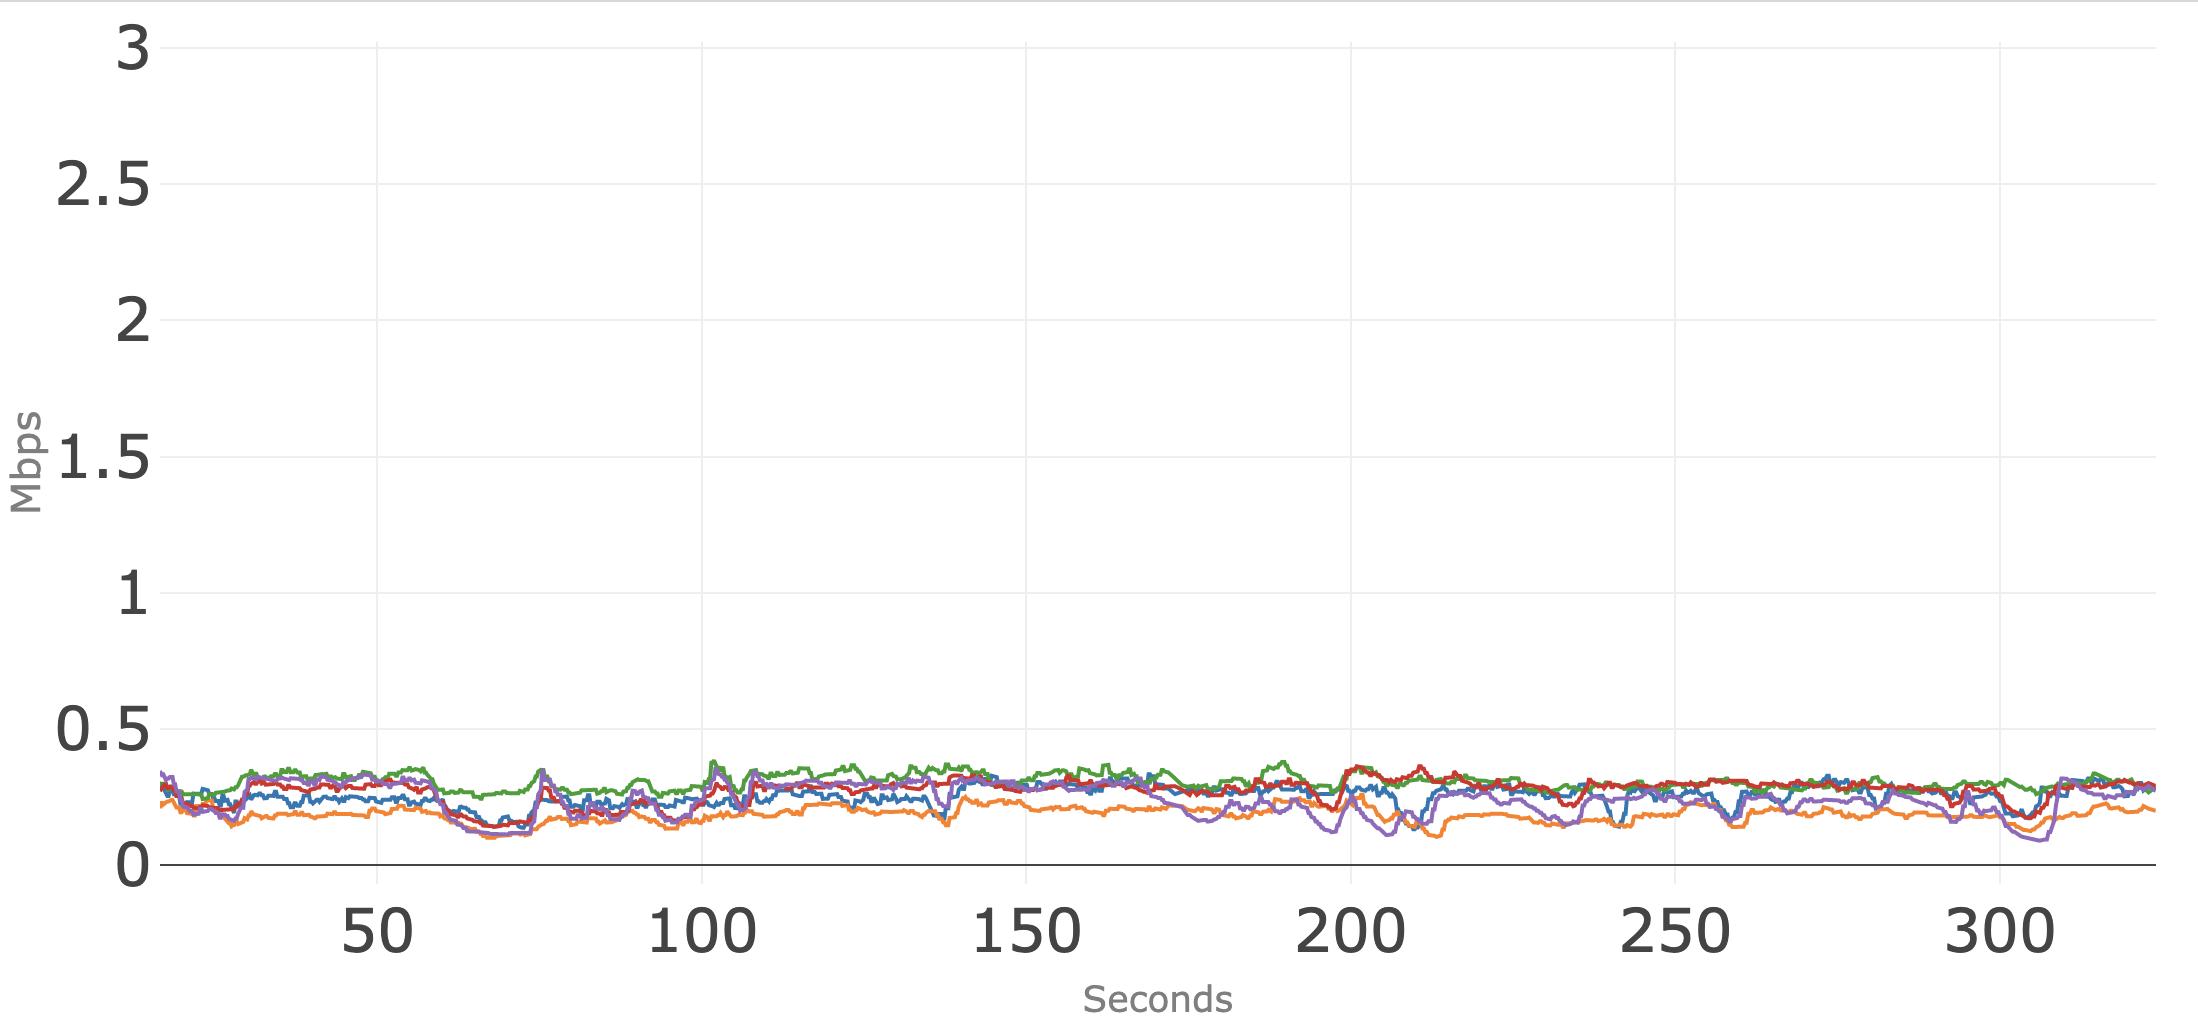
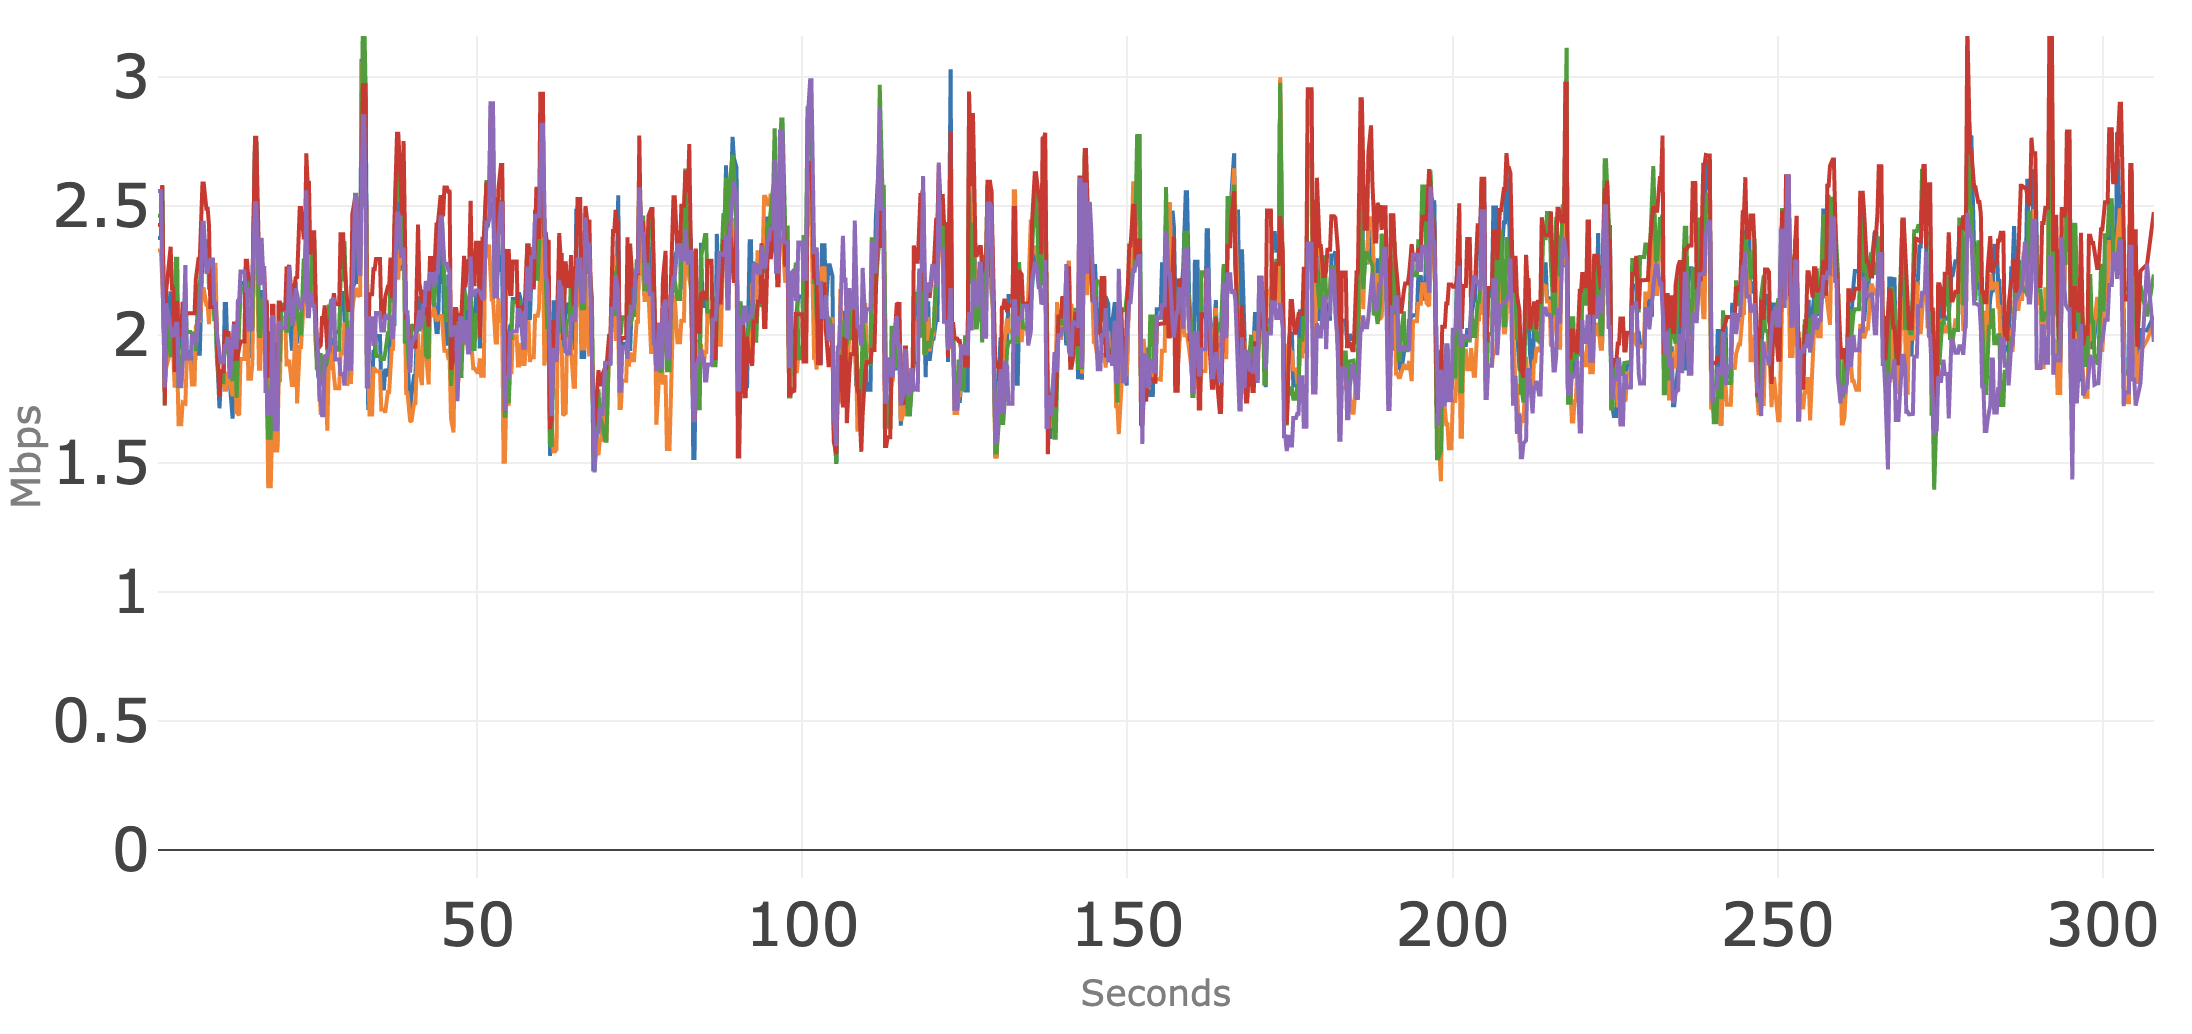
Figure 3 shows the downstream bandwidth usage for the five individual conference sessions.
Conferencing Application: B
Figure 4 shows access network usage for five concurrent sessions over 300 seconds (five minutes) for the next conferencing application tested. The blue line is the total downstream usage, and the orange line is total upstream usage. Note that the upstream usage hovers around 3 Mbps as each conference session attempts to use as much upstream bandwidth as possible.
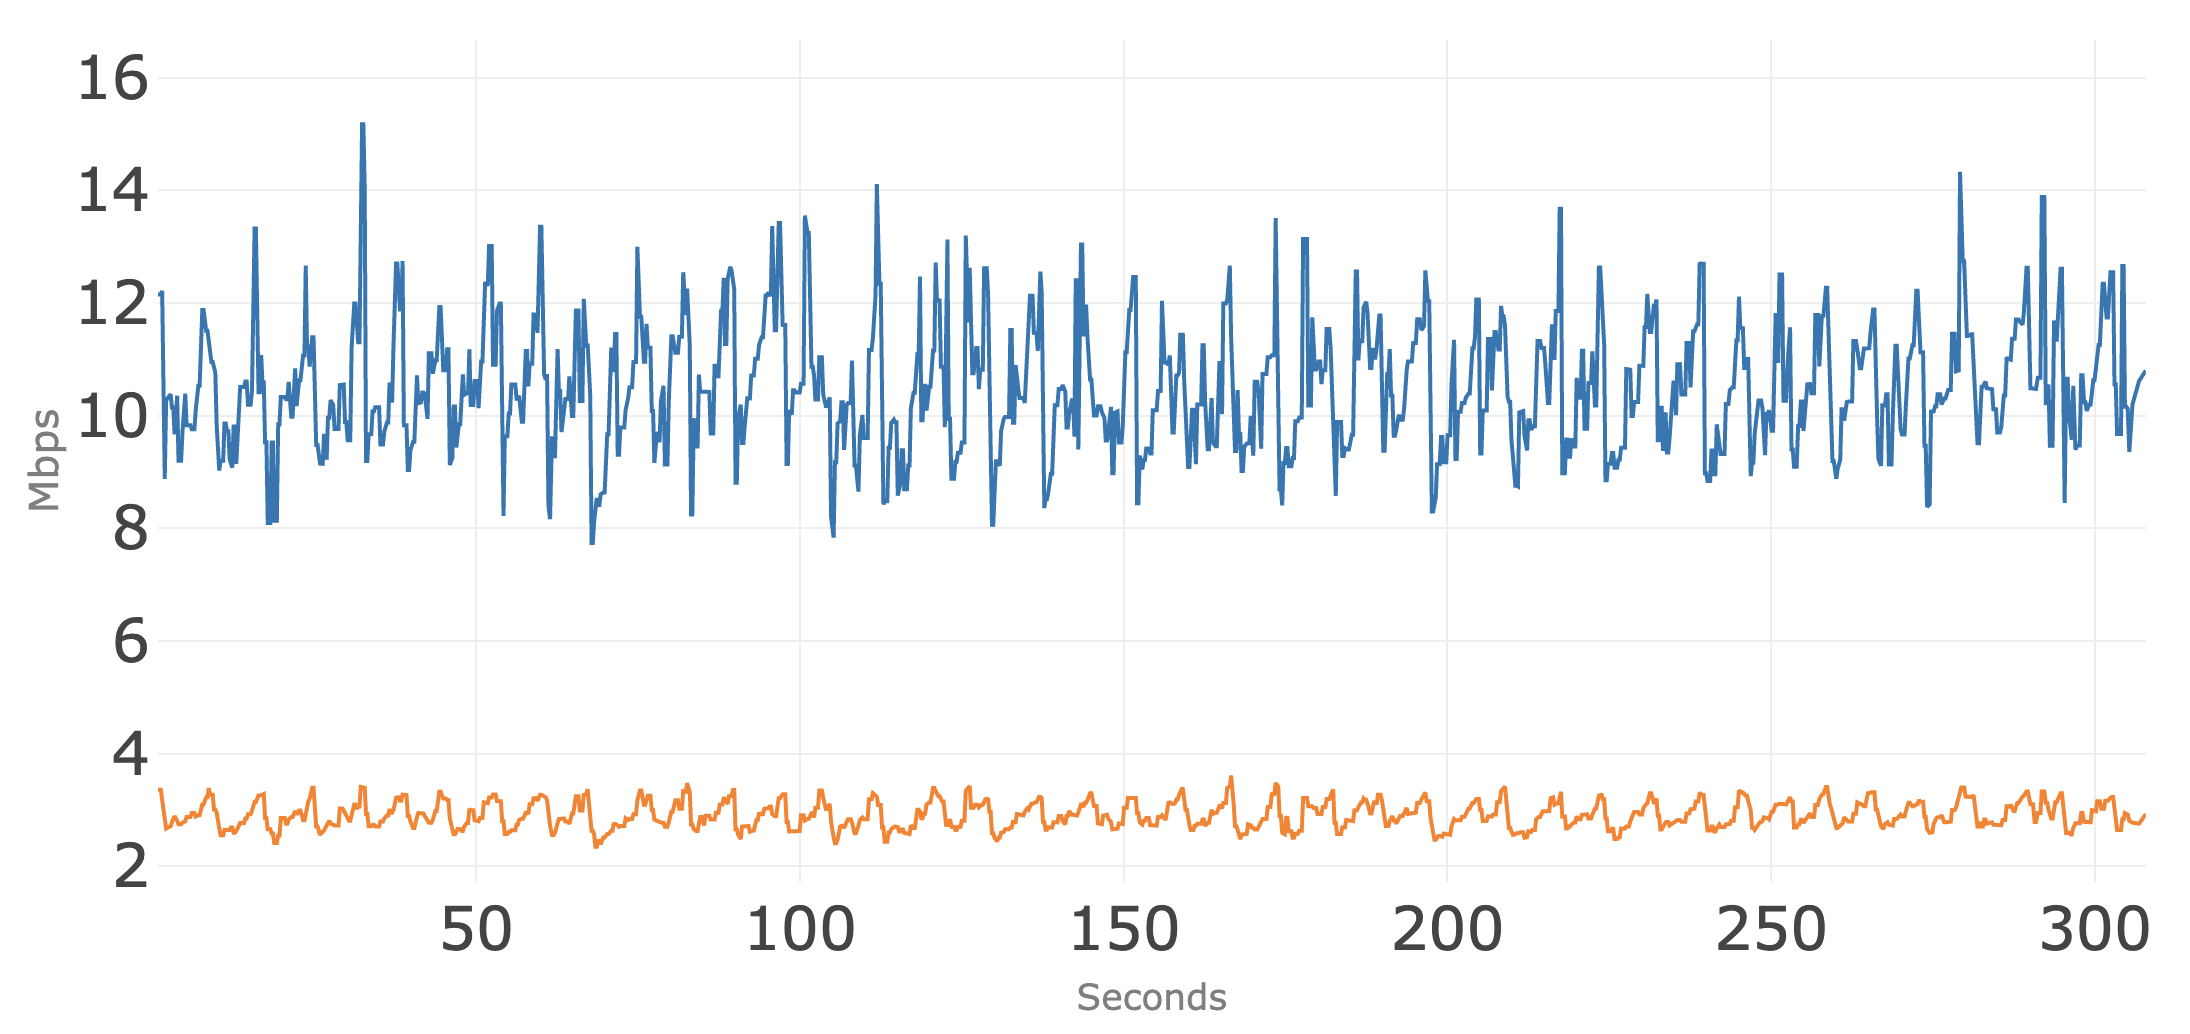
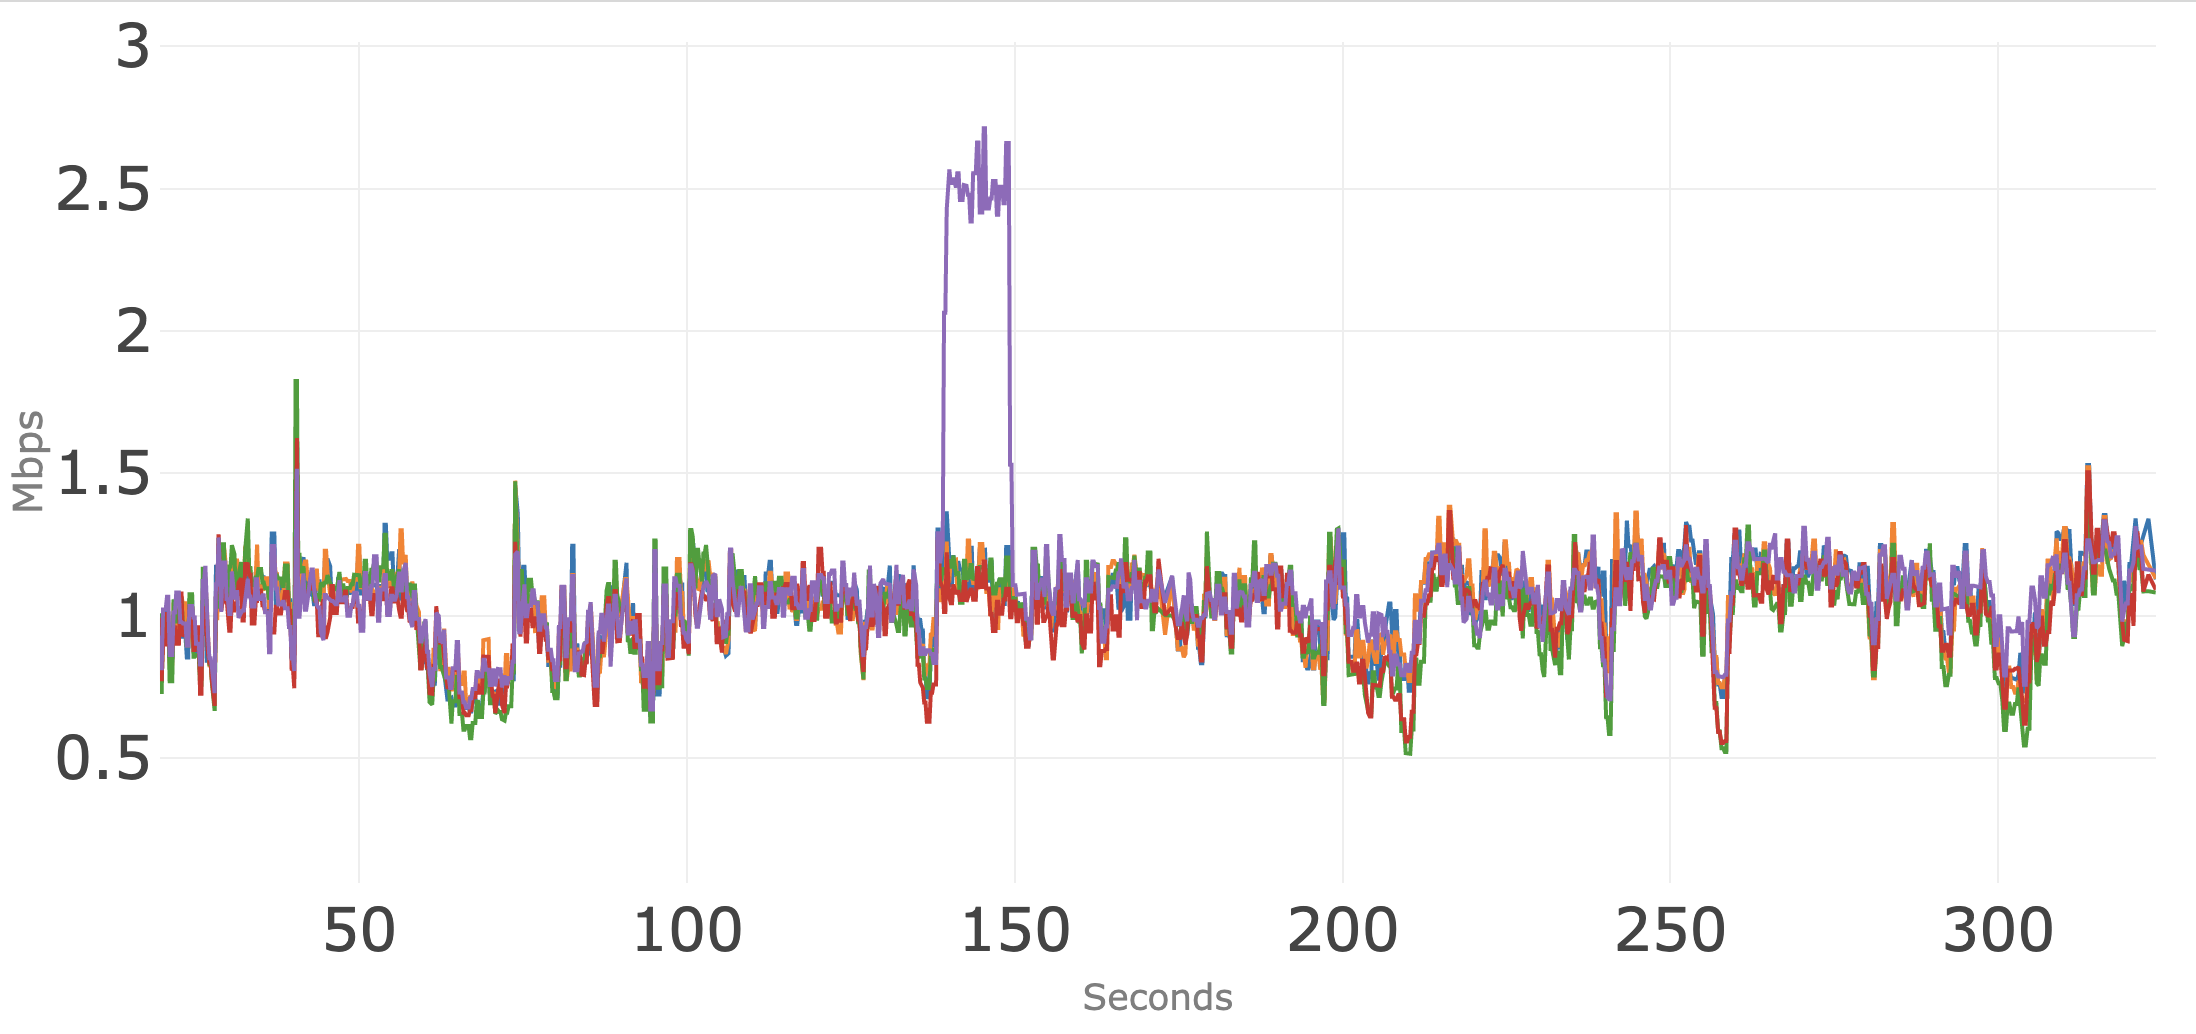
Figure 5 shows the upstream bandwidth usage of the five individual conference sessions where each is below 1 Mbps, though the individual sessions sawtooth up and down as the individual conference sessions compete for more bandwidth. This is normal behavior for applications of this type, and did not have a negative impact on stream quality.
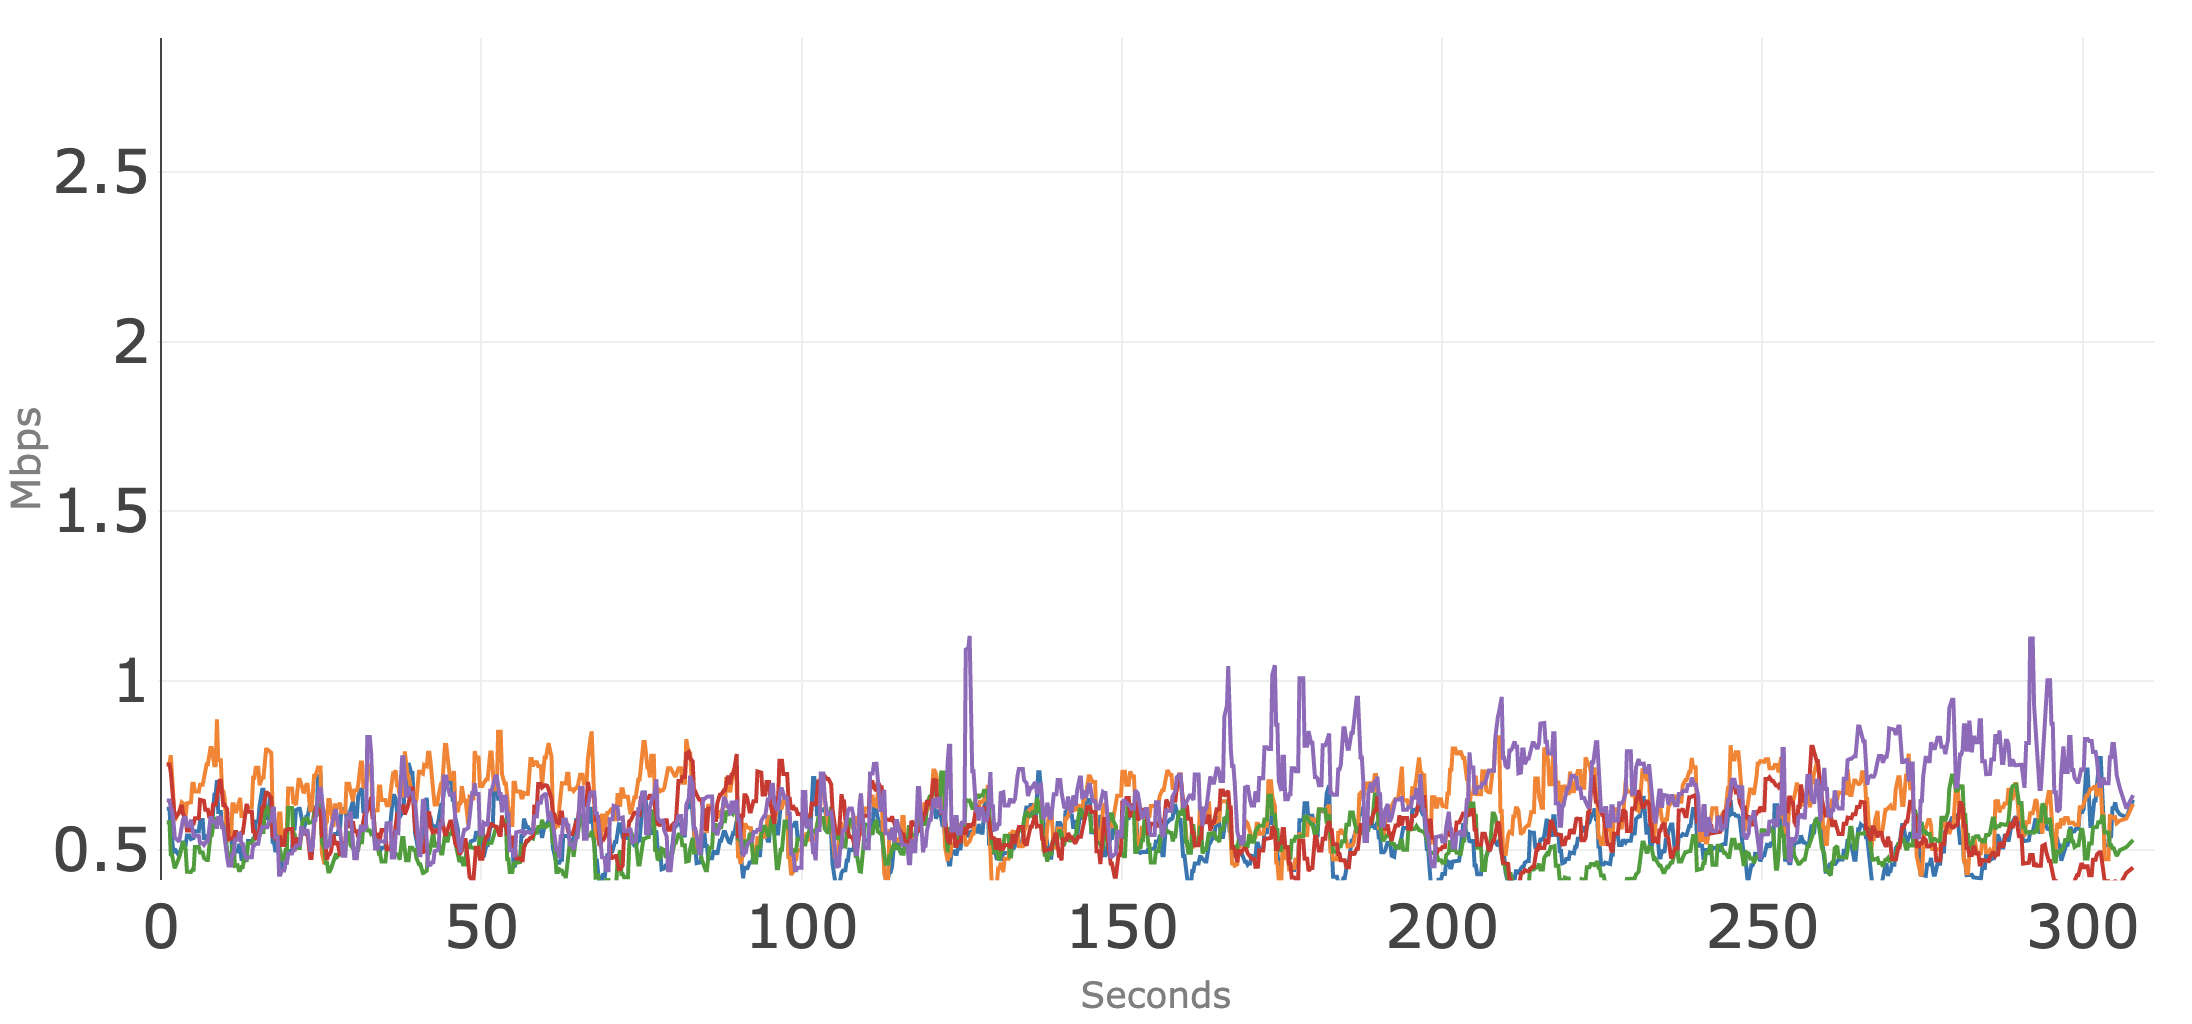
Figure 6 shows the downstream bandwidth usage for the five individual conference sessions.
Conferencing Application: C
Figure 7 shows access network usage for the five concurrent sessions over 300 seconds (five minutes) for the third of the applications tested. The blue line is the total downstream usage, and the orange line is total upstream usage. Note that the total upstream usage hovers around 3 Mbps over the five minutes.
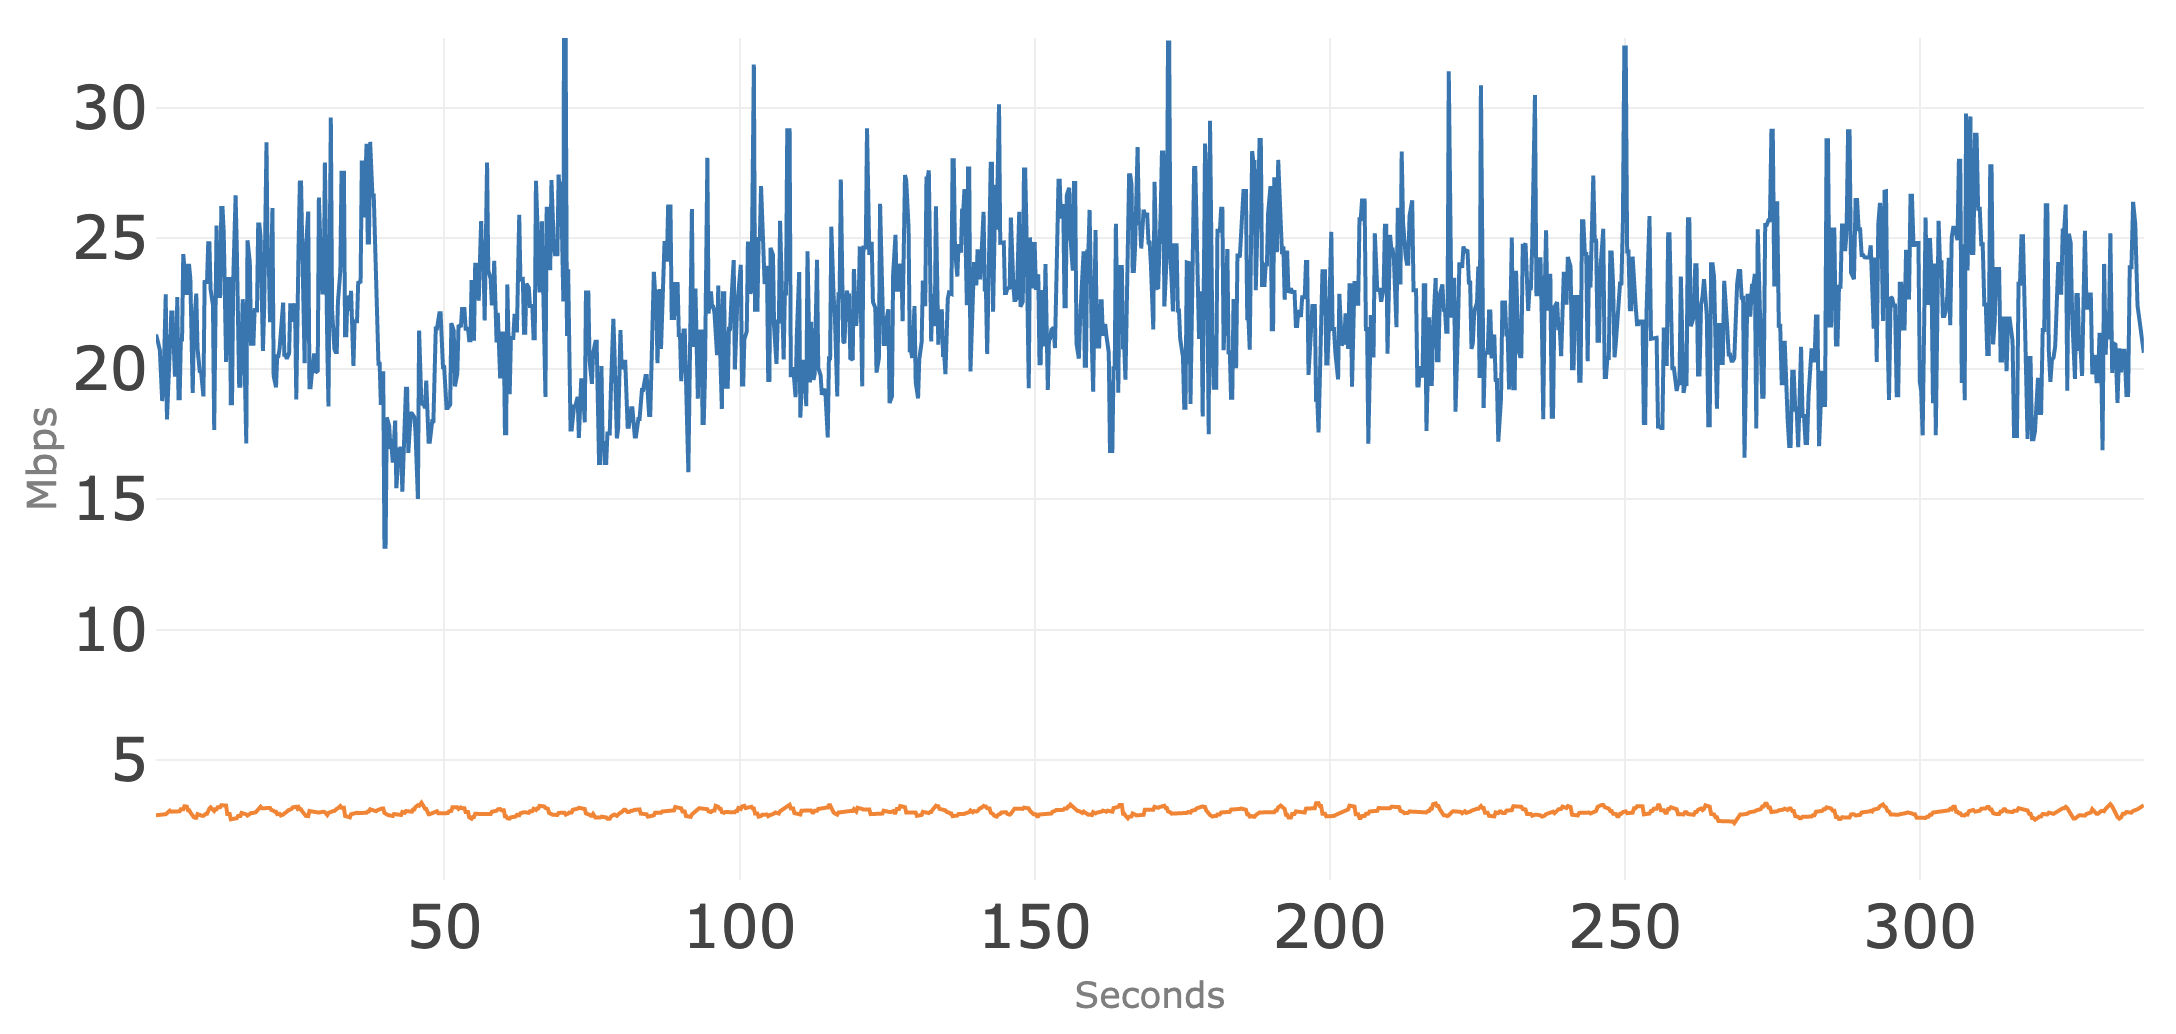
Figure 8 shows the upstream bandwidth usage of the five individual conference sessions where each is below 1 Mbps, though the individual sessions sawtooth up and down as the individual conference sessions compete for more bandwidth. This is normal behavior for applications of this type, and did not have a negative impact on stream quality.
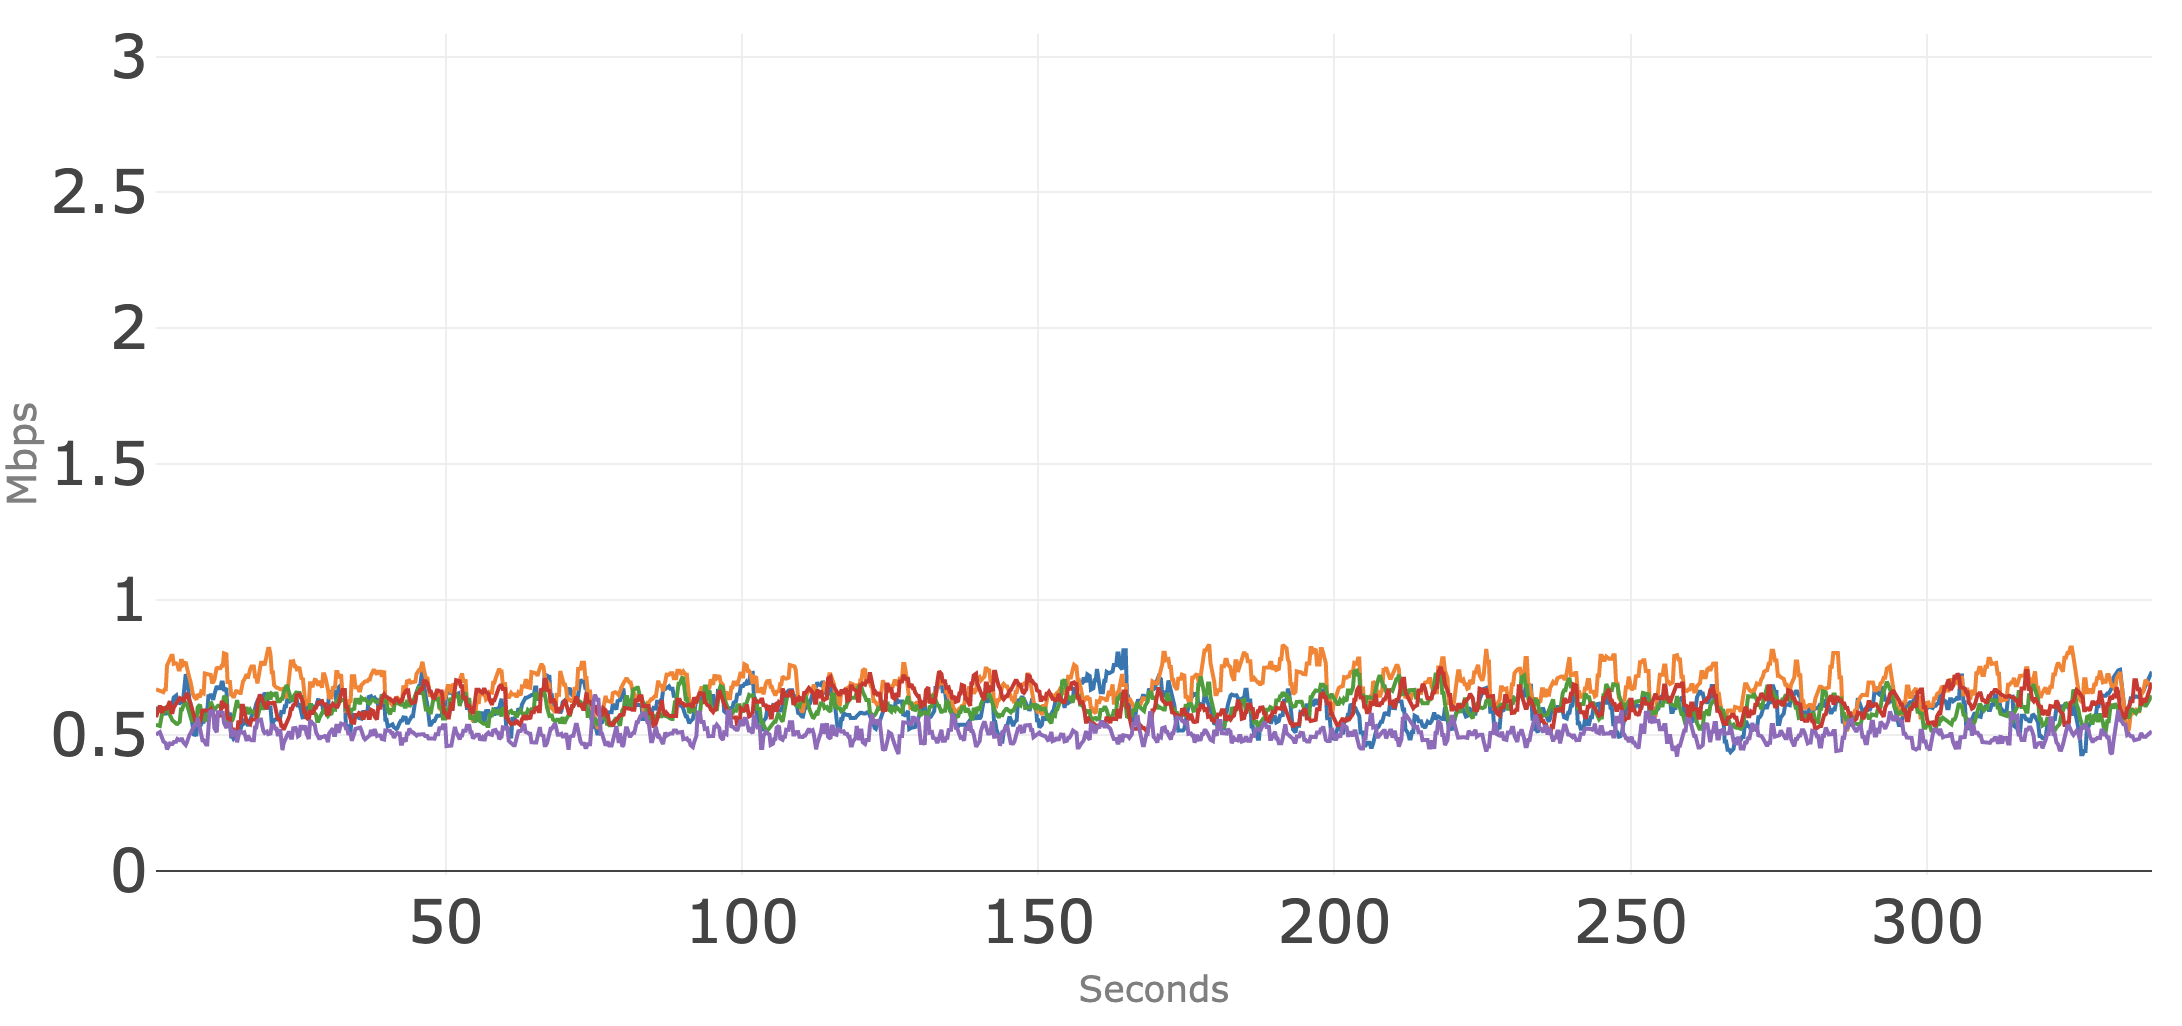
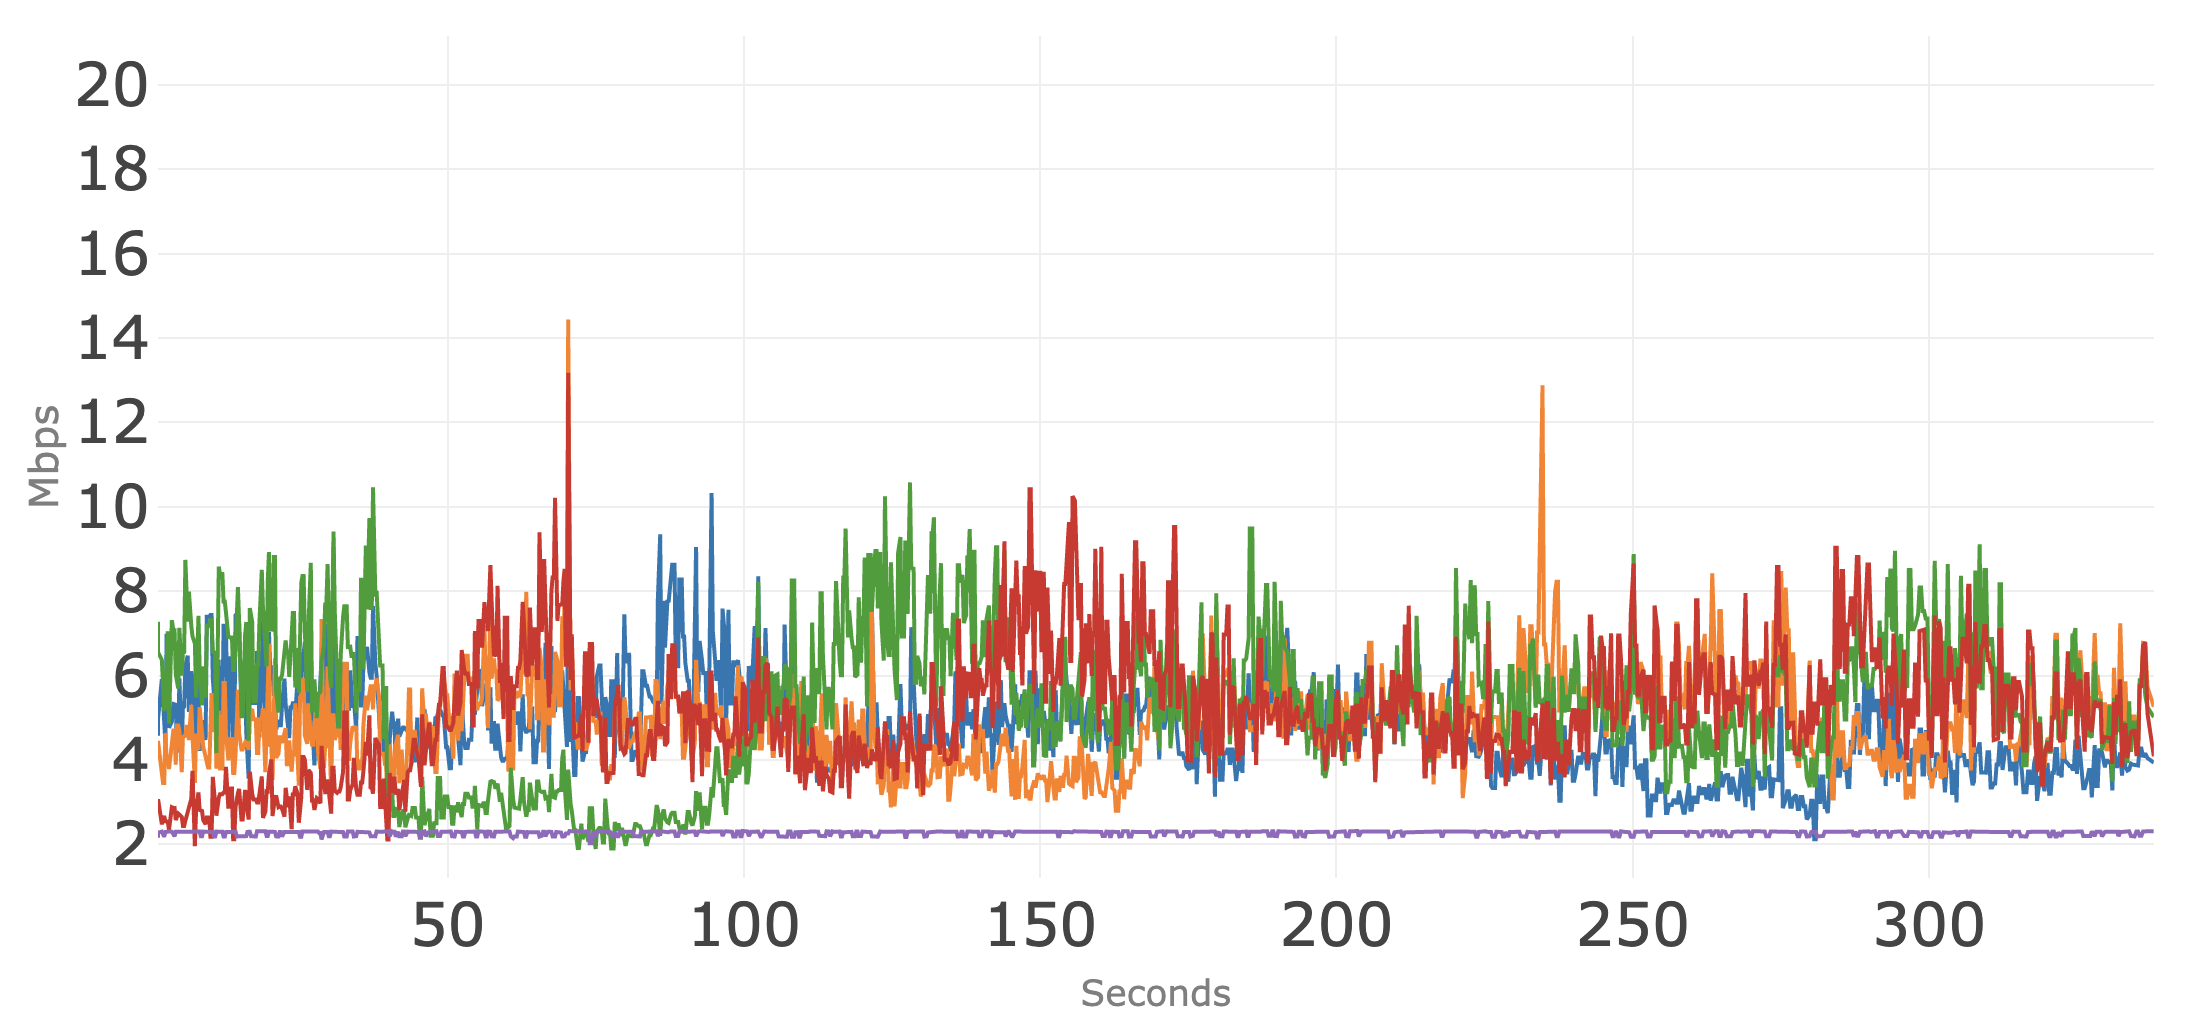
Figure 9 shows the downstream bandwidth usage for the five individual conference sessions. Note the scale of this diagram is different because of higher downstream bandwidth usage.
In summary, each of the video conferencing applications supported at least five concurrent sessions over the 25/3 broadband connection. The focus of this analysis is upstream bandwidth usage, and all three video conferencing technologies manage the upstream usage to fit within the provisioned 3 Mbps broadband speed. For at least two of the conferencing applications, there was also sufficient available downstream speed to run other common applications, such as video streaming and web browsing, concurrently with the five conferencing sessions.
Areas of Future Study
Conferencing services have enhanced modes that allow for higher definition video but that also uses more bandwidth. These modes place additional load on the broadband connection and may reduce the number of simultaneous conferences.
An interesting finding is that upstream bandwidth usage out of a home can depend on how other conference participants choose to view the video. Gallery mode uses lower bit rate thumbnail pictures of participants and is the most efficient for a conference. “Pinning” a speaker’s video can cause higher bandwidth out of a home. In addition, users that purchase add-on cameras that provide higher definition video than the camera included with their laptop may see higher upstream usage.