
Introduction
In the dynamic landscape of web applications, ensuring their reliability and performance is crucial. Datadog, a popular monitoring platform, offers a powerful solution through its Browser Tests feature. In this comprehensive guide, we will explore the significance of browser tests, the process of creating them, and how they contribute to the robustness of your applications.
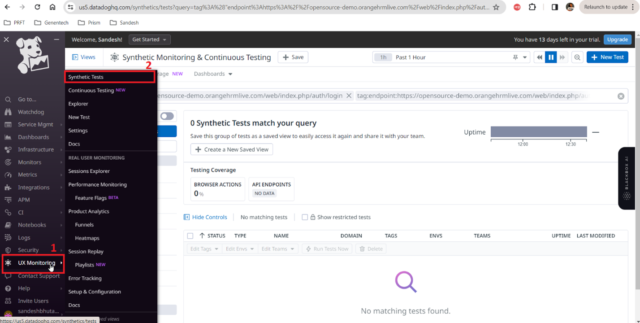
Understanding Browser Tests
Browser tests, a part of Datadog’s Synthetics, are scenarios executed on your web applications at periodic intervals. These tests mimic real user interactions, verifying that key transactions can be performed seamlessly. By running these tests, you can ensure that your application remains functional and user-friendly, even after code changes.
Creating a Browser Test
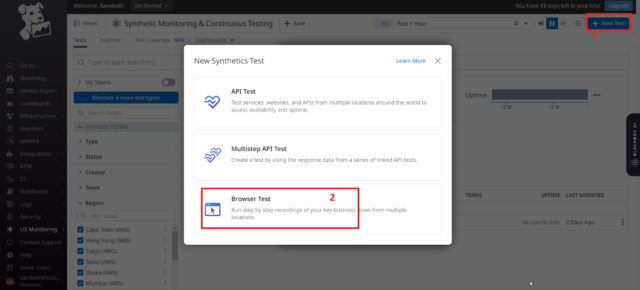
Let’s dive into the step-by-step process of creating a browser test using Datadog.
-
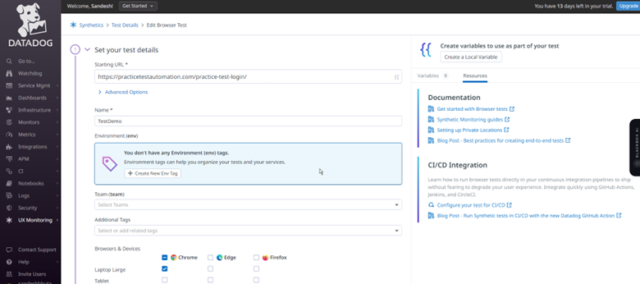
Configure Test Details
- Start by adding the URL of the website you want to monitor.
- Utilize advanced options for custom settings if necessary.
- Name your test and add relevant tags for easy organization.
-
Choose Browsers and Devices
- Select the browsers and devices you want to test your application on.
-
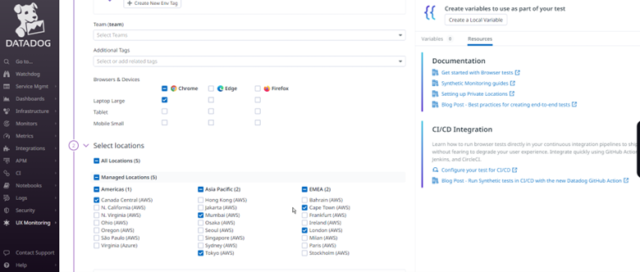
Select Locations
- Choose between managed and private locations based on your testing requirements.
-
Specify Test Frequency
- Set the frequency at which you want your test to execute.
-
Define Alert Conditions
- Configure conditions to trigger alerts only for genuine issues.
-
Configure Test Monitor
- Design your alert message and set up notifications for effective monitoring.
-
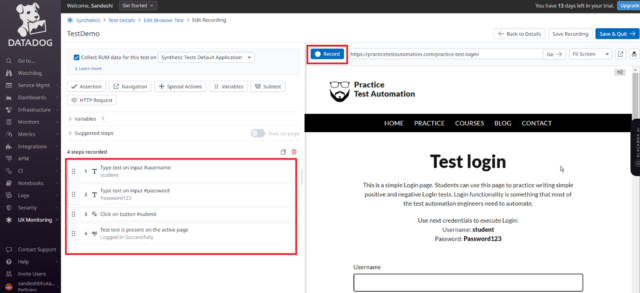
Create Recording
- Download and install the Datadog test recorder Chrome extension.
- Record your test steps by navigating through the user journey.
-
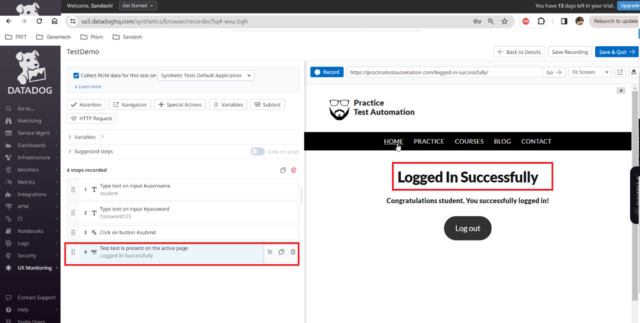
Add Assertions
- Utilize assertions to confirm expected outcomes during the user journey.
-
Save & Edit Recording
- Save your test configuration and monitor.
Recording the User Journey
Recording the user journey is a critical step in creating an effective browser test. The Datadog test recorder Chrome extension allows you to capture user interactions seamlessly. By navigating through your web application, you record the steps that mimic real user engagement.
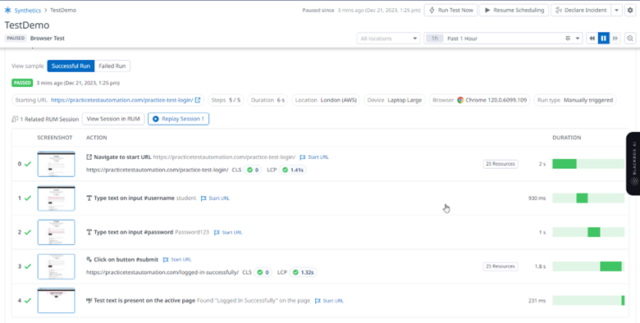
Look at Test Results
Once your browser test is set up, Datadog provides a detailed overview of your test configuration, global and per-location uptime, graphs depicting time-to-interactive and test duration, and a list of all test results. Troubleshooting a failed test is simplified with access to screenshots leading up to the failed step and additional diagnostic information.
Advanced Configurations and Monitoring
Datadog offers advanced configurations such as defining alert conditions, specifying test frequency, and integrating notifications with tools like Slack, PagerDuty, and Microsoft Teams. Additionally, Datadog’s APM integration allows you to view traces generated from your backend during test runs.

Best Practices for Browser Tests
-
Meaningful User Journeys
Select user journeys that truly represent critical paths in your application. Ensure that the chosen scenarios align with actual user interactions, covering key functionalities and potential pain points.
-
Diverse Scenario Incorporation
Mimic real-world scenarios by incorporating diverse user interactions. Test various user flows, input variations, and environmental conditions to ensure comprehensive coverage of your application’s functionality.
-
Optimizing Test Frequency
Strike a balance between the frequency of your browser tests and the nature of your application changes. Regular testing is crucial, but unnecessary frequency may lead to resource inefficiencies. Adjust the frequency based on your application’s update cycle.
Integrating with CI/CD Pipelines
-
Early Issue Detection
Integrate browser tests into your CI/CD pipelines for early issue detection. This ensures that potential problems are identified in the development phase, reducing the risk of releasing faulty code into production.
-
Faster Release Cycles
Streamline your release cycles by incorporating browser tests. Automation in the testing process accelerates the validation of new code, enabling faster and more reliable releases.
User Community and Support
Join the vibrant Datadog user community to seek assistance, share experiences, and stay updated on the latest developments. Engaging with forums, support channels, and resources enhances your proficiency in leveraging browser tests effectively.
Conclusion
In the ever-evolving world of web applications, monitoring their performance and reliability is non-negotiable. Datadog’s Browser Tests provide a robust solution to ensure your applications are always up and running, delivering a seamless user experience. By following the detailed steps outlined in this guide, you can harness the power of browser tests to proactively identify and address potential issues, contributing to the overall success of your web applications.