
Background
Excel is the most used spreadsheet software in today’s era, used by every level of organization. Quite a huge amount of unorganized data is maintained in Excel workbooks, owing to ease of quick creation, storage & sharing of Excel files over database. Resultant many of the Power BI reports / dashboards are based on Excel as data-source.
Excel design enables it to act as a quasi-DBMS, with individual worksheet acting as a table and workbook as a database. But Excel, being a spreadsheet genre software, lacks enforceability making it vulnerable to breaking-down entire Power BI report in certain scenario. This blog showcases few scenarios, which developer needs to take care while using Excel as data-source for Power BI report.
Scenario: Data Type mismatch
Excel supports datatypes like text / number / date / time / logical. Unfortunately, it does not support strong enforcement of datatypes in respective columns. For e.g., users are free to type text into date datatype columns & so on. Data Validation rules of Excel can enforce this, but these rules can easily be de-activated or deleted in few seconds.
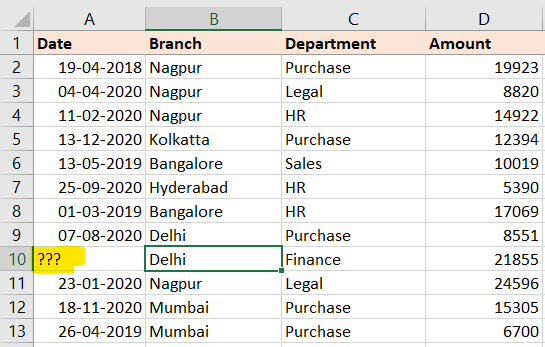
As shown in above screenshot, the data contained all the dates when initial Power BI report was prepared. But one fine day, some user entered question marks (???) in Date column since he/she was unaware of Date of transaction during data entry & decided to fill up that information when it becomes available. But such placeholder values generates errors, as Power BI attempts to skip these rows.
Power BI Desktop will take care to show up the error as shown in the above screenshot. But Power BI Service might not show the error on the face & silently skip the rows loading remaining data. This might affect reporting since amounts written on those rows would never be added as those rows were not imported into data model.
Scenario: Summary Rows at the bottom
Many people have a habit of calculating grand totals at the bottom of data in Excel (refer below screenshot).
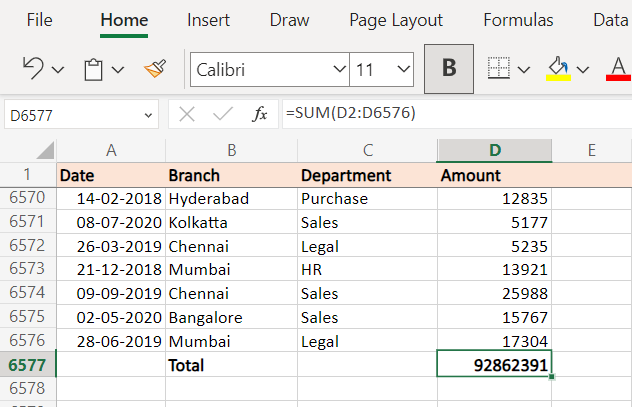
This might ruin reporting in Power BI, as this row also gets incorporated into data, thereby inflating sum totals. Below are the comparative images section of the Power BI report with summary cards showing different figures before/after the summary row


Proper care needs to be exercised when such Excel data is intended to be used as data-source for Power BI. End-user of the Excel workbook needs to be informed of the above thing, and Excel summarization needs to be done in separate worksheets to prevent this.
Scenario: Gaps in Data
Certain times user might insert gaps in data rows (typically observed for printing purposes to adjust print preview range)
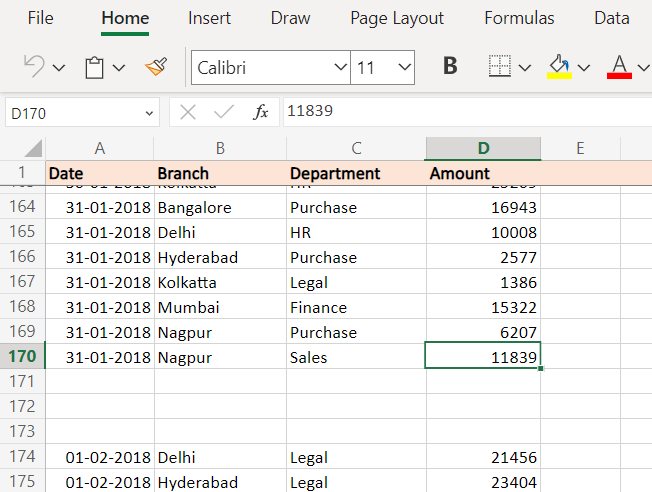
Power BI imports data including blank rows. The majority of the calculations would not get affected, except few DAX functions which will go on to include blank rows in calculations.
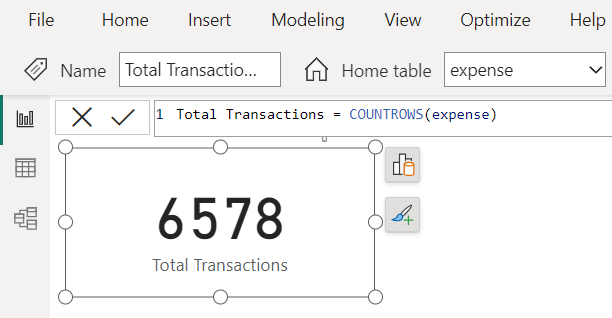
Above is the result using the COUNTROWS ( ) function, which also includes blank rows in the calculation result.
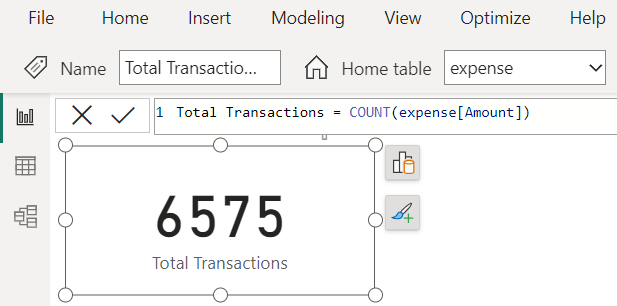
Calculation results differ a bit from other function like COUNT ( ) since this function excludes blank cells while counting.

Few developers prefer to use the COUNTROWS ( ) function, as it yields results faster (it simply returns back the row count of the table). Whereas, COUNT ( ) is relatively slow since it validates the values of each cell while calculating. Power BI report developer needs to account for these scenarios & develop measures accordingly.
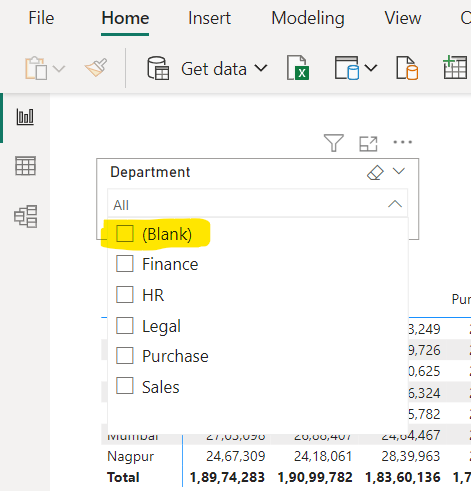
Gaps also create blank options in the slicer dropdown, which does not appear professional.
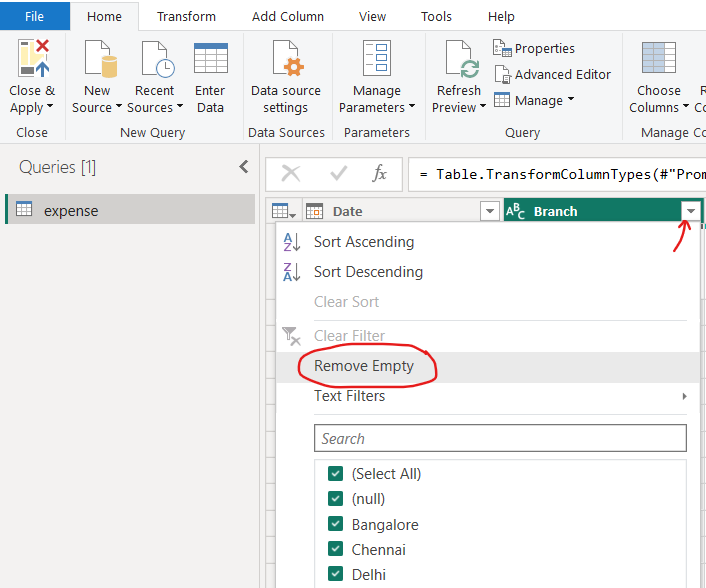
The above mess could be avoided by adding an extra step of removing empty rows (refer to below image)
Scenario: Renaming of Column(s)
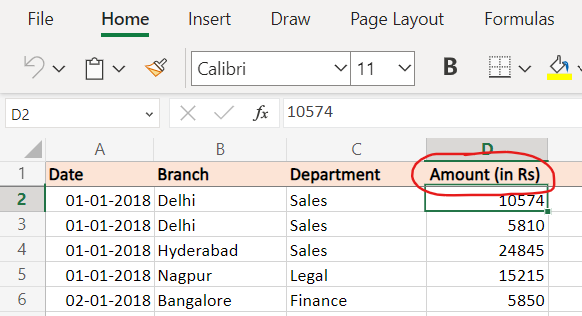
Many times end-users inadvertently change column titles, for better understanding or readability. Some business users might not prefer technical name of the column, so they might be tempted to re-name them before creating PIVOT tables/charts. Like in the below example, Excel workbook user changed column name Amount to Amount (in Rs) since organization is having multi-currency reporting, so user wants column title to depict this fact that amounts are in Indian Rupees.
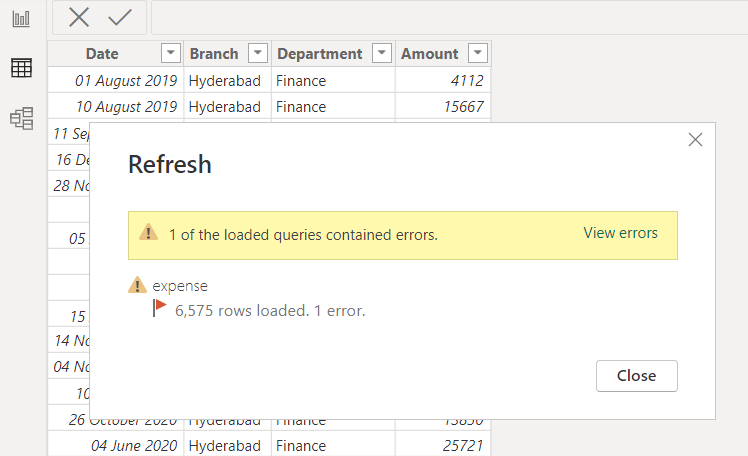
Renaming results to failing of dataset refresh for Power BI reports, since originally while developing report, the column was titled as Amount. Power Query stores column names derived from Excel in the M script for import of Excel data.
Below is the error displayed when Power BI report is opened through Power BI Desktop
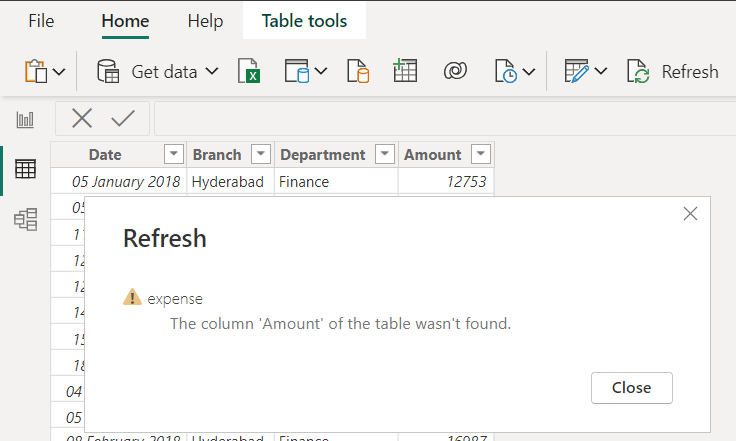
Report viewer needs to be a bit vigilant in monitoring refresh errors, since it shows-up as a small error icon as shown in below image
![]()
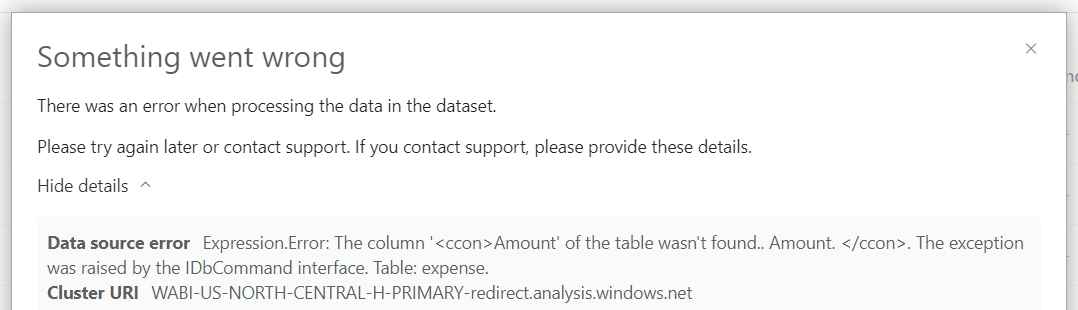
On clicking the error icon, message as below is shown which clarifies error in detail
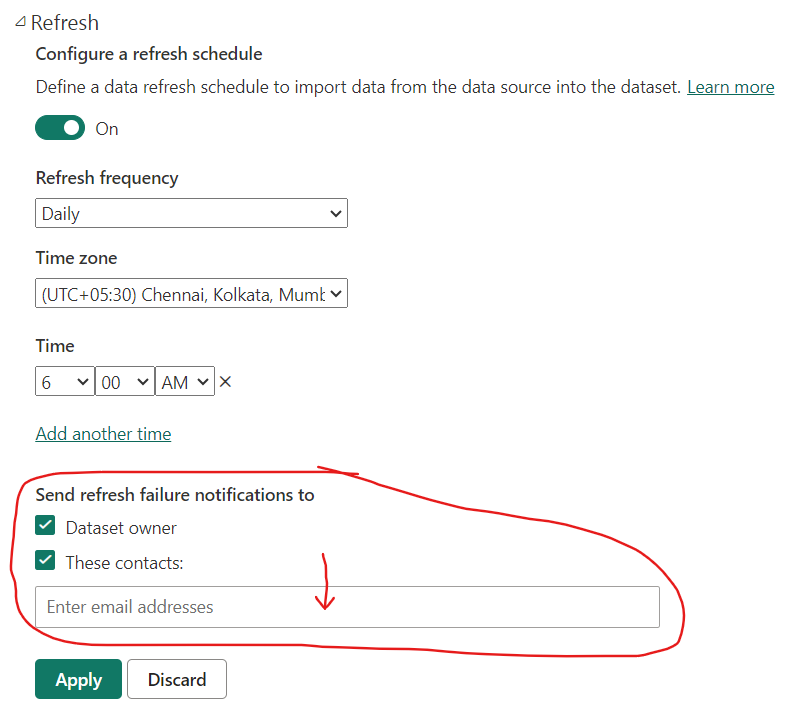
Report users should get their email ID added into refresh failure notification triggers. Power BI will display data of last successful refresh for reports, which is even more disastrous.
Scenario: Cell Errors
Certain times, Excel formulas break due to deletion of cells which formula referred or any other miscellaneous reason. This results in cell error (as shown in below screenshot)
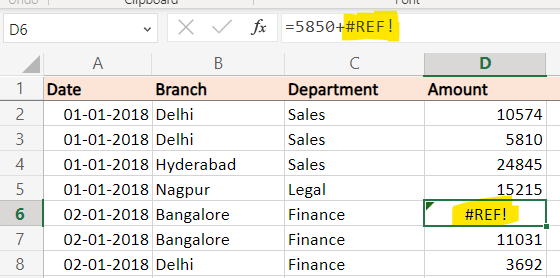
Just like Data Type mismatch discussed above, when the report is refreshed from Power BI Desktop, it would display count of rows with errors. But in Power BI Service, these errors are silent. Although Power Query can perform basic level of handling for these errors like substitution of errors with other value. Since this error originates from source, fixing it in source is more sensible than handling it in Power BI.
Scenario: Renaming / Moving of Excel file
Power BI supports absolute path while referencing any source file (refer below screenshot).
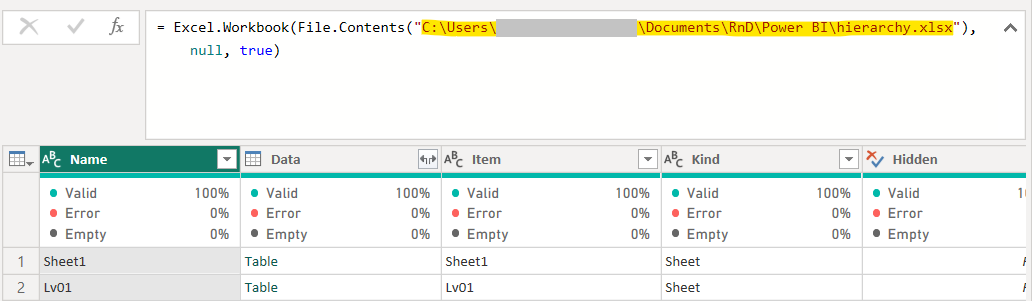
So, if the file is moved to some other folder, or maybe renamed, then the path needs to be updated in Power BI report too.
Same applies for Excel files referencing sharepoint (refer below screenshot).
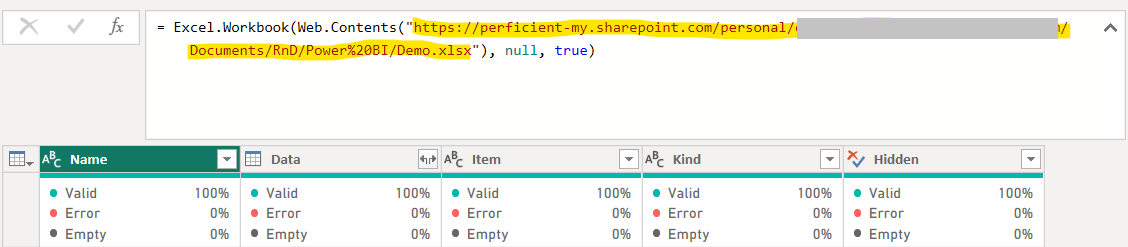
Renaming or moving file to different folder, will result to change of sharepoint URL which needs to be updated.
Report developers can introduce parameter & link file path / URL with parameters which is easy to update from Power BI Service, without having to download, modify & re-publish Power BI report. It is not solution, but just an easy hack.
Google Sheets enjoys advantage in this scenario compared to Microsoft Excel, as links of Google Sheets do not change on renaming or moving file. Google Sheet assigns unique identifiers to the file which is independent of file name or location. Power BI supports Google Sheets as data-source & one can leverage this, if renaming/moving of file is unavoidable & happens frequently as a normal business scenario.
Conclusion
Excel might be a preferred choice of data-source, but one needs to think from broader perspective when using it for analytical & reporting purpose. Moving some of the Excel based data entry into Power Apps would be a strong solution, as forms have capability to validate the data before storing it. Power Apps use Dataverse as a backend which Power BI can connect easily. On an organizational level, this approach provides stronger reporting capability, compared to Excel.