
In the current digital era, every business is bound to have a website to scale its business. Hence it becomes very important and crucial for a business owner to understand how users interact with a website.
Why is it important to understand how the user engages with a website?
Business owners need to understand user behaviors to understand visitors’ browsing habits and patterns to optimize their business growth.
It is similar to advertising something in newspapers. Advertising on the front page is costlier than advertising on the other pages, and the sections are mostly read by users because they provide more engagement. The publishers, based on insights from reports from past advertisements, decide the price of advertising in different sections.
How can a business owner optimize their website?
Website optimization can be achieved through web analytics. It is a technology that provides essential information about user behaviors and how effective the website is for the business and new campaigns.
Let us comprehend how web analytics works and can be used to make stream-oriented decisions from digital footprints.
It is one thing and essential for a business to have a website, but to generate business from that website, attract new potential customers, and generate sales is another thing altogether.
This is where web analytics comes into the picture, to analyze a website’s performance.
As the name suggests, web analytics involves analyzing the data gathered from the website and implementing the changes based on the reports.
How is this data collected?
Every interaction on the website is recorded in the form of metrics, which can involve the number of pages visited (page load), images clicked, buttons clicked, how long a video was played, etc.
Key Metrics:
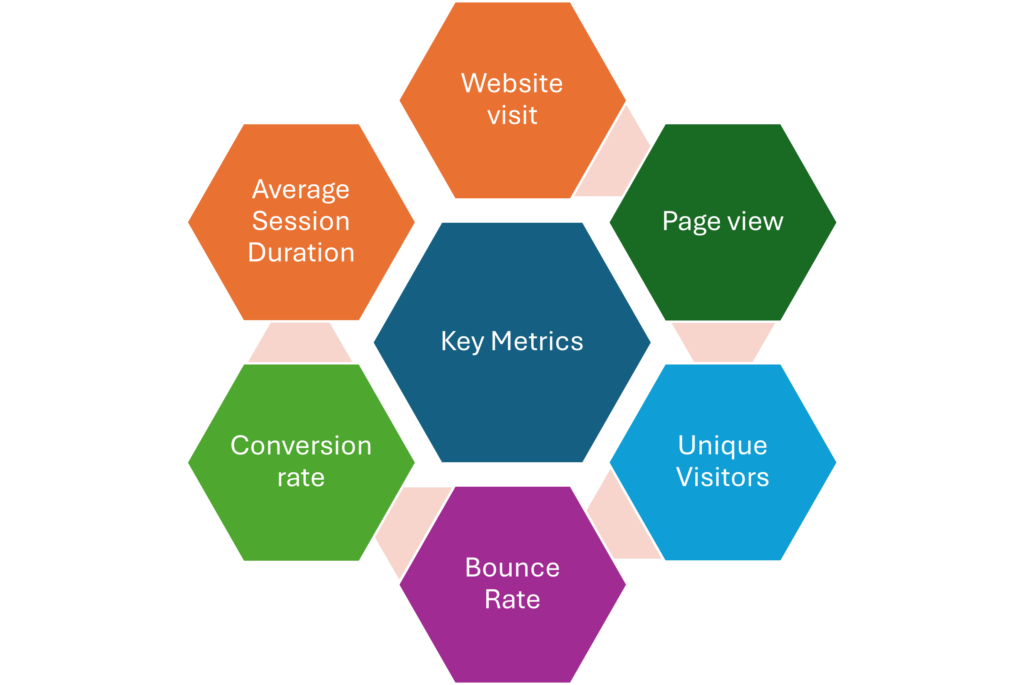
Let us understand the Key Metrics involved and how the insights can be used to optimize the website and marketing strategies:
-
Website visit
This metric represents the number of website visitors in a certain period. The period can vary monthly, quarterly, and or annually to generate reports for different cycles.
-
Page view
This metric indicates the number of visits to a specific page within the website. A page load call, encompassing various data about the visitor and their visits, collectively constitutes all the data, such as:
- User log-in Info: If the visitor is logged in or logged out.
- User Language: The language in which the visitor interacts with the website.
- The specific product that captures the visitor’s interest.
- User location.
- Browser used: Chrome, Firefox, Edge, Safari, etc
- Keyword generating the traffic.
- Device used: Mobile, tablet, or PC.
-
Unique Visitors
It indicates how many new visitors have interacted with the website and helps in understanding the scale of the audience.
-
Bounce Rate
It is a crucial metric that helps to understand how many visitors leave the website just after visiting the initial page. The higher the rate, the poorer the user experience and the irrelevant content.
-
Conversion rate
It reflects the number of desired actions completed by the visitors, such as making a purchase, filling out a form, or pre-booking a product from a new campaign or advertisement. Deriving cost per conversion is possible through this metric. It helps in identifying the areas of improvement. A higher conversion rate indicates the effectiveness and relevance of the content.
-
Average Session Duration
It provides data on how long a visitor engages on the website, how many products they browse, and how many pages they visit. It indicates whether your website keeps visitors interested in your content. It also helps in identifying high-performance pages and low-performance pages for optimization.
-
Referrals
When a visitor interacts with a website’s content and exits to a third party or another business, it is termed a referral. It tracks the domain or links the visitor clicks. It can also indicate the source from which the visitor has arrived on your website and helps improve the business techniques.
How do you implement data analytics into your website?
You can use free tools such as Google Analytics, which provides sufficient data. Paid tools such as Adobe Analytics extract more detailed statistics and offer a wide range of options for in-depth insights into the data.
You can use various extensions like Adobe Experience Platform or Omni Bug to examine the metrics before generating the actual report and verify if the website records the desired data on various actions.
Conclusion
Web analytics can make a huge difference in the growth of a business by optimizing the website. It can help make informed marketing strategy decisions and enrich user experience.