
All eyes are on the automotive industry as the great electric vehicle transformation is sweeping the United States. With an administration that is pushing big goals for EV adoption by 2030, and consumer demand ramping up for the latest vehicle technology, OEMs and dealers are scrambling to ensure they stay on top of the game.
Just in the last few months, some highlights include:
- GM outsold Toyota in vehicle sales
- According to Newsweek, Ford was the top brand in the automotive space in 2023
- Hyundai and Kia outsold Stellantis in vehicle sales for the first time in 2023, but that sales rivalry is heating up
- Tesla is the 8th best-selling automotive brand in the USA
Here is where the automotive industry is sitting halfway through this year.
An Overview of the U.S. Market
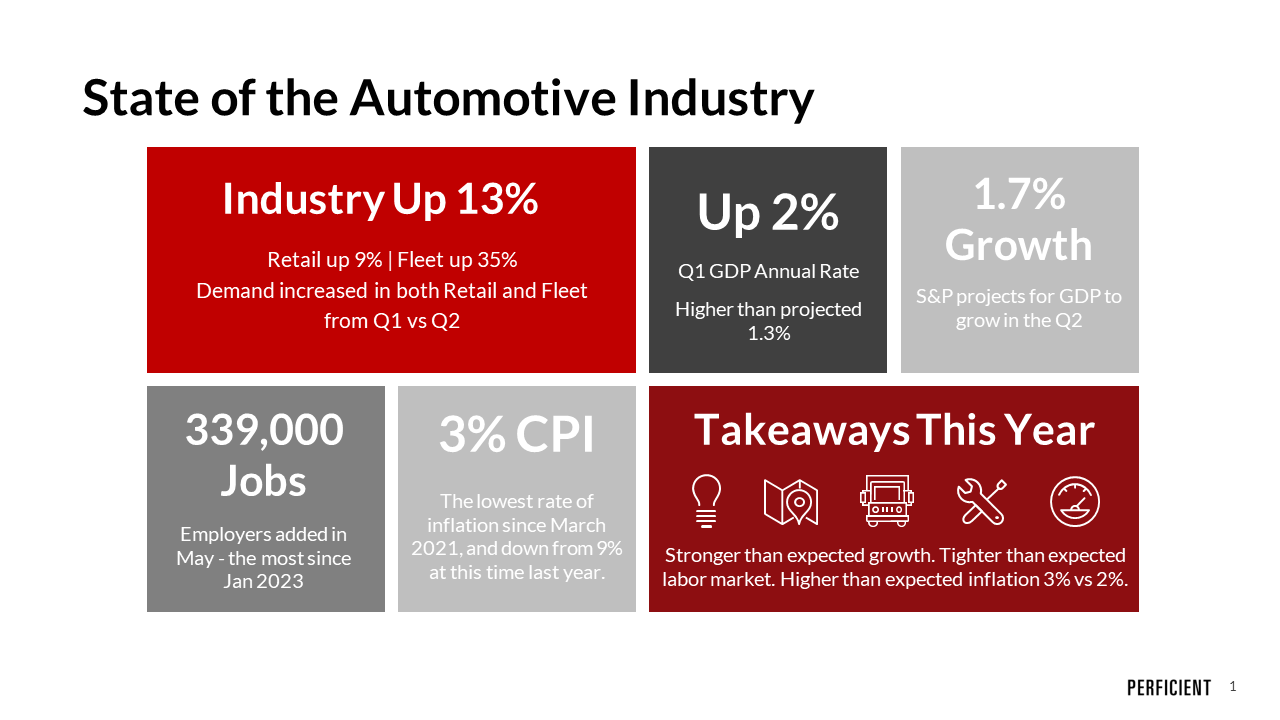
Overall, the automotive industry is up 13%. On the retail side, it is up 9% while the fleet side is up 35%. From Q1 to Q2, both the retail and fleet sectors of the industry have increased demand. The US Manufacturing PMI, which summarizes economic activity in the Manufacturing sector in terms of activity in new orders, inventories, production, etc., is at a current level of 46 down from 46.9 last month, and it is down from 53 a year ago. For comparison, scores above 50 show expansion, and scores below 50 indicate contraction.
At the same time, the annual increases in the Consumer Price Index (CPI) have slowed from 4% in May to 3% in June — the lowest rate of inflation since March 2021. For perspective, it was at 9% this time last year. Further, there are fresh signs of labor market strength that reinforce a picture of an economy with broad momentum despite high interest rates. Employers added a seasonally adjusted 339,000 jobs in May, which is the most since January. That being said, the current average new vehicle transaction price is just over $45,000.
What does all this mean for the last quarter?
- Stronger than expected growth.
- Tighter than expected labor market.
- Higher than expected inflation 3% vs 2%
Another notable statistic is that the GDP grew at a 2% annual rate in Q1, revised upward from the previously reported 1.3% growth rate. Stronger consumer spending was the driver behind the upward revision, highlighting that automotive companies still have an opportunity to improve their vehicle sales.
At the same time, the Consumer Confidence Index increased substantially in June to 109.7 vs. 102.5 in May. The Present Situation Index, based on consumers’ assessment of the current business and labor market, rose to 155.3 in June. This is up from 148.9 in May. The Expectations Index, which is based on consumers short-term outlook for income, business, and the labor market, rose to 79.3 from 71.5 in May. Expectations have remained below 80, which is the level associated with a possible recession within the next year.
Sales YTD as of June 30th in the U.S.
| Manufacturer | Sales | % Change |
| GM | 1,288,282 | 18% |
| Toyota | 1,038,520 | -0.70% |
| Ford | 999,766 | 9.90% |
| Hyundai/Kia | 820,180 | 17% |
| Stellantis | 806,819 | -1.30% |
| Honda | 631,532 | 25% |
| Nissan/Mitsubishi | 525,711 | 22% |
| Tesla | 343,000 | 50% |
| Subaru | 304,092 | 15% |
| VW Group | 256,697 | 12% |
Automotive Industry Forecast

Year MY Industry Volume EV Volume EV Penetration
2022 23 13.9 million 1 million 7%
2023 24 16.7 million 1.7 million 10%
2024 25 17.5 million 2.5 million 14%
2025 26 17.9 million 3.5 million 20%
Biden Administration emission rules require EVs to be at 17% of sales by 2026 and 66% of sales by 2030.
Replacement rate drives showroom age, which drives market share, which in turn drives profits and ultimately stock prices.
EV Update – YTD As Of June 3o
- EV sales 6.5% YTD
- 33 new EV models arriving in 2023
- More than 50 new or updated models coming in 2024.
- 92,000 EVs in stock June 30, 2023, a 92 days’ supply
- ICE vehicles a 54 days’ supply
- Cox Inventory data doesn’t include Tesla which sells direct to consumers.
- Genesis – $82,000 sold 18 units in June, 210 in stock, 350 days’ supply.
- Audi Q4-E and GMC Hummer both well above 100 days’ supply – all come with hefty price tags, and they are ineligible for tax credits.
- Kia EV6, Hyundai Ioniq 5 and Nissan Areya increasing days’ supply and ineligible for tax credits.
- Mustang Mache 117 days’ supply – Ford is saying this is a result of ramped up production in anticipation of stronger 3rd quarter sales.
- Hybrid vehicles have much lower inventory levels supporting Toyota’s argument that consumers want a steppingstone to fully electric vehicles.
- 44 days supply of hybrids industry wide with Toyota Prius and Rav4 Hybrids under 30 days
- In comparison Toyota only fully electric model BZ4X has 101 days’ supply
- EV prices expected to be at parity with gas vehicles around 2025.
Gas Prices Across the Nation
As of July 13th, this is what gas prices looked like on average:
National Average
- Current – $3.54
- Past Month – $3.59
- One year ago – $4.66
By State
- Texas – $3.16
- Hawaii – $4.66
- Florida – $3.42
- California – $4.85
- Pennsylvania – $3.63
- Washington – $4.90
Used Vehicle Market
Delinquencies for used vehicle loans have reached levels not seen since the Great Recession of 2007-2009. Delinquencies are concentrated within the subprime sector but impacts all used vehicles. Delinquency rates over 60 days past due rose 26 basis points year to year from 1.43% to 1.69%.
Highlights
Ford Battery Plants
Ford Motor Company, in a joint venture with a South Korean partner, is set to get $9.2 billion from the Energy Department to finance battery plants one in Tennessee and two in Kentucky. Those states will also input $2.7 billion.
The United Auto Workers Debacles
The United Auto Works (UAW) contract is set to expire in September 2023. There is also a new UAW President, Shawn Fair. He’s upset that West Virginia Senator Joe Manchin nixed a bonus of $4500 tax credit for union-made EVs in the Inflation Reduction Act.
Pick Up Wars
- Ford F Series
- 382,893 sold
- 28% increase year over year
- Chevy Silverado
- 264,070 sold
- 1.8% increase year over year
- Ram Pick-up
- 223,049 sold
- 9% decrease year over year
The State of Top Large SUVs
- GM
- 149,883 sold
- 20% increase year over year
- Stellantis
- 56,012 s0ld
- 25% increase year over year
- Ford
- 48,224 sold
- 67% increase year over year
Key Findings
- Product activity is increasingly varied among OEMs and relative gaps are opening again. The range of strategies span OEMs with product pipelines focused on traditional high-volume models to OEMs focused on lower volume EVs.
- Replacement rates appear elevated versus historical levels, which is partially a function of the low volume base in 2021, although product activity is strong.
- New model mix is 78% CUVs and light trucks and 22% small/mid/large/luxury cars, with a still significant overweight towards CUVs (51%) which creates risk.
- Along with a strong cadence of new product introductions, OEMs are continuing product cancellations, particularly in the car segment and by the Detroit 3.
- In terms of traditional replacement rate, Ford and Toyota appear best positioned, while Stellantis and Nissan appear worst positioned. However, many incumbent OEMs marginally lag the industry average.
- The Detroit 3 book end the range of automakers in terms of replacement rate (Ford best, Stellantis worst and GM in between). GM and Ford have different strategies around EV launches, but both appear solid.
- The Japanese OEMs each have a somewhat volatile product cadence over MY2023-26, and with differentiated segment on cars. Toyota leads the group in cumulative replacement rate, while Nissan lags and Honda is in between.
- Hyundai/Kia cumulative replacement rate is better than most incumbent OEMs but starts off with a slow cadence that accelerates. The duo’s model launch is overweight with cars versus the industry.
- European OEMs replacement rate is in the middle of the range for incumbent OEMs, although Mercedes-Benz leads, while VW and BMW trail. Product launches are dominated by luxury & Sporty cars and CUVs, as well as alternative powertrains.
- A litany of newer entrant EV focused OEMs has emerged, with product targeted to launch over MY2023-26, but a fierce competitive environment could limit success,
Nowadays most of the developed and developing countries looking to change electric vehicles for reduce the pollution. It is good think to save our eath.
Awesome news.