AWS | Cloud
Three Calls To Action for Security On AWS 
Steyn Huizinga 01 Aug, 2022


We define Observability as the set of practices for aggregating, correlating, and analyzing data from a system in order to improve monitoring, troubleshooting, and general security.
When it comes to Cloud Observability, several Open Source and proprietary tools have been available over the years. And while Cloud providers offer a wide array of solutions for monitoring, they often lack complete features for visualization, or complex querying of relationships among the elements of your environment. For this reason, it is common for users to integrate third-party applications to fulfill their requirements.
Many vendors offer now high-quality solutions off the shelf. They are often the adequate choice for corporate production environments due to several reasons:
But what is the value of Open Source solutions on this topic? I have explored the possibilities and limitations for two use cases related to observability:
While Altimeter and Amazon Neptune are covered in the next series of this blog, we will now approach a common use case for many Cloud environments: visualization of its Cloud elements on network diagrams and security auditing of the current infrastructure.
There are many paid options to dynamically visualize your AWS environment as a complete diagram. They usually depict regions, VPCs, connections, workloads, IP addresses, public access… Some options also provide cost briefings per service or element. These diagrams serve as a briefing of your infrastructure, allowing a general picture of every provisioned part without swapping around services in the AWS console. A dynamic diagram is a desirable feature for many Cloud users and administrators, but it is only within the reach of corporate-level budgets.
So, is there any option for Cloud users on limited funding? Students, research groups, personal projects, OS developers… may also want to benefit from visualization on their smaller deployments.
The reality is that, while there are many paid options available, it is challenging to find something similar in the open-source world. I have found CloudMapper and, while its visualization functionality will no longer be maintained, it is one of the “best I could find” for both the purposes of this blog post.
On security auditing, things are pretty different. We can find a wide array of offensive and defensive open-source tools that will help us assess what is the status of our Cloud environment. Some of them have been compiled in this (awesome) repository.
Let’s get into action and try the tool. Follow the installation procedure for your OS. You will basically clone the repository, install some build dependencies and then install additional library requirements on a Python venv.
Troubleshooting note: if you are faced with errors regarding versions in the requirements.txt file, try changing the strict ‘=’ for a ‘>=’. It has worked for me, fixing some no longer available dependencies.
After setting up CloudMapper, make sure you have configured your AWS CLI dependencies. The dependencies you use must have the following privileges:
On the cloned repository, and after all the initial setup has been made, you can collect information about your environment:
python cloudmapper.py collect –account <my_account> (either name or numeric id)
This will take a bit.
After that, we only need to generate a report, prepare it for representation, and finally run the command to set a web application on localhost:8000.
python cloudmapper.py report --account <my_account>
python cloudmapper.py prepare --account <my_account>
python cloudmapper.py webserver --public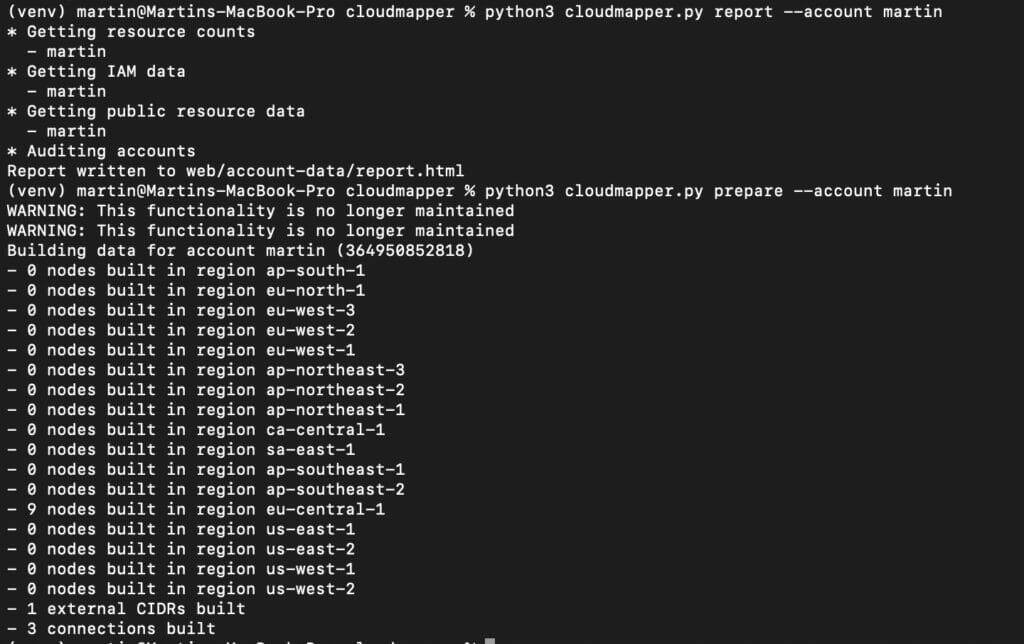
So, after visiting http://0.0.0.0:8000:
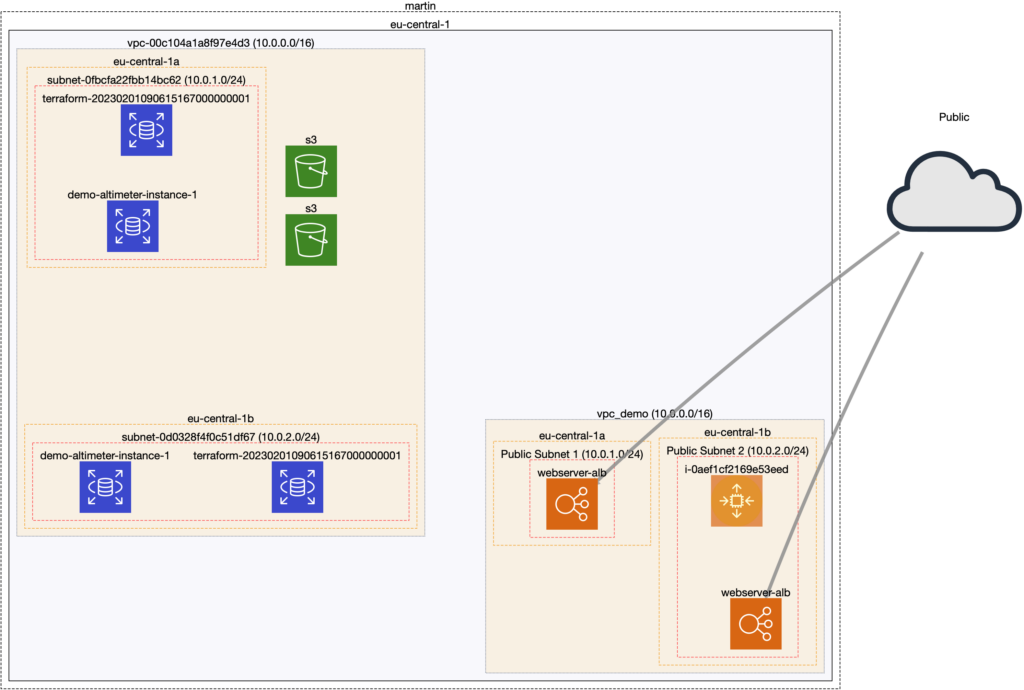
It depicts my current account status, where I have worked in two VPCs. One for my Disaster Recovery blog post (vpc_demo) depicting an ASG and two load balancers on different AZs. The other VPC has been used on the second part of this observability series (link pending), and it depicts two DB instances (Neptune and RDS), with two S3 endpoints.
What I have been able to notice is that both VPCs are sharing the same CIDR (10.0.0.0/16), something I did not notice when creating my VPC with Terraform and a default block, which could cause troubles in some situations where VPC interconnectivity is a must.
Also, you can see that the load balancers are exposed to the Internet. This was an intended behavior, but in case the databases or other elements had been misconfigured to be exposed, it will be easy to spot with this diagram.
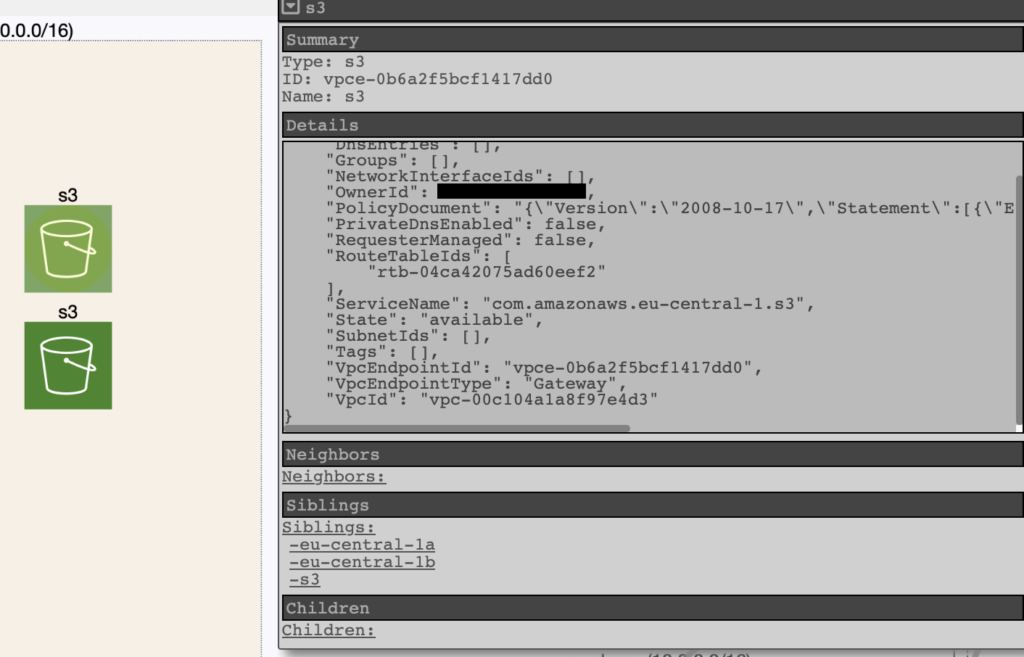
Icons have limited capability. For example, an S3 endpoint has the same icon as an S3 actual bucket. Nonetheless, we can select every item to check for details.
Visualizing is an important feature, but we would like to check our environment to pinpoint weaknesses and other security concerns. Luckily, when creating the diagram data, a report is also available at http://0.0.0.0:8000/account-data/report.html. The interface takes a minute to load, and data will be inaccurate until then.
After all our data is loaded, you will see a chart dashboard depicting resource count, region usage, findings count… It will also list all vulnerabilities found on the Cloud infrastructure, graded by severity, under the section ‘Links to findings’. Clicking on any of the links, or scrolling down, will show you more details about each event.
Let’s check one finding rated as ‘HIGH’ in my environment.
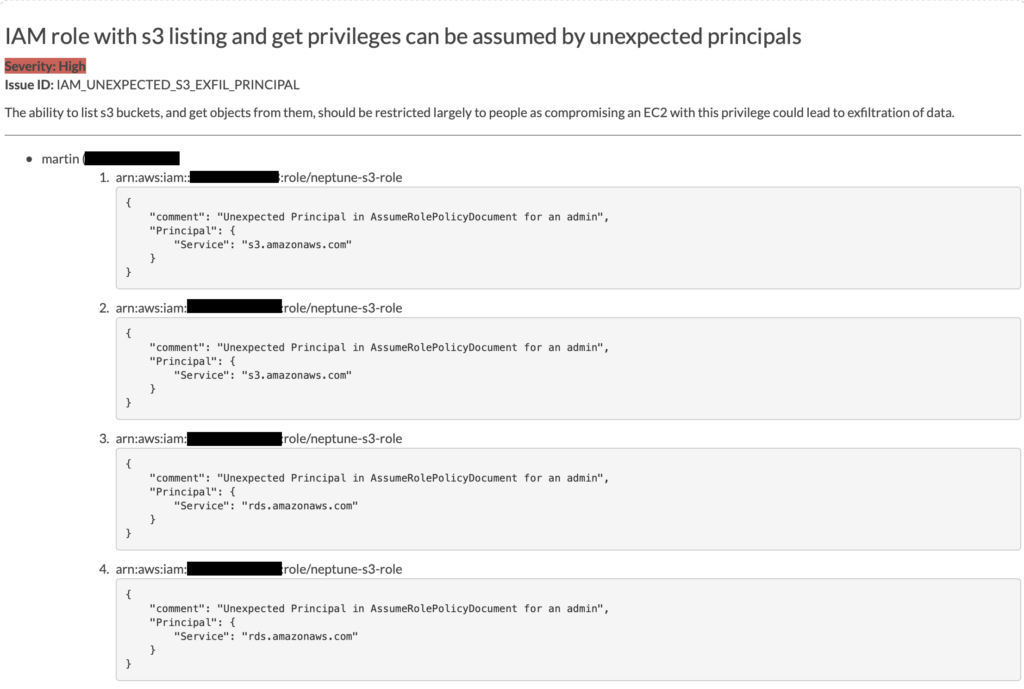
Here, the scan is reporting that one policy defines services instead of people as Principals listing S3 buckets. This policy was defined to allow database services to read/list the S3 bucket. You can then assess your own risk and take adequate measures if applicable.
Note: this environment is already destroyed and therefore the finding is no longer relevant.
As mentioned before, there are notable issues to take into consideration when opting for a community project like this one. One might be continuation (for example, the visualization module is no longer maintained). Some unsupported features will not be extended any further as a result.
On the other hand, security auditing has a great variety of checks against your AWS infrastructure, but it will probably not rival most of the commercial solutions available due to their continuous evolution and support. At the time of writing (February 2023), the latest version and functional changes date from November 2021.
Despite all the limitations mentioned before, I think CloudMapper is a great fit for a first assessment of environments where no other tools have been implemented yet. The visualization tool may represent misconfigurations, such as unintended public accesses or idle EC2 instances, with just a browser and a few commands. Furthermore, the security audit report will be offering a set of findings where lots of them would be low-hanging fruits to solve.
It is also possible to implement a regular, scheduled run of CloudMapper for security auditing and create notifications to other channels. The authors have implemented a multi-account example with nightly runs and Slack notifications. It can be used as a complement to other checks you already have in place, with minimal configuration.
Finally, if your security auditing processes are relying entirely on open-source, this is one of the pieces you may want in your arsenal. It serves two major observability purposes within a single tool, and it is compatible with other more-specific software.