Contact

Big Data has gone beyond the realms of merely being a buzzword. It is now vastly adopted among companies and corporates, irrespective of size. Even so, many companies are still grappling with the huge plethora of information that’s coming their way.
Forrester researchers have come up with the eye-opening statistic that Big Data technology has been adopted by 40% of the firms in 2016, and more companies (prediction says 30%) are joining the bandwagon in the next 12 months.
New data technologies are entering the market, but the old ones are also going strong. However, it is important to note here that the adoption of Big Data technologies will never slow down, at least not anytime in the near future. So it is important to note how we can overcome the challenges that come with this technology. This article sheds more light on this aspect.
With the huge onslaught of data that’s coming in, businesses have tried different methods to handle them all. Conventional database systems have been replaced with horizontal database, columnar designs and cloud enabled schemas. Even so, the role of quality analysis is still teetering on toddler legs because, in order to Big Data applications, you need a specific mindset, skills and knowledge, followed by a knowledge of data science.
As per Gartner, “Big Data is high-volume, high-velocity and/or high-variety information assets that demand cost-effective, innovative forms of information processing that enable enhanced insight, decision making, and process automation."
In simple words, Big Data refers to huge quantities of data. True, there is no particular size parameter to define the size of this technology. It is safe to assume that the standard way to measure it comes in terabytes or petabytes. Data comes in from all directions, and the volume and velocity would be monstrous.
Data gets replaced at a rapid pace and hence the need for processing becomes higher, especially when it is related to social media feeds. But that is not the only medium through which information comes in. It could come from a variety of sources and number of formats. If you check a data repository, you can see text files, images, audio files, presentations, video files, spreadsheets, databases and email messages. Depending on the requirement, the format and structure for the data could vary.
The data collected from mobile devices, digital repositories and social media can be unstructured and structured. Structure data, of course, is very easy to analyze. Unstructured data like voice, emails, video and documents are difficult to analyze and take up a lot of resources.
One of the most reliable solutions for database management system is the relational database management system or RDBMS, the leading players in the solution being Microsoft, IBM and Oracle. RDBMS uses structured query language or SQL to manage the data, define, query and update it.
Still, when the data size is tremendous, RDBMS finds it difficult to handle, and even if it does, the process will be very expensive. This proves that relational databases do not have the ability to handle big data, and new technologies are required. Traditional databases are perfect for structured data, but not for unstructured data.
The wave of information that keeps coming in is characterised by the 3V’s:
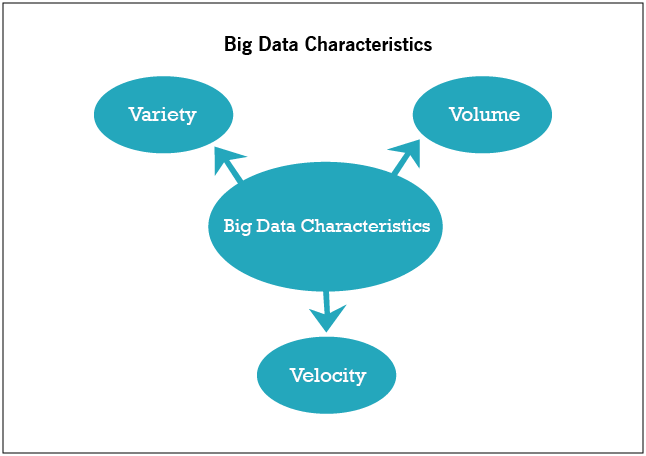
Volume is perhaps the most associated V with respect to big data. Here, you deal with incomprehensible options of data. An example would be Facebook with its immense capacity to store photos. It is believed that Facebook is storing more than 250 billion images (as of 2015 records), and the numbers will only keep growing. 250 billion images a day is just a drop in the bucket. Considering the fact that people upload more than 900 million photos a day, the numbers are staggering.
And in YouTube, about 300 hours worth of videos are uploaded since almost everybody has a smartphone these days. Vendors have begun to manage their app data in the cloud, and SaaS app vendors have huge amounts of data to store.
Velocity is all about the measure of data that’s coming in. Take the example of Facebook. Look at the amount of photos it has to process, store and then retrieve. In the initial stages of data acquiring, companies used to do batch processing of the information that’s coming in.
The data is fed into the server, and then it waits for the result. However, this can work only when the incoming data is slow, and with the speed at which data can be acquired now, it is possible to have a waiting period, however short that maybe. Information keeps coming in from all directions in real time, and you need to make them coherent enough to analyze and draw conclusions.
There are all kinds of data - structured, unstructured and semi-structured. You will have photographs, encrypted packets, tweets, sensor data and plenty more of this kind. Data is not something given to you in a spreadsheet any more. When data comes in the structured format, things become easier, but when they come in the form of photos, videos, audio recordings, books, geospatial data, presentations, email messages, posts & comments, documents, tweets and ECG strips, you have them unstructured and overflowing.
Finding a pattern from this insane flow of data is not easy, and the process to make them coherent is known as data analytics. And each of the data collected would require particular technologies and analytic methods to get a clear picture of what they indicate, making the information valuable.
As explained earlier, data is something that provides information and this is used for analysis and drawing conclusions. Data comes in different sizes, formats, etc. Hence, the three different categories:
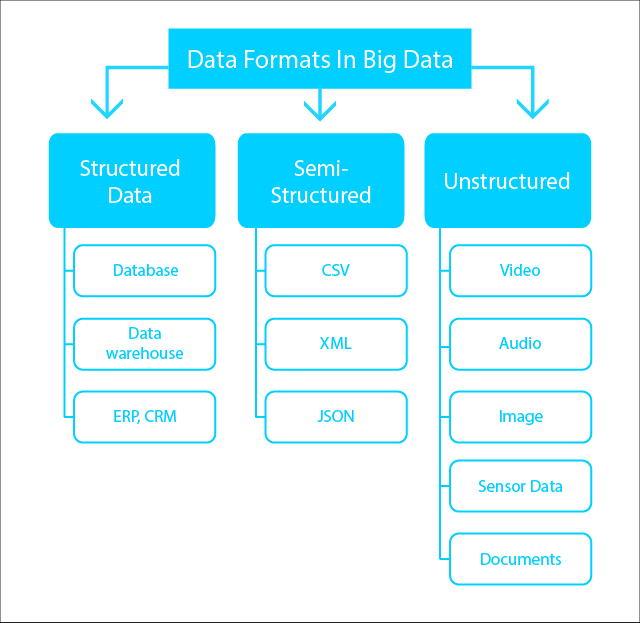
Structured data can be easily utilised, because they do have a definite structure and are well organised. An example would be a spreadsheet where information is available in a tabulated form. Identifying patterns and extracting useful and actionable insights would be easier. The data is also stored in a relational DB, and pulled easily.
Understandably, structured data is the most processed of all information and can be managed easily. They have a relational key and can be easily mapped into predesigned fields.
They are huge amounts of data stored in no particular pattern. But to gauge an understandable pattern from it, you need the help of sophisticated tools and technologies. Examples would be videos, web pages, emails, PowerPoint presentations, location coordinates, streaming data, etc. This lack of structure makes it difficult to manage the data from a relational DB.
80% of the data that’s found online is unstructured. However, these kinds of data do have some sort of internal structure, but they don’t neatly fit in any database. Exploiting unstructured data to its full advantage would help you make critical business decisions.
This kind of data is not rigidly organised and can be utilised after a little bit of sifting, processing & conversion. Softwares like Apache Hadoop are used for this. However, these are not stored in the relational DB. In fact, semi structured data can be called structured data that is available in an unorganised manner.
Examples of such kind of information comes in the form of web data such JSON (JavaScript Object Notation) files, tab-delimited text files, .csv files, BibTex files, XML and other markup languages. Having a semi-structure makes it easier to ease up space, clarify and compute data. They come with organisational properties that makes analysis easy.
As Big Data is described through the above-mentioned three Vs, you need to know how to process all this data through its various formats at high speed. This processing can be split into three basic components. To be successful, testers will have to be aware of these components.
1. Data Validation: Understandably, this is one of the most important components of data collection. To ensure the data is not corrupted or is accurate, it is important that it is validated. For this purpose, the sources will be checked. The information procured is validated against actual business requirements. The initial data will be fed into Hadoop Distributed File System (HDFS), and this will also be validated. The file partition will be checked thoroughly, followed by copying them into different data units. Tools like Datameer, Talent and Informatica are used for step-by-step validation.
Data validation is also known as pre-Hadoop testing, and makes it certain that the collected data is from the right resources. Once that step is completed, it is then pushed into the Hadoop testing system for tallying with the source data.
2. Process Validation: Once the data and the source are matched, they will be pushed to the right location. This would be the Business Logic validation or Process Validation, where the tester will verify the business logic, node by node, and then verify it against different nodes. Business Logic Validation is the validation of Map Reduce, the heart of Hadoop.
The tester will validate the Map-Reduce process and check if the key-value pair is generated correctly. Through “reduce” operation, the aggregation and consolidation of data is checked out.
3. Output Validation: Output validation is the next important component. Here the generated data is loaded into the downstream system. This could be a data repository and the data goes through analysis and further processing. This is then further checked to make sure the data is not distorted, by comparing HDFS file system with target data.
Architecture testing is another crucial part of Big Data testing, as having poor architecture will make the whole effort go wasted. Luckily, Hadoop is highly resource intensive, and is capable of processing huge amounts of data and for this, architectural testing becomes mandatory. It is also important to ensure that there is no data corruption, and compare the HDFS file system data with target UI or business intelligence system.
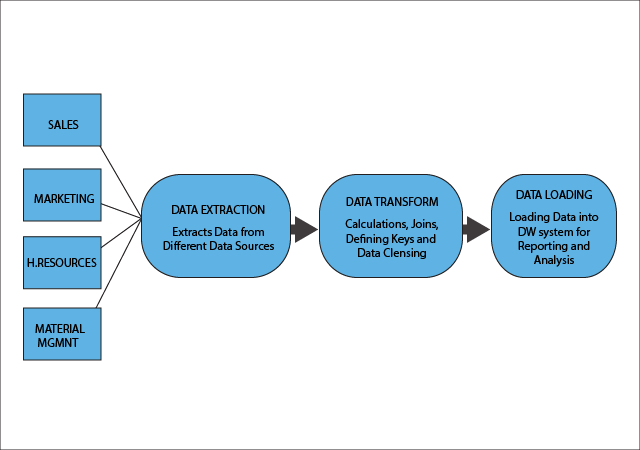
ELT is the acronym for Extract, Transform and Load, and has been around for a very long time because it is associated with traditional batch processing in data environment. The function of data warehouses is to provide businesses with data that they can consolidate, analyze and make coherent ideas of data that is relevant to their focus/goals. There are ETL tools through which the raw data is converted into a meaningful format. The tool also helps them to convert the data into a format that could be used by the businesses. Software vendors like IBM, Pervasive, Pentaho, etc. provide ETL software tools.
Extract - Once the data is collected, it would be extracted/read from the source database. This is done to all the databases.
Transform - Transformation of the data is done next. The data format is changed into usable chunks, and must conform to the requirements of the target database.
Load - This is the final stage where you write data to the target database.
To ensure that the data procured in this manner is trustworthy, tools for data integration processes like data profiling, cleansing, auditing are all integrated with data quality tools. This entire process will ensure that you have extracted actual data. ETL tools are also important for loading and converting both structured and unstructured data into Hadoop. It also depends on the kind of ETL tools that you use. Highly advanced ones lets you convert multiple simultaneously.
The data processing segment in a data warehouse, follows a three-layer architecture during ETL process.
The staging area is a temporary location or a landing zone where data from all the resources is stored. This zone ensures that all the data is available before they are integrated into the Data Warehouse. It is imperative for the data to be placed somewhere because of varying business cycles, hardware limitations, network resource limitations and data processing cycles. You cannot extract all the data from all the databases at the same time. Hence, data in the data warehouse is transient.
This is the foundation of next-generation analytics and contributes to business intelligence. The data integration layer is a combination of semantic, reporting and analytical technologies, based on the semantic knowledge framework. Data is arranged in hierarchical groups known as facts and converted into facts and aggregated facts. This layer is the link between the staging layer and the database.
Using common business terms, users will be able to access the data from the warehouse. The Access Layer is what the users can access, and the users themselves know what to make of the data. It is almost like a virtual layer, because it doesn’t store information. The layer contains data targeted to a specific population, making access and usage easier.
Through Big Data testing, you can ensure the data in hand is qualitative, accurate and healthy. The data you had collected from different sources and channels are validated, aiding in better decision making. There are several benefits to Big Data testing.
Better Decision Making - When data gets in the hands of the right people, it becomes an asset. So when you have the right kind of data in hand, it would help you make sound decisions. It lets you analyse all the risks and make use of only the data that will contribute to the decision making process.
Data Accuracy - Gartner says that data volume is likely to expand by 800% in the next 5 years, and 80% of this data will be unstructured. Imagine the volume of data that you have to analyse. You need to convert all this data into a structured format before it can be mined. Armed with the right kind of data, businesses can focus on their weak areas, and be better prepared to beat the competition.
Better Strategy and Enhanced Market Goals - You can chart a better decision making strategy or automate the decision making process with the help of big data. Collect all the validated data, analyze it, understand user behavior and ensure all of them are realised in the software testing process, so you can deal out something they need. Big data testing helps you optimise business strategies by looking at this information.
Increased Profit and Reduced Loss - Loss in business will be minimal or even a thing of past, if data is correctly analysed. If the accumulated data is of poor quality, the business suffers terrible losses. Isolate valuable data from structured and semi-structured information so no mistakes are made when dealing with customers.
Transforming data with intelligence is a huge concern. As big data is integral to a company’s decision making strategy, it is not even possible to begin asserting the importance of arming yourself with reliable information.
Big Data processing is a very promising field in today’s complex business environment. Applying the right dose of test strategies, and following best practices would help ensure qualitative software testing. The idea is to recognise and identify the defects in the early stages of testing and rectify them. This helps in cost reduction and better realization of company goals. Through this process, the problems that testers faced during software testing are all solved now because the testing approaches are all driven by data.
Facing problems with Big Data Testing? Don't worry, we can guide you to implement the perfect big data test strategy for your business.


YOU WILL BE HEARING FROM US SOON!
We look forward to hearing from you!
YOU WILL BE HEARING FROM US SOON!