Ecommerce has become a very competitive industry where data is king, your numbers speak for your success and give a clear picture of all the areas of improvement, all with rock solid and real-time numerical. But all this is only possible if you can get access to all these figures in a well-structured and visually evident manner. A Power BI ecommerce dashboard serves all these purposes and serves as a road map to success with valuable insights into crucial metrics like sales performance, inventory levels, customer demographics, and website traffic.
With the exceptional flexibility this powerful tool offers, businesses can concentrate on key performance indicators (KPIs) that promote expansion and profitability. From identifying emerging trends to optimizing marketing strategies, the advanced analytics and visualization capabilities of Power BI development services can revolutionize the way you understand and grasp your data.
Overview and Importance of Power BI Ecommerce Dashboard
A Power BI ecommerce dashboard is a visual representation of data related to an online business. It provides real-time insights into key metrics such as sales performance, inventory levels, customer demographics, and website traffic. These dashboards are highly customizable, allowing users to focus on specific KPIs (Key Performance Indicators) that matter most to their business.
- Real-time Data Analysis: Power BI ecommerce dashboards offer real-time data analysis, enabling ecommerce businesses to make informed data driven decisions quickly. This is crucial in a fast-paced environment where trends can change rapidly.
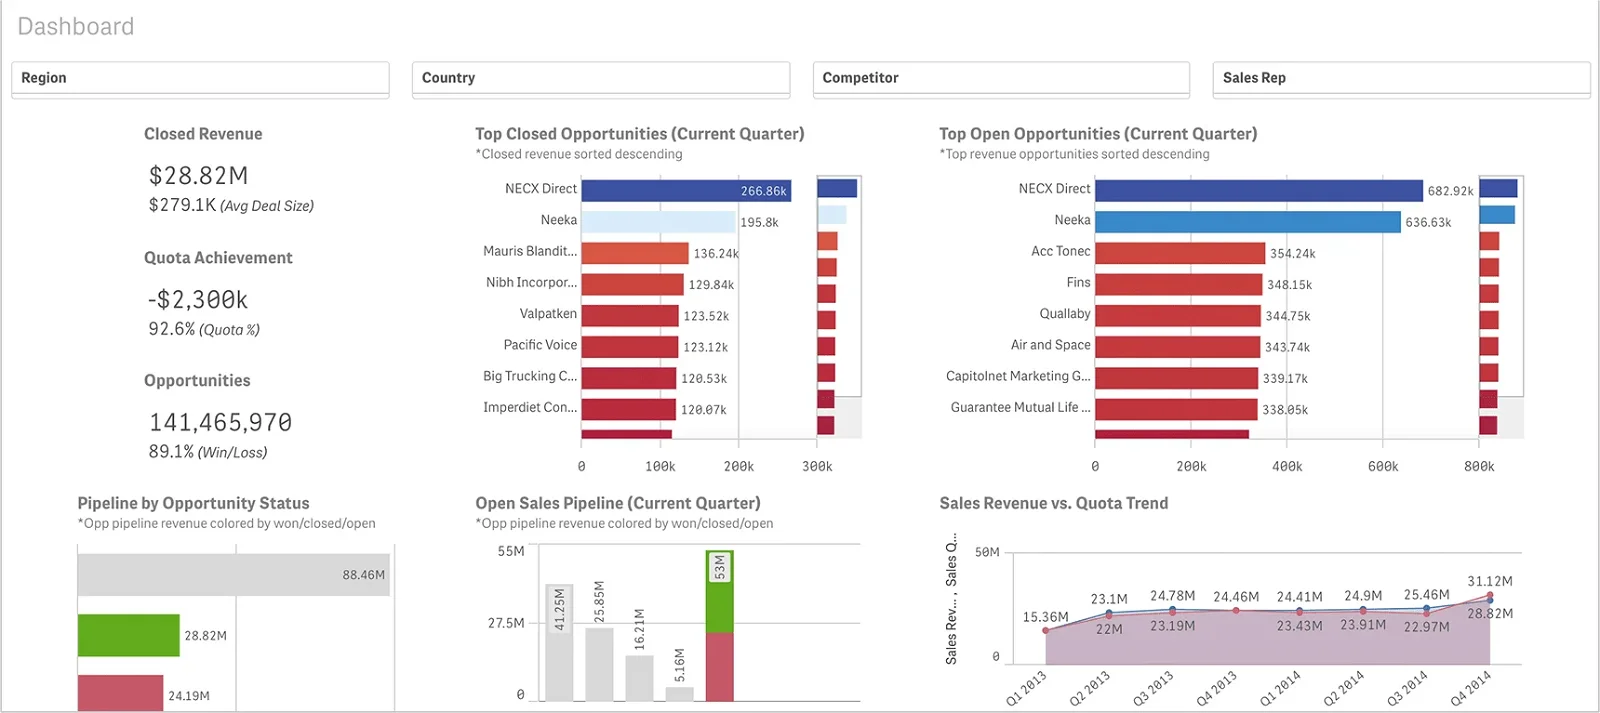
- Sales Performance Monitoring: Ecommerce dashboard in Power BI enables monitoring of sales performance, including revenue, profit margins, and product performance. This allows businesses to identify top-selling products and optimize pricing strategies.
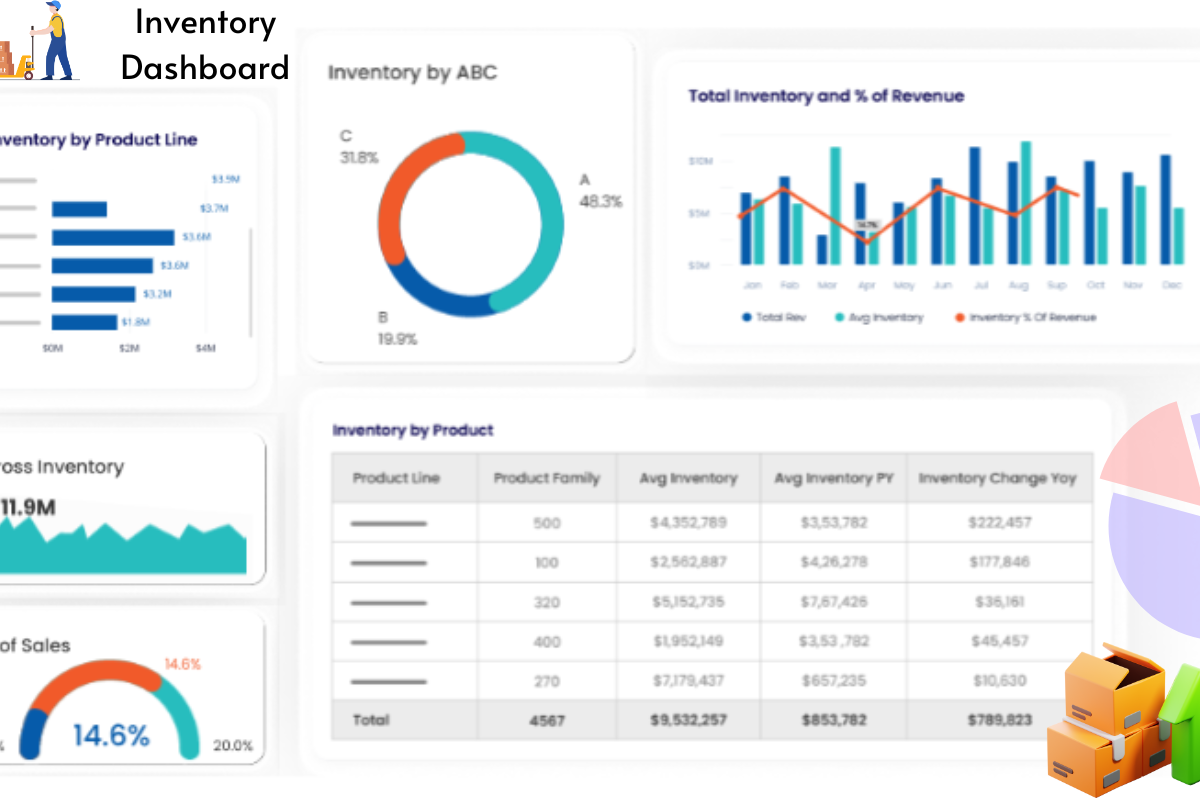
- Inventory Management: By tracking inventory levels and sales trends, businesses can ensure they have the right products in stock at the right time, minimizing stockouts and overstock situations.
- Customer Insights: Understanding customer behavior is key to success in online business. Power BI dashboards provide insights into customer demographics, purchase history, and preferences, allowing businesses to tailor their marketing efforts accordingly.
- Marketing Optimization: Ecommerce dashboards help analyze the effectiveness of marketing campaigns, including ROI (Return on Investment) and customer acquisition costs. This allows businesses to optimize their marketing strategies for better results.
- Competitive Analysis: By comparing their performance with competitors, ecommerce businesses can identify strengths and weaknesses, Microsoft Power BI enables them to stay ahead in the market.
Power Up Your Business Intelligence with Power BI
Turn complexity into clarity with our user-friendly Power BI solutions.
Key Metrics for Ecommerce Power BI Dashboard
In the world of e-commerce, knowledge is as valuable as the metrics on which it is based. Here’s a look at the key performance measures that are critical for any e-commerce practitioner:
1. Sales Metrics
- Total Sales: This metric provides a comprehensive view of your ecommerce revenue, allowing you to track your performance over time and compare it to previous periods. By analyzing total sales data, you can identify trends and patterns that can help you make strategic decisions to boost sales.
- Sales Growth Rate: Monitoring the sales growth rate helps you understand how your business is performing compared to previous periods. It provides valuable insights into the effectiveness of your marketing strategies and sales initiatives, allowing data-driven decision-making to drive growth.
- Average Order Value (AOV): The AOV metric helps you understand the average amount spent by customers per order. By tracking this metric, you can identify opportunities to increase revenue by encouraging customers to spend more per transaction.
- Sales by Channel: This metric provides a breakdown of sales by different channels, such as your website, mobile app, and social media platforms. By analyzing sales data by channel, you can identify the most effective channels for driving sales and allocate your marketing budget accordingly.
2. Customer Metrics
- Customer Acquisition Cost (CAC): CAC is the cost incurred to acquire a new customer. By tracking this metric, you can evaluate the effectiveness of your marketing campaigns and customer acquisition strategies, helping you optimize your marketing budget and improve ROI.
- Customer Lifetime Value (CLTV): CLTV is the predicted revenue a customer will generate over their lifetime. By calculating CLTV, you can identify high-value customers and tailor your marketing strategies to retain and maximize their value.
- Repeat Purchase Rate: This metric measures the percentage of customers who make more than one purchase. By tracking this metric, you can gauge customer loyalty and satisfaction, allowing you to implement strategies to increase repeat purchases.
- Churn Rate: The churn rate measures the percentage of customers who stop purchasing from your ecommerce store. By monitoring the churn rate, you can identify factors contributing to customer attrition and implement retention strategies to reduce churn.
3. Product Metrics
- Best-selling Products: This metric identifies the top-selling products by revenue or quantity. By analyzing best-selling products, you can identify trends and preferences among your customers, helping you optimize your product offerings and marketing strategies.
- Inventory Turnover Rate: The inventory turnover rate measures the number of times inventory is sold and replaced in a given period. By tracking inventory turnover rate, you can optimize your inventory management practices, reduce carrying costs, and improve cash flow.
- Product Performance Trends: This metric analyzes the performance of products over time, including sales trends and seasonality. By monitoring product performance trends, you can identify opportunities to promote top-performing products and optimize inventory levels.
4. Marketing Metrics
- Conversion Rate: Conversion rate measures the percentage of website visitors who make a purchase. By tracking conversion rates, you can evaluate the effectiveness of your website and marketing campaigns, helping you identify areas for improvement and optimize conversion rates.
- Cost per Acquisition (CPA): CPA measures the cost incurred to acquire a new customer. By tracking CPA, you can evaluate the efficiency of your marketing campaigns and customer acquisition strategies, helping you allocate your marketing budget more effectively.
- Return on Ad Spend (ROAS): ROAS measures the revenue generated for every dollar spent on advertising. By tracking ROAS, you can evaluate the effectiveness of your advertising campaigns and optimize your advertising budget to maximize ROI.
5. Website Metrics
- Traffic Sources: This metric identifies the channels driving traffic to your ecommerce website, such as organic search, paid search, and social media. By analyzing traffic sources, you can identify the most effective channels for driving traffic and optimize your marketing strategies accordingly.
- Bounce Rate: Bounce rate measures the percentage of visitors who leave your website without taking any action. By tracking bounce rates, you can identify potential issues with your website’s user experience and implement strategies to improve engagement and reduce bounce rates.
- Average Session Duration: Average session duration measures the average time visitors spend on your website. By tracking average session duration, you can gauge the effectiveness of your website’s content and user experience, helping you optimize your website for better engagement.
6. Customer Service Metrics
- Response Time: Response time measures the average time taken to respond to customer inquiries or complaints. By monitoring response time, you can ensure timely and efficient customer service, enhancing customer satisfaction and loyalty.
- Customer Satisfaction (CSAT) Score: The CSAT score measures the percentage of customers who are satisfied with their shopping experience. By tracking CSAT scores, you can identify areas for improvement and implement strategies to enhance customer satisfaction.
- Net Promoter Score (NPS): NPS measures the likelihood of customers recommending your ecommerce store to others. By tracking NPS, you can gauge customer loyalty and advocacy, helping you identify opportunities to improve customer loyalty and retention.
7. Operational Metrics
- Fulfillment Time: Fulfillment time measures the time taken to process and fulfill orders. By tracking fulfillment time, you can optimize your order fulfillment process, reducing delivery times and improving customer satisfaction.
- Order Accuracy Rate: The order accuracy rate measures the percentage of orders that are fulfilled accurately. By monitoring the order accuracy rate, you can identify areas for improvement in your order fulfillment process and reduce errors.
- Return Rate: The return rate measures the percentage of orders that are returned by customers. By tracking return rates, you can identify product or service issues and implement strategies to reduce returns and improve customer satisfaction.
8. Financial Metrics
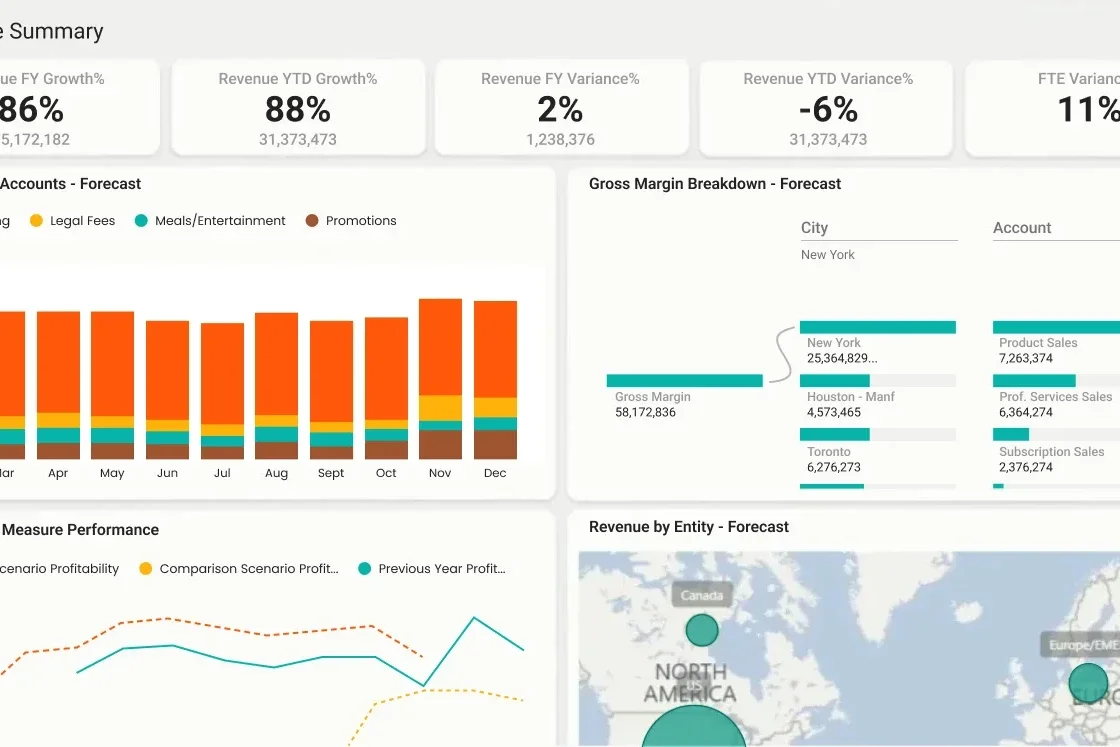
- Gross Profit Margin: Gross profit margin measures the percentage of revenue that exceeds the cost of goods sold. By tracking gross profit margin, you can evaluate the profitability of your ecommerce business and identify opportunities to improve margins.
- Operating Expense Ratio: The operating expense ratio measures the ratio of operating expenses to revenue. By tracking the operating expense ratio, you can evaluate the efficiency of your operations and identify opportunities to reduce costs and improve profitability.
- Cash Conversion Cycle: The cash conversion cycle measures the time it takes for a dollar to flow through your ecommerce business. By tracking the cash conversion cycle, you can optimize your cash flow management and improve liquidity.
9. Social Media Metrics
- Engagement Rate: The engagement rate measures the percentage of users who interact with your social media content. By tracking engagement rates, you can gauge the effectiveness of your social media marketing efforts and optimize your content strategy to increase engagement.
- Social Media Followers: Social media followers measure the number of followers on your social media platforms. By tracking social media followers, you can evaluate the growth of your social media presence and identify opportunities to increase your follower base.
- Social Media Referral Traffic: Social media referral traffic measures the traffic generated to your ecommerce website from social media
Types of Power BI Ecommerce Dashboard
Power BI offers a variety of dashboard types tailored to enhance your ecommerce analytics and decision-making. All dashboards are specifically designed for various requirements while delivering unique perspective on different elements of your business functioning. By monitoring sales patterns and customers’ behavior to measure the success of the products and the marketing campaigns as well, Microsoft Power BI’s diverse dashboard types give you informative data to run your eCommerce business effectively leading to growth.
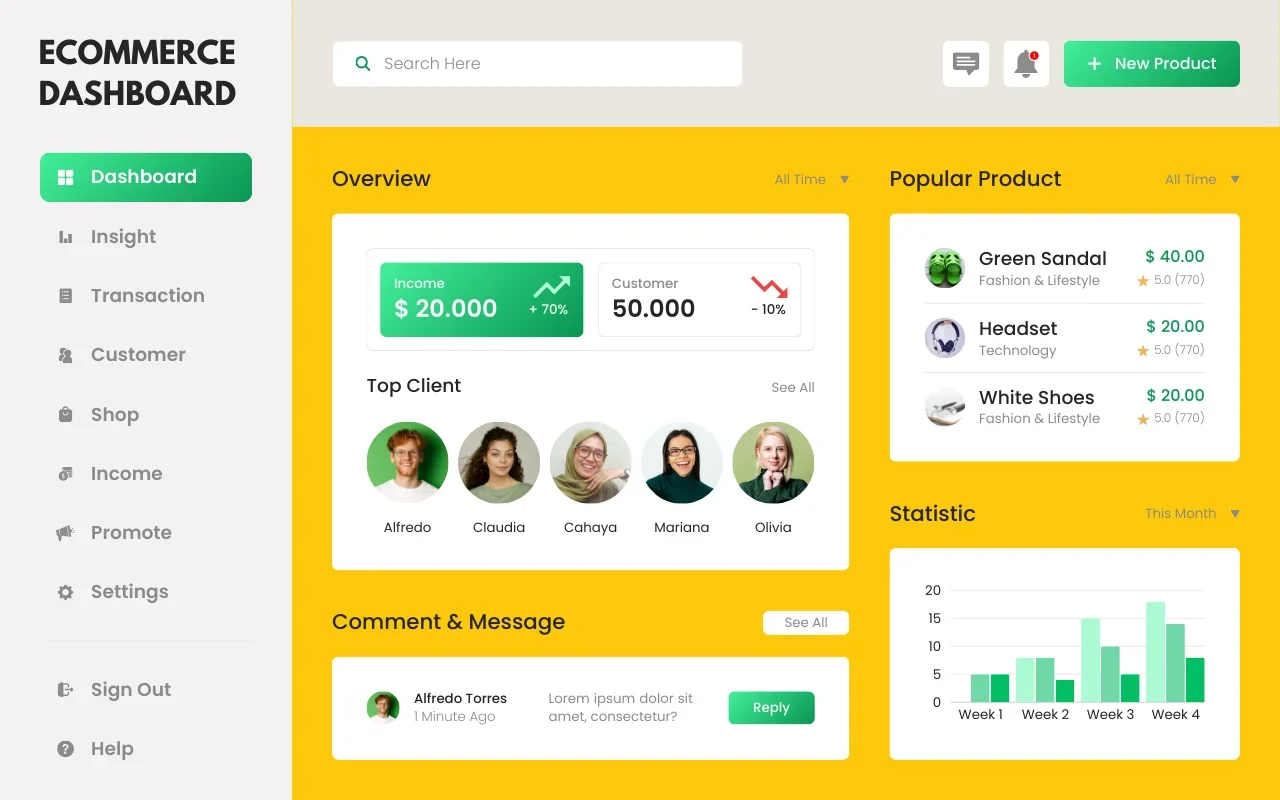
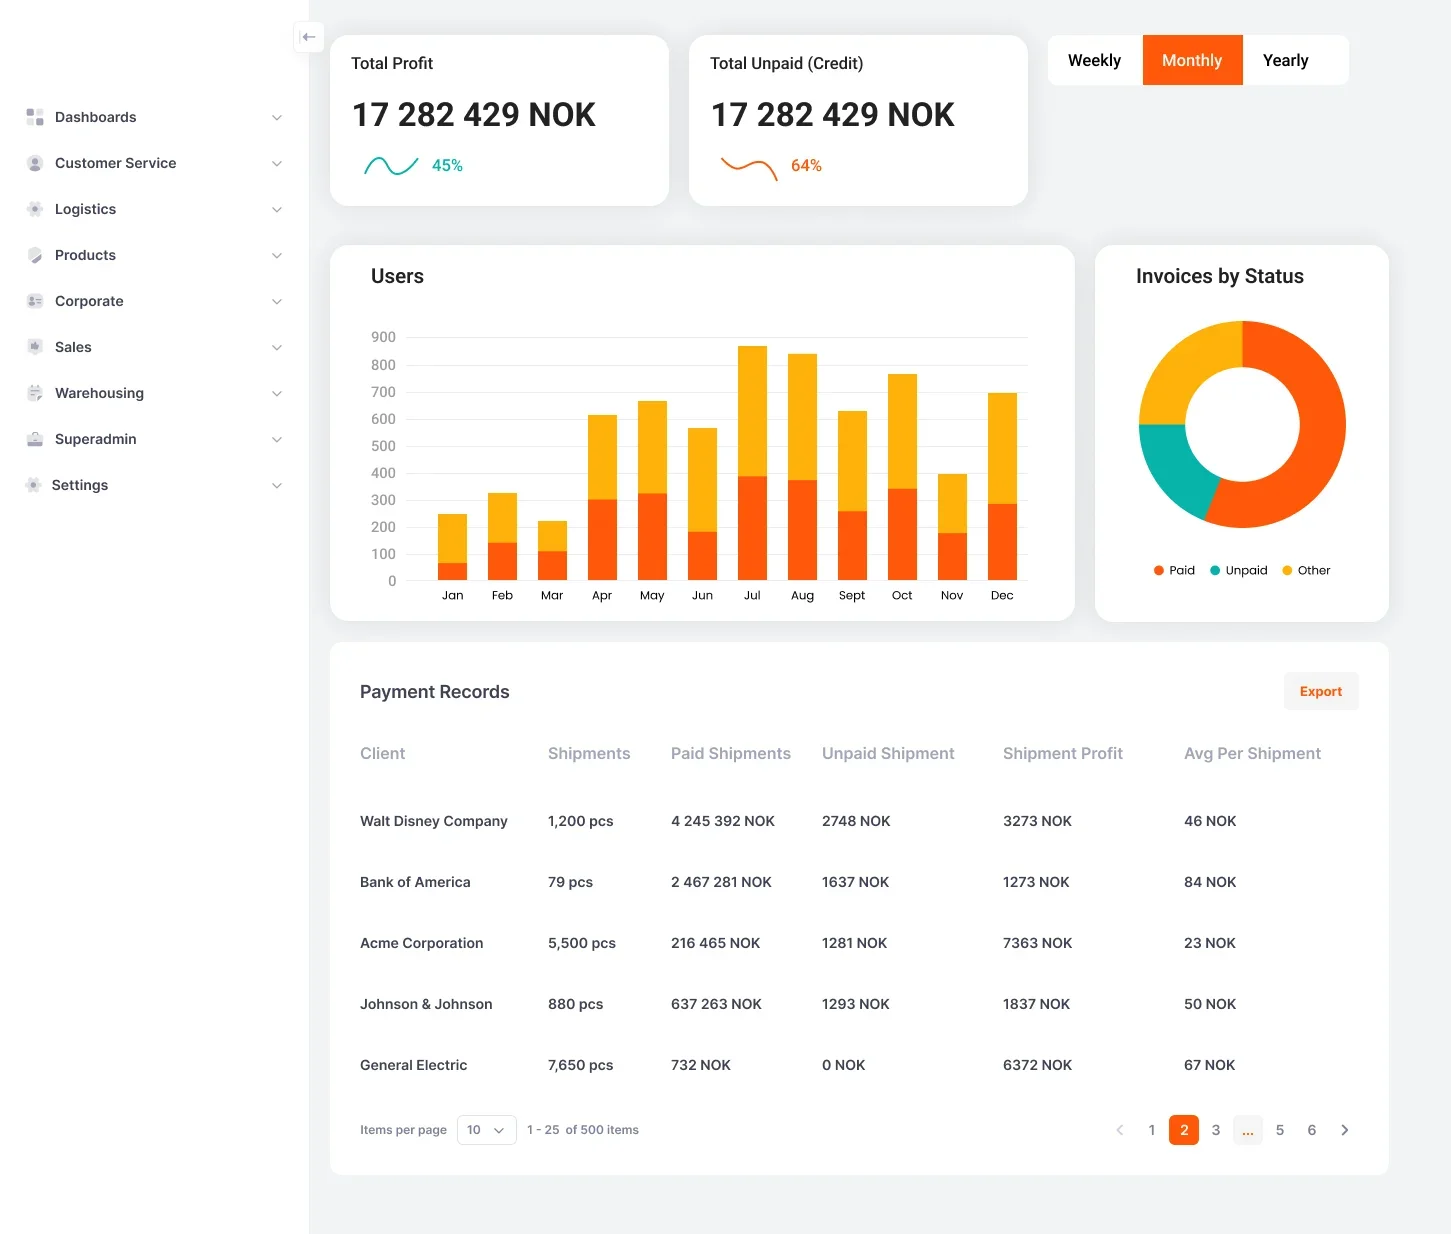
Sales Dashboard: The sales dashboard focuses on key sales metrics, such as total sales, average order value, and sales by product category or region. Include visualizations like line charts, bar charts, and pie charts to easily interpret the data. Whether you’re tracking daily, weekly, or monthly sales trends, the sales dashboard provides a holistic view of your sales performance, empowering you to optimize strategies and achieve your business goals.
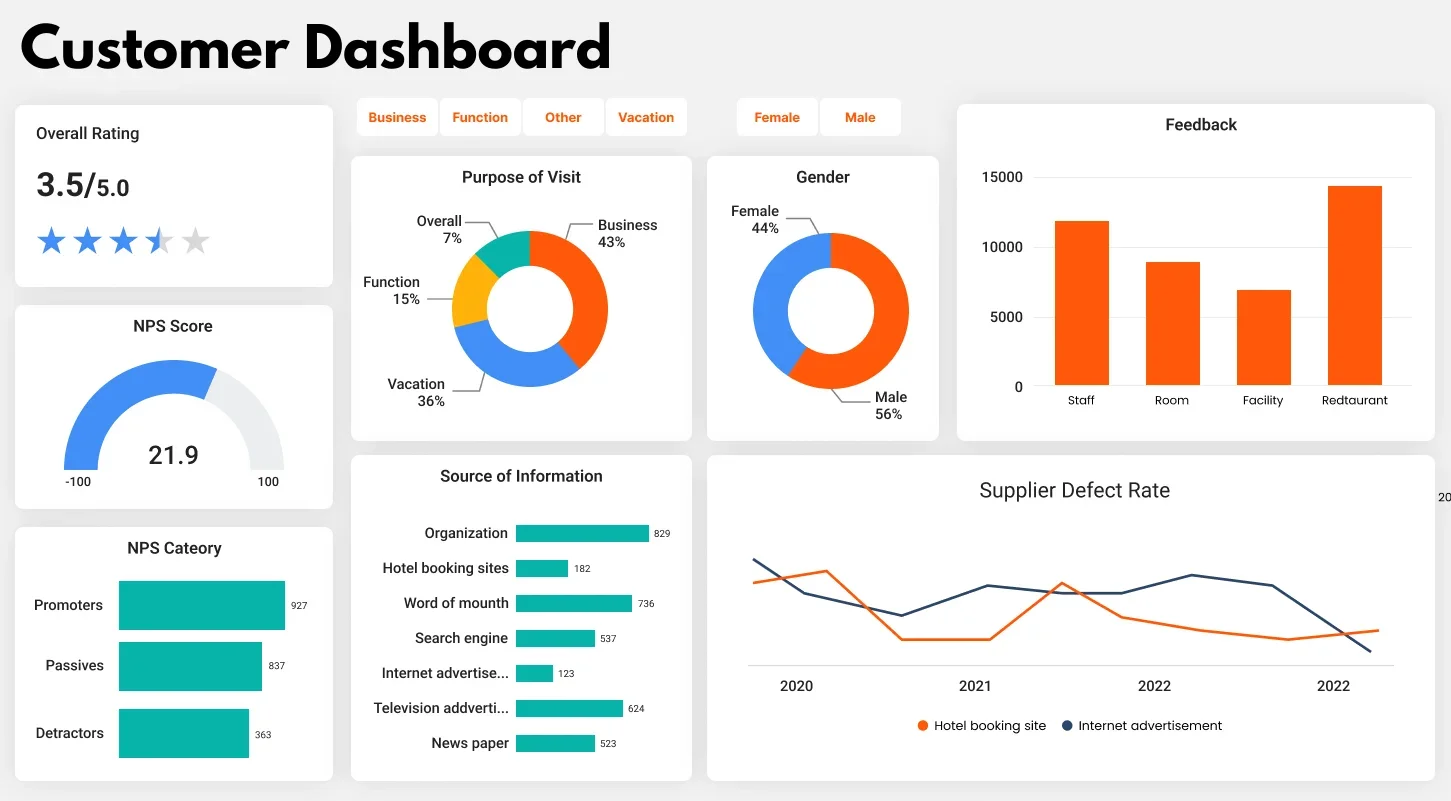
Customer Dashboard: The Customer Dashboard helps you gain insights into customer behavior and preferences. Include metrics like customer lifetime value, repeat purchase rate, and customer segmentation. Visualizations like customer demographics, heatmaps, and cohort analysis can help you understand your customer base better.
Product Dashboard: The Product Dashboard should help you analyze the performance of your products. Include metrics like best-selling products, inventory levels, and product performance over time. Visualizations like product sales trends, inventory turnover, and product profitability can help you make informed data driven decisions about your product offerings.
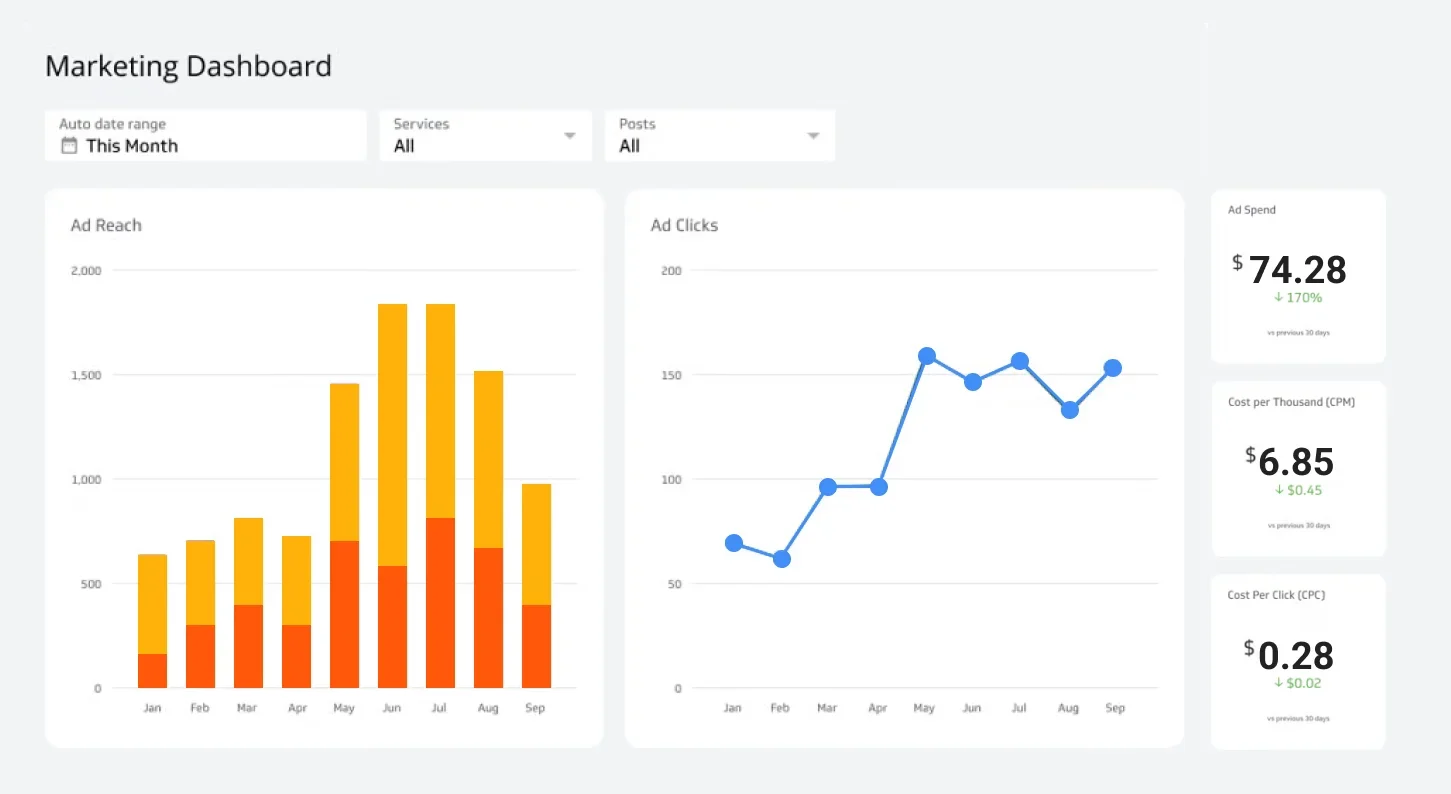
Marketing Dashboard: The Marketing Dashboard should track the effectiveness of your marketing campaigns. Include metrics like ROI, customer acquisition cost, and conversion rates. Visualizations like campaign performance, channel attribution, and customer journey analysis can help you optimize your marketing efforts.
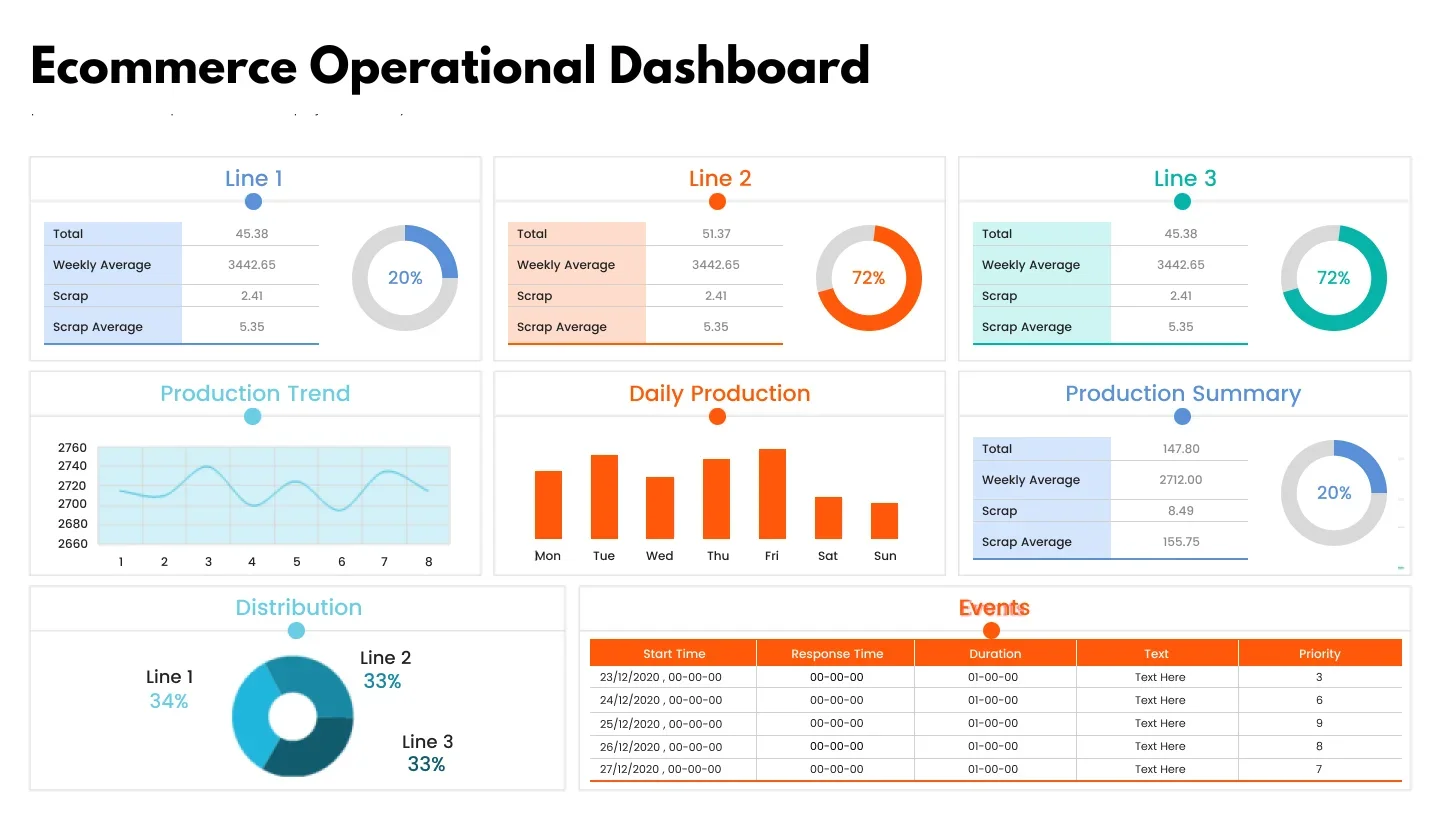
Operational Dashboard: The Operational Dashboard should focus on operational efficiency and performance. Include metrics like order fulfillment rate, inventory turnover, and shipping times. Visualizations like order processing times, inventory levels, and supply chain performance can help you identify areas for improvement.
Advanced Analysis and Insights in Ecommerce Power BI Dashboard
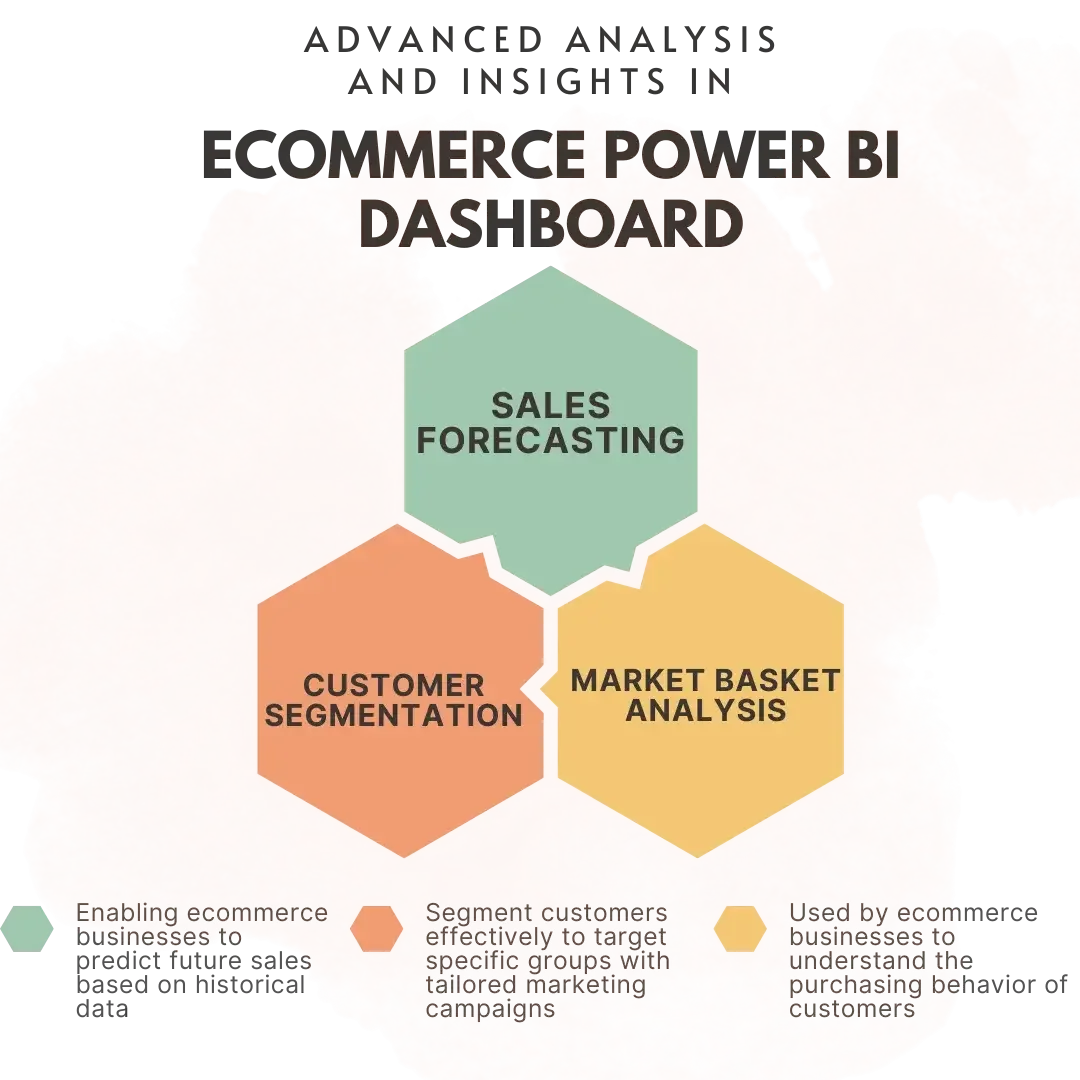
In ecommerce, keeping up requires more than just basic analytics. That’s where the Advanced Analysis and Insights in Ecommerce Power BI Dashboard come in. This powerful tool goes beyond the basics, providing deep, actionable insights for your business. From understanding customer behavior to identifying trends, this dashboard uses cutting-edge data visualization and analytics to help you make smarter data-driven decisions. Defined with easy-to-use as the main ingredient, it is an indispensable tool for any eCommerce company that is on its way to reaching the top analytical level.
1. Sales Forecasting
Power BI offers robust tools for sales forecasting, enabling ecommerce businesses to predict future sales based on historical data. By analyzing past sales performance, seasonal trends, and market conditions, Power BI can generate accurate forecasts, helping businesses make informed decisions regarding inventory management, marketing strategies, and resource allocation.
2. Customer Segmentation
With Power BI dashboard development, ecommerce businesses can segment customers effectively to target specific groups with tailored marketing campaigns. By analyzing customer data such as purchase history, demographics, and behavior patterns, Power BI can categorize customers into segments, allowing businesses to personalize their marketing efforts and improve customer engagement and retention.
3. Market Basket Analysis
Market basket analysis is a technique used by ecommerce businesses to understand the purchasing behavior of customers. Power BI can analyze transaction data to identify patterns and associations between products purchased together. This insight can help businesses optimize product placement, pricing strategies, and promotional offers, ultimately increasing sales and customer satisfaction.
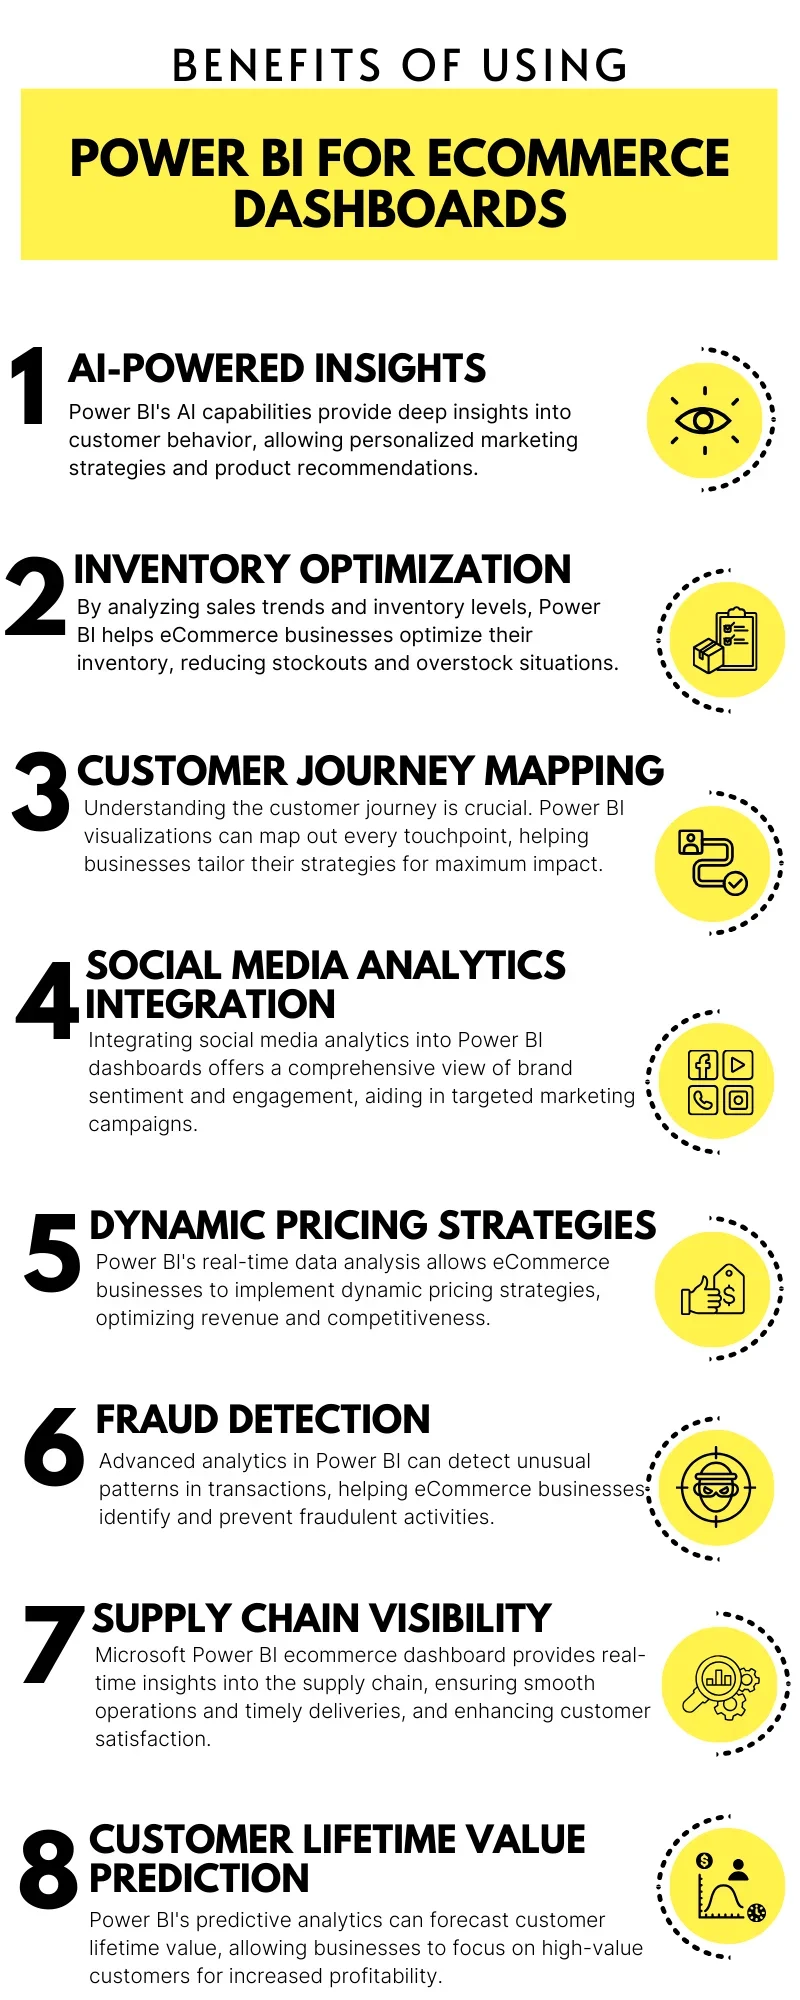
Benefits of Using Power BI for Ecommerce Dashboards
The utilization of Power BI in e-commerce goes beyond just gaining clarity on the present; it’s a strategic tool that empowers businesses to analyze real-time data, identify trends, optimize operations, and make informed decisions to shape a successful future.
Conclusion
Power BI is a technology, not just a trend and in this digital era, the ones who do not adapt will perish. In this hyperconnected marketplace where amazing tools like the Power BI dashboard are at your disposal, the only limit is your imagination. Power BI ecommerce dashboard provides a bird’s-eye view of your sales trends, inventory levels, and customer behavior, all in real-time, offering a comprehensive and intuitive platform to visualize and analyze your data.
Begin creating your Power BI E-commerce Dashboard immediately and see how your data transforms into meaningful, actionable plans. After all, in ecommerce, what you do with the data is more important than the data itself.
Sunflower Lab stands out as a premier provider of Power BI dashboard development services. From conceptualization to implementation, we ensure a seamless and efficient process, delivering impactful power BI development services that drive your business forward. Contact us today and seize the opportunity to upgrade your ecommerce strategy with our team of Power BI experts.
Our Power BI Solutions
Drive Success with Our Tech Expertise
Unlock the potential of your business with our range of tech solutions. From RPA to data analytics and AI/ML services, we offer tailored expertise to drive success. Explore innovation, optimize efficiency, and shape the future of your business. Connect with us today and take the first step towards transformative growth.
You might also like
Stay ahead in tech with Sunflower Lab’s curated blogs, sorted by technology type. From AI to Digital Products, explore cutting-edge developments in our insightful, categorized collection. Dive in and stay informed about the ever-evolving digital landscape with Sunflower Lab.