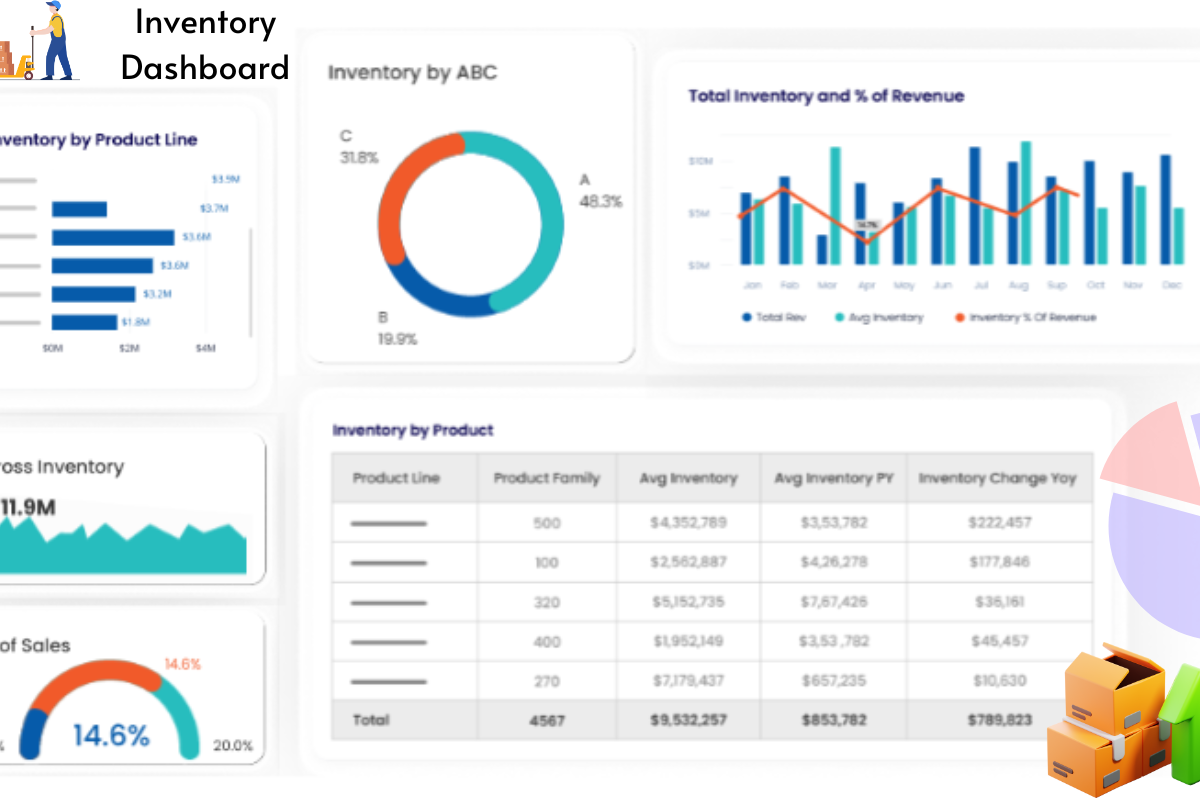
In the age of data-driven business operations, every decision is a substantial line of code in the software known as your company’s success. When it comes to inventory management, those lines of code translate into a dynamic representation of your stock, orders, and sales. Welcome to Power BI Inventory Dashboard, the powerhouse of business intelligence tools that can transform your inventory data into actionable insights.
From the complex interplay of stock levels to understanding customer purchase behavior, the Power BI Inventory Dashboard equips you to not only monitor but to predict and optimize your inventory strategies. Whether you’re a seasoned data analyst, an inventory manager with a thirst for analytics, or a Power BI enthusiast ready to maximize the true potential of your inventory data with the help of Power BI development services.
Transforming Complex Financial Data into Meaningful Insights
In today’s fast-paced business world, financial data is always changing. Businesses face challenges tracking and managing finances accurately and that is where Power BI consultants can make a meaninful impact. Microsoft Power BI accounting dashboards help by offering a comprehensive solution for ensuring financial accuracy. All the leading enterprises are actively looking for Power BI Development Services.
Microsoft Power BI is a robust tool by to aid businesses in visualizing and analyzing complex data sets. It allows users to easily connect, consolidate data sources and gain valuable insights from various sources, including accounting software like QuickBooks or Xero. With its user-friendly interface and advanced analytics, Power BI solutions is a top choice for organizations streamlining financial reporting processes.
What is the tax dashboard in Power BI?
The tax dashboard in Microsoft Power BI services is a powerful feature that helps businesses track and manage taxes effectively. Microsoft Power BI capabilities allows users from analyzing sales data to monitor key financial metrics and analyze tax-related data, such as sales tax, payroll taxes, income tax, cash flow and more for valuable insights. This dashboard provides a comprehensive view of all tax data in one centralized location, making it easier for businesses to make informed decisions about their finances.
How does the tax dashboard work?
The tax dashboard works by pulling data from various sources, including accounting software, spreadsheets, and other financial systems to gain valuable insights. It then transforms this data into interactive visualizations, such as charts and graphs, allowing users to understand trends and patterns in their tax data. Additionally, Microsoft Power BI services and Power BI dashboard development services can be customized to suit specific business needs and preferences.
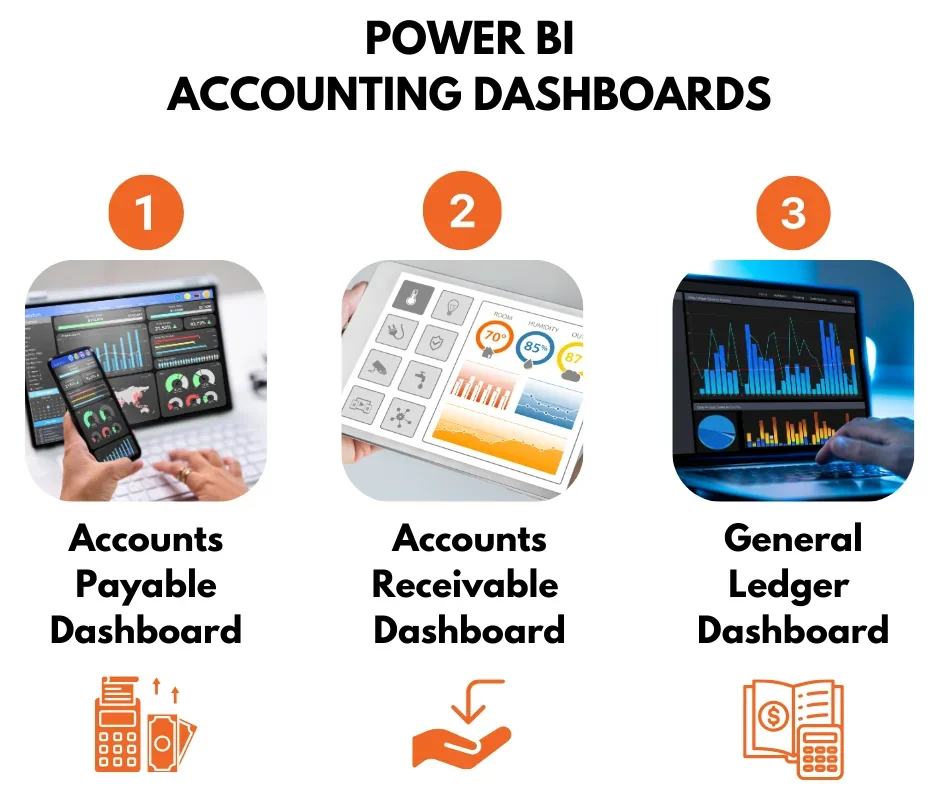
Types of Power BI Accounting Dashboard
Power Up Your Business Intelligence with Power BI
Turn complexity into clarity with our user-friendly Power BI solutions.
Power BI Accounts Payable Dashboard
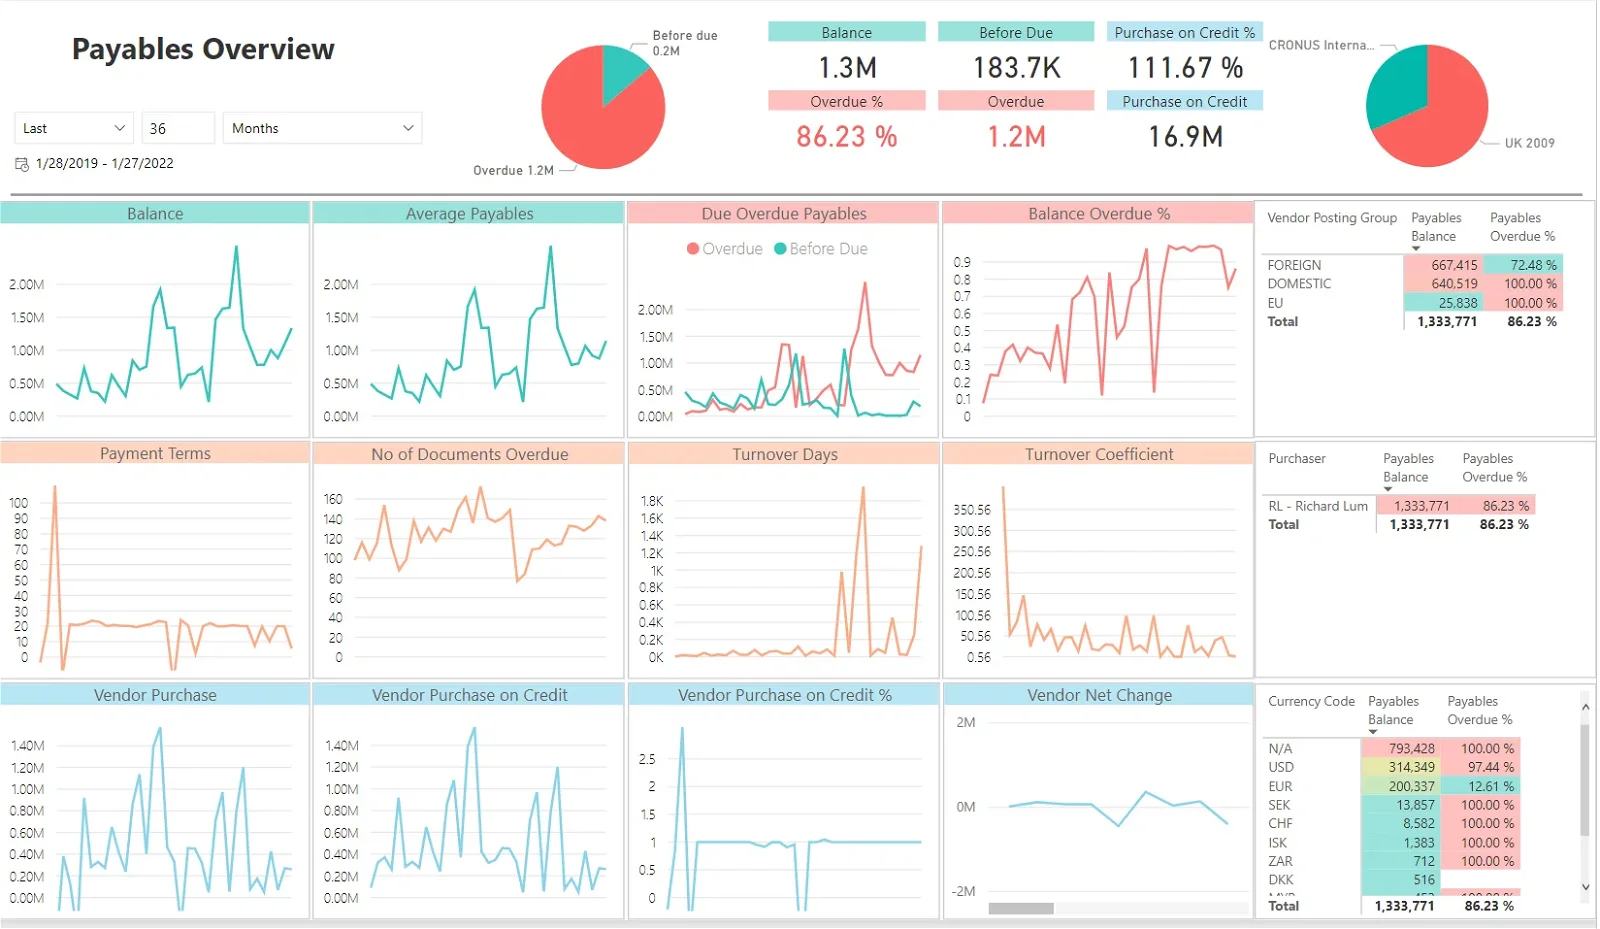
The Power BI Accounts Payable dashboard is a crucial tool for enhancing efficiency in workflows and gaining deeper insights into supplier relationships. With Power BI consulting services, you could start exploring its various features and understanding how it impacts day-to-day operations, businesses can streamline financial processes and optimize their interactions with suppliers for improved performance and cost-effectiveness.
- Outstanding Invoices:
- Shows the total amount owed to vendors, grouped by factors such as due date, vendor name, or purchase order number.
- Uses bar graphs or pie charts to highlight the biggest outstanding invoices.
- Overdue Payments:
- Identifies invoices that are past due, urging prompt action to prevent late fees.
- Can use color-coding to show the severity of overdue status (e.g., red for critical overdue).
- Supplier Performance Evaluation:
- Examines important metrics such as average payment terms, on-time delivery rates, and quality concerns.
- Displays data in tables or heatmaps to pinpoint suppliers with frequent delays or reliability issues.
- Drill-Down Capabilities:
- This feature lets you click on a data point (like a large overdue invoice) to view detailed information about that vendor or transaction.
- You could see purchase order details, communication history, or past payment behavior.
- Prioritization of Payments:
- Easily spot overdue invoices, so the Accounts Payable team can pay on time, avoid extra charges, and keep good supplier relations.
- Improved Cash Flow Management:
- Get valuable insights on upcoming payments for better cash flow planning.
- Identify busy invoice periods and ensure enough funds to prevent disruptions.
- Early Payment Discount Negotiation:
- Use real-time data on unpaid invoices to snag early payment discounts.
- See potential savings from discounts on the Power BI dashboards to boost cash flow optimization and enhance financial performance
- Vendor Relationship Management:
- Pinpoint tardy or unreliable suppliers to tackle issues proactively using power bi dashboards
- Analyze supplier payment history on the dashboard to flag problematic vendors for potential action.
- Increased Financial Performance Efficiency:
- Automate tasks like spotting overdue payments to free up time for AP staff.
- Let them focus on valuable tasks such as negotiating discounts, handling complex invoices, and nurturing key vendor relationships.
Therefore this Microsoft Power BI dashboard via Power BI desktop and app serves as a catalyst for the accounting department to transcend manual processes and steer towards data-driven decisions for better financial performance. This shift leads to enhanced cash flow management, streamlined supplier relationships, and notable time efficiencies for the AP team.
Why Is Microsoft Power BI Solution Useful for Finance?
Power BI development sevices with data analytics aims at providing a comprehensive set of data insights across a variety of systems via dashboards and Power BI reports. This will help your finance team move out of silos to centralized information.
Power BI solution is backed by strong BI strategy, data model capabilities, enabling advanced economic modeling and analysis for data driven decision making for your finance teams. The Power BI Dashboards enables business users to transform complex financial data into an appealing data visualization.
Meeting Financial Goals With Power BI: A Case Study
Company: AMOT
Industry: Manufacturing
- AMOT necessitated precise financial insights to gain a clearer understanding of the business’s progress. Real-time updates of figures were required without allocating resources to this task.
- AMOT also encountered challenges with data consolidation, requiring considerable time and effort to obtain a more holistic view, hindering team collaboration and information sharing.
- DAX Empowered Dashboards For Real-Time Data
- Revenue & Finance Dashboard
- Inventory & Backlog Dashboard
- Orders & Booking Dashboard
- Stay ahead with real-time financial insights.
- Navigate inventory & backlog challenges for informed decisions.
- Leverage DAX (Data Analysis Expressions) to enhance data models.
- Make quick business decisions with real-time order & booking info on your dashboard.
AMOT had a lot of raw data from various sources, but it needed a better way to manage and analyze it. The team wanted to keep track of data such as inventory, backlog, revenue, etc. However, they did not have a clear idea of how to create a model that would integrate all this data, keep everyone informed, be easily accessible, and work in real-time.
Sunflower Lab collaborated with the client during the ideation phase to understand their pain points and vision. Our team of experts carefully studied the challenges that they faced at the ground level. They also identified what kind of data the client wanted to visualize to leverage business intelligence. Based on this, our team proposed a dynamic dashboard model with an additional forecasting feature. Now AMOT could not only see how it performed with real-time data, but also use trends to evaluate their current situation and progress through forecasting based on automatically updated real-time data.
Read How AMOT transformed themselves with our Power BI Development Services
Power BI Accounts Receivable Dashboard
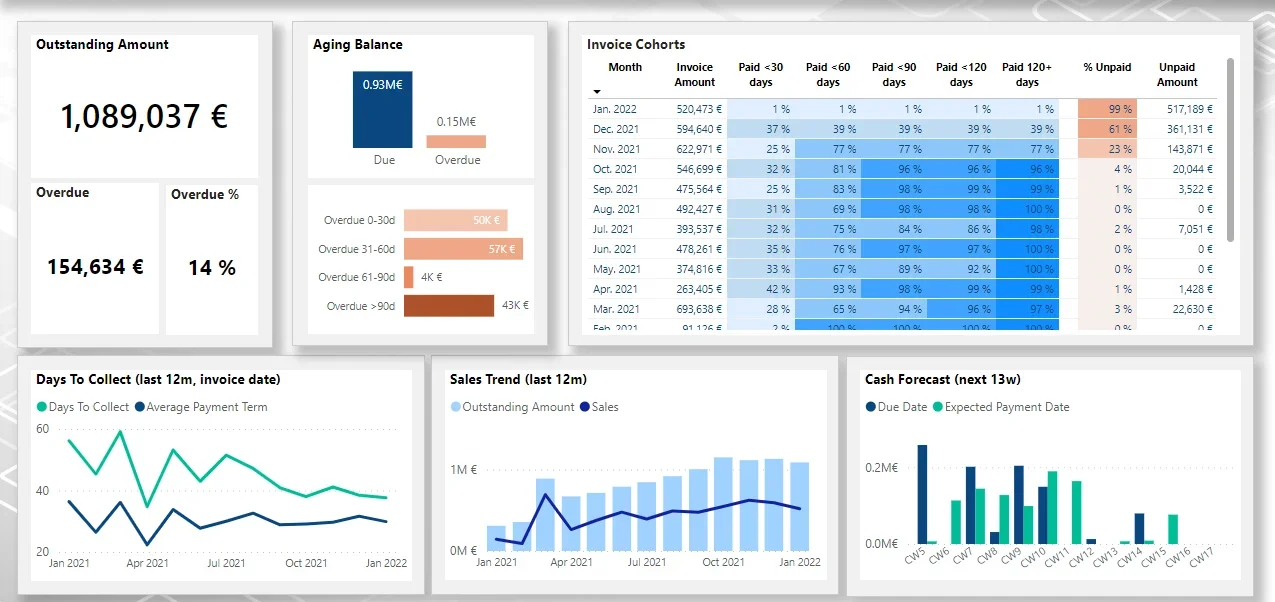
The Accounts Receivable Power BI dashboard empowers business intelligence into your team to efficiently tackle overdue invoices, enhancing cash flow and fostering customer relationships. Here is an overview of its features and how it elevates daily AR operations:
- Outstanding Invoices:
- Offers a comprehensive overview of outstanding customer payments, segmented by invoice age, customer type, or sales representative.
- Visual representations like stacked bar graphs help illustrate the distribution of overdue amounts among different customer segments.
- Collection Trends:
- Examines historical data to identify patterns in customer payment behaviors.
- Graphical representations like line charts or heatmaps show changes in average collection times or the percentage of on-time payments over specific periods.
- Customer Payment History:
- Provides a detailed insight into individual customer payment behaviors.
- This includes past invoices, payment timelines, and any outstanding balances.
- Identification of Overdue Receivables:
- Highlights overdue invoices prominently on the Power BI dashboard, urging immediate action for quicker collections.
- Utilizes color coding or visual alerts (e.g., flashing icons) to prioritize critically overdue accounts.
- Prioritization of Collection Efforts:
- Efficient identification of overdue invoices and understanding customer payment patterns enables the AR team to prioritize collection efforts towards those likely to experience delays.
- Improved Cash Flow Management:
- The Power BI service offers insights into the expected receivable money in the coming days or weeks.
- This facilitates better cash flow forecasting and planning, mitigating the risk of cash shortages.
- Timely Follow-Ups:
- Visualizing overdue receivables allows the AR team to initiate prompt follow-up actions with customers.
- This may involve sending reminder emails, making phone calls, or applying late payment penalties.
- Customer Credit Risk Assessment:
- Analyzing historical payment data enables a more precise assessment of customer creditworthiness.
- The AR team can pinpoint customers with a history of late payments and adjust credit limits or payment terms accordingly.
- Increased Efficiency:
- Power BI automates the identification of overdue invoices, eliminating manual searches through extensive customer ledgers.
- This liberates valuable time for the AR team to concentrate on strategic tasks like personalized communication with high-risk customers or developing effective collection strategies and data analysis.
What is a Financial Analysis Dashboard in Power BI?
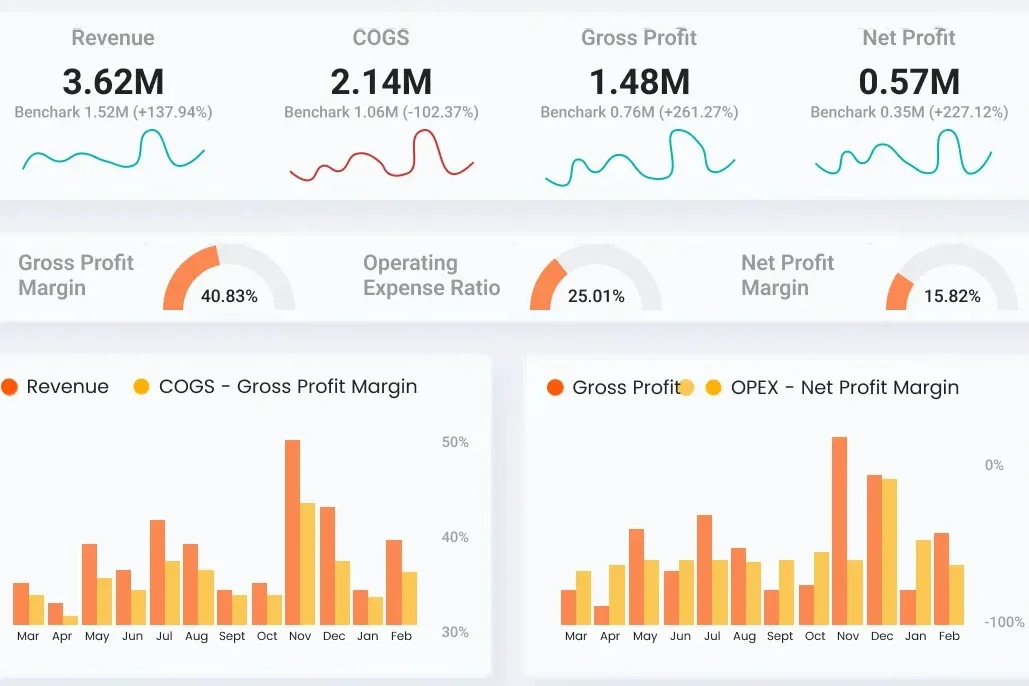
A Financial Analysis Dashboard in Power BI serves as a dynamic tool that simplifies financial data complexities for effective cost management. It provides interactive visuals enabling finance professionals to analyze key metrics with ease. Through a variety of charts and graphs from data sources, Power BI service facilitates a deeper dive into critical data, supporting well-informed decision-making.
The dashboards are designed to be flexible and customizable, empowering each department to concentrate on relevant metrics. They consolidate financial data to provide a comprehensive view, empowering professionals to identify opportunities and drive growth with confidence. In today’s digital age, Power BI financial dashboards plays a crucial role in transforming data into actionable insights, offering clarity and control in a fast-paced business environment. Whether well-versed in finance or new to the field, utilizing Microsoft Power BI Experts service enhances the efficiency and impact of financial data analysis.
General Ledger Dashboard
The General Ledger dashboard in Power BI serves as a real-time insight into your organization’s financial well-being through various data sources. By presenting a unified perspective on account balances, transactions, and reconciliation status, it enables accountants to uphold data integrity and streamline the reconciliation process. Let’s explore its functionalities in detail and the impact it has on day-to-day GL tasks:
- Real-Time Balances:
- Offers a dynamic perspective of current balances for all general ledger accounts.
- Interactive functionalities like drill-down capabilities enable in-depth analysis of particular accounts and their subcategories.
- Transaction Visualization:
- Provides an overview of recent transactions categorized by account, date, or amount.
- Charts or graphs can unveil trends in account activity, spotlighting unusual fluctuations or potential errors.
- Reconciliation Status:
- Monitors the progress of account reconciliations, indicating reconciled accounts and any outstanding discrepancies.
- Efficient Detection of Discrepancies:
- Visualizing trends and fluctuations in account activity through the GL dashboard expedites the identification of potential errors or discrepancies.
- This may encompass unusual transactions, unmatched bank statements, or inconsistencies in account balances.
- Streamlined Account Reconciliations:
- The dashboard simplifies the reconciliation process by offering a comprehensive overview of financial aspects like outstanding reconciliations and highlighting potential issues.
- Accountants can dedicate their attention to resolving discrepancies rather than navigating through extensive relevant data.
- Enhanced Financial Accuracy:
- Swift identification and resolution of discrepancies enhance the accuracy of general ledger data.
- This secures the reliability of financial reports and presents a clearer insight into the organization’s financial well-being.
- Improved Data Integrity:
- Real-time monitoring of account balances and transactions contributes to maintaining data integrity.
- The dashboard can be set up to issue alerts for suspicious activity, triggering immediate investigation and averting potential errors.
- Boosted Efficiency:
- Power BI automates tasks such as identifying discrepancies and monitoring reconciliation status.
- This liberates valuable time for accountants to concentrate on more analytical tasks, such as interpreting financial data or identifying cost-saving opportunities.
Conclusion
The Power BI accounting dashboards present you with all the necessary data visualization which are necessary for the financial team. Using Power BI empowers your team with moden data analytics and business intelligence, as it encompasses Power BI report, Power BI desktop and mobile application too. Moving forward, Power BI consulting services will strengthen how financial dashboards are implemented. Key performance indicators derived from multiple data sources into your financial dashboard to analyze data is a key to success when you integrate business intelligence.
With Sunflower Lab, get the best Power BI dashboard development services as we have served numerous industries with intuitive and impactful Power Bi solutions. Contact Us Now.
Drive Success with Our Tech Expertise
Unlock the potential of your business with our range of tech solutions. From RPA to data analytics and AI/ML services, we offer tailored expertise to drive success. Explore innovation, optimize efficiency, and shape the future of your business. Connect with us today and take the first step towards transformative growth.
You might also like
Stay ahead in tech with Sunflower Lab’s curated blogs, sorted by technology type. From AI to blockchain, explore cutting-edge developments in our insightful, categorized collection. Dive in and stay informed about the ever-evolving digital landscape with Sunflower Lab.
10 Types of Power BI Dashboards for Every Industry!
Understanding the language of data is the key to success in today’s fast-paced business…

Know Your Manufacturing Insights with Power BI Dashboard
Unlike other industries, manufacturing industries are always searching for innovative ways to…

Integrating AI In Power BI: Know Why 44% Companies Trust AI for Better Decision-Making
Power BI, a key business analytics service, leads a revolution in how companies use AI and machine…

Power BI Experts & Dynamic Dashboards: Decrypting AMOT’s Business Success Story
In the manufacturing industry’s competitive landscape, excelling in the digital era involves…
Power BI Financial Dashboards for Optimal Fiscal Management
In finance, keeping ahead requires more than simply numbers on a spreadsheet. It necessitates a…
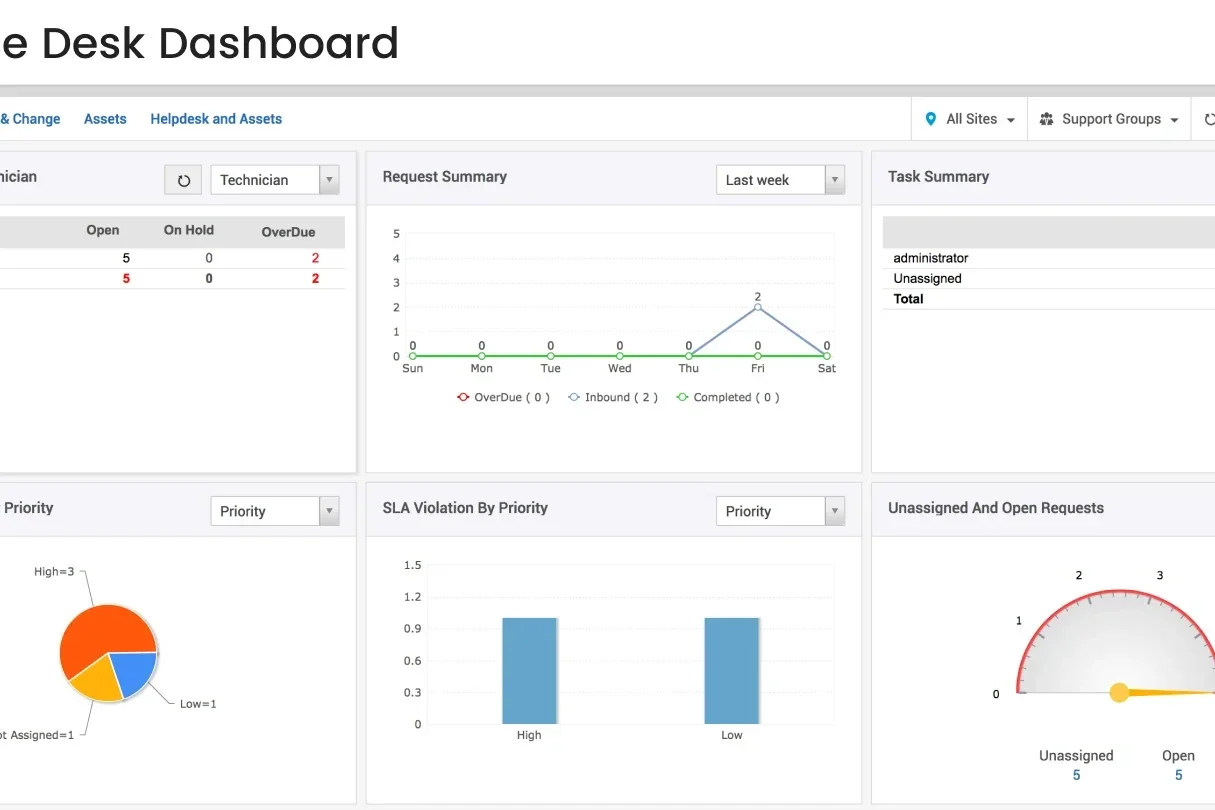
Power BI Service Desk Dashboard: The Next Level of IT Support
When it comes to effectively managing your business’s service desk, having deep insight is…
You might also like
Stay ahead in tech with Sunflower Lab’s curated blogs, sorted by technology type. From AI to Digital Products, explore cutting-edge developments in our insightful, categorized collection. Dive in and stay informed about the ever-evolving digital landscape with Sunflower Lab.