
Background
Microsoft Fabric is emerging as one-stop solution to aspects revolving around the data. Before the introduction of Fabric, Power BI faced few limitations related to data ingestion, since Power Query offers limited ETL & data transformation functionality. Power Query M Language scripting lacks ease of development, compared to popular languages like Java / C# / Python etc., which might be the need for complex scenarios. Lakehouse of Microsoft Fabric eliminates this downside by providing power of Apache Spark, which can be used in Notebooks to handle complicated requirements. Traditionally, organizations used to provision multiple services of Azure Services, like Azure Storage, Azure Databricks, etc. Fabric brings all the required services into a single platform.
Case Study
A private equity organization wants to have a close eye on equity stocks it has invested in for their clients. They want to generate trends, predictions (using ML), and analyze data based on algorithms developed by their portfolio management team in collaboration with data scientists written in Python. Reporting Team wants to consume data for preparing Dashboards, using Power BI. Organization has subscription of Market Data API, which can pull live market data. This data needs to be ingested on a real-time basis into the warehouse, for further usage by the data scientist & data analyst team.
Terminologies Used
Below are few terms used in the blog. A better understand of these by visiting respective website is advisable for better understanding:
- Lakehouse: In layman terms, this is the storehouse which will store unstructured data like CSV files in folders and structured data i.e., table (in Delta lake format). To know more about Lakehouse, visit official documentation link: https://learn.microsoft.com/en-us/fabric/data-engineering/lakehouse-overview
- Notebook: It is a place to store our Python code along with supporting documentation (in Markdown format). Visit this link for details on Fabric Notebook: https://learn.microsoft.com/en-us/fabric/data-engineering/how-to-use-notebook
- PySpark: Apache Spark is an in-memory engine for analysis of bigdata. Spark supports languages like Java / Scala / SQL / Python / R. PySpark is Python based SDK for Spark. More information on spark can be found on the official website: https://spark.apache.org/
- Semantic Model: Power BI Dataset is now re-named as Semantic Model.
- Postman: Postman is a popular tool mostly used for API testing (limited feature free edition available). Postman offers Graphical Interface to make HTTP requests & inspect their response in various format like JSON / HTML etc.
- Polygon.io: It is a market data platform offering API to query stock prices & related information.
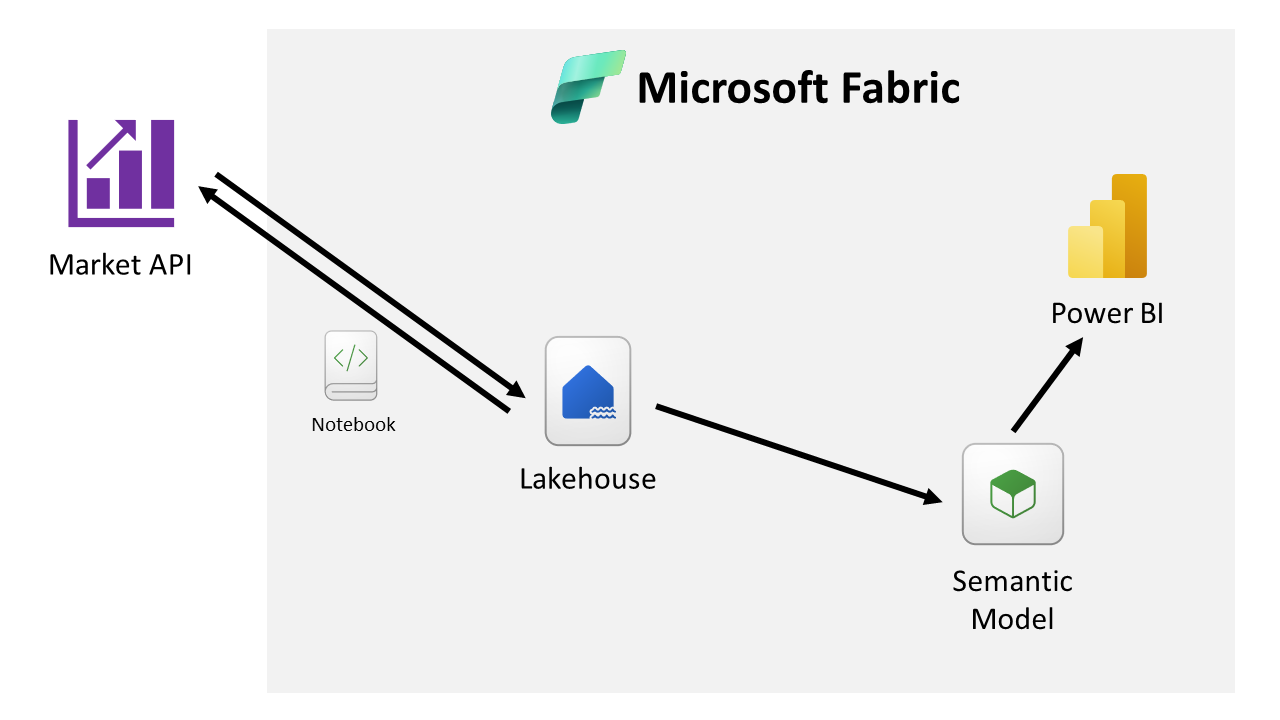
Flow Diagram
Below is the flow diagram to help understand how Fabric components are interlinked to each other to achieve the result.
API Feed Data Capture
In this case study, a free account sign-up of website https://polygon.io was done, which allows querying End-of-Day data with cap of max 5 API request / minute. Considering this limitation, hourly data of only 3 securities have been ingested, to demonstrate POC (Proof-of-Concept). Viewers are encouraged to use a paid account, which supports real-time data with unlimited API request, for their development / testing / production usage.
Below is the screenshot of HTTP request with response made via postman for single security, to be implemented in Notebook, for data ingestion.
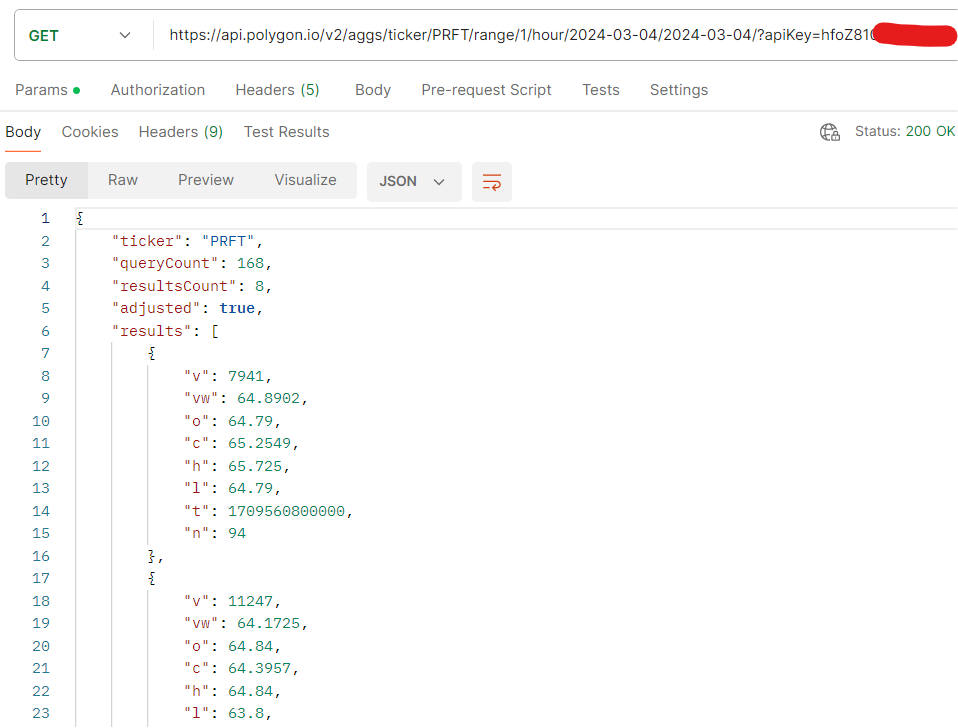
JSON response contains property named results, of type object array containing hourly status of specific security.
o = open / c = close / h = high / l = low / v = traded volume / t = timestamp (in Unix style)
Step 01: Create Fabric Capacity Workspace
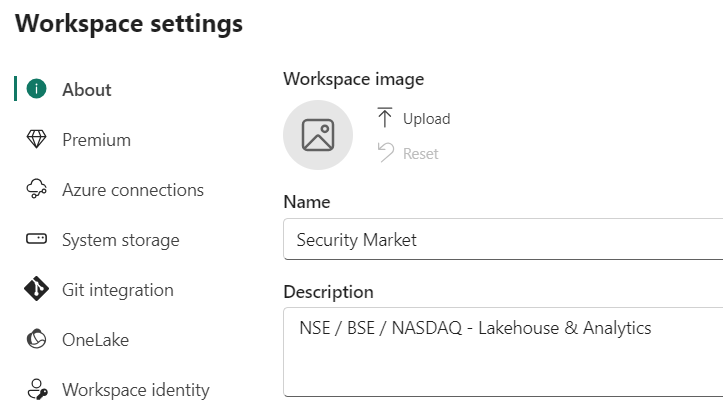
For the POC, we will create a workspace named Security Market, for our portfolio management division, using New Workspace button (available to Fabric Administrator), with settings as per below screenshots.
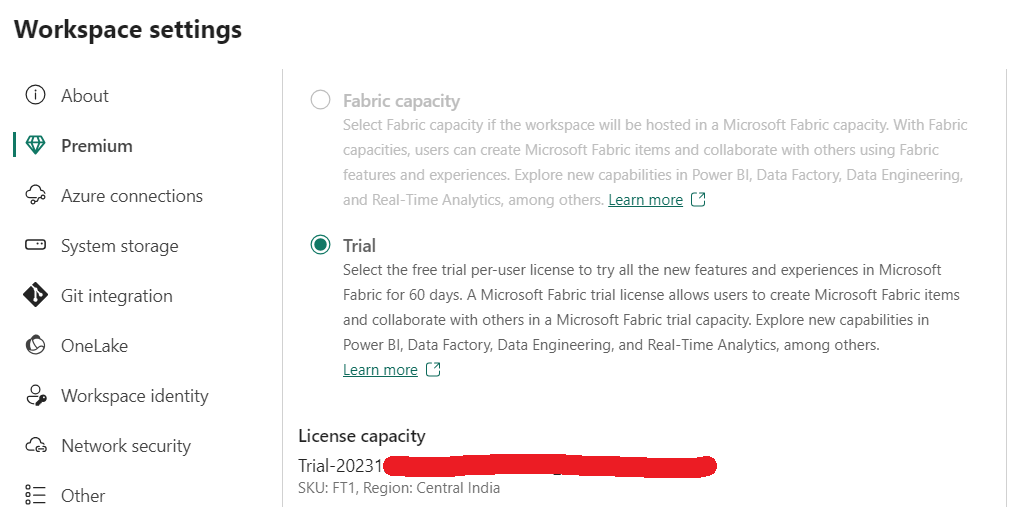
It is crucial that in Premium tab of settings, one needs to choose Fabric capacity (or Trial), which offers Lakehouse (refer below screenshot).
Once created, it should look as below (refer below screenshot).
Step 02: Setup Lakehouse

Next, we will create a new Lakehouse to host API feed captured data. Click New button and choose more options (if Lakehouse is not visible in menu). A detailed page as shown in the screenshot below would appear.
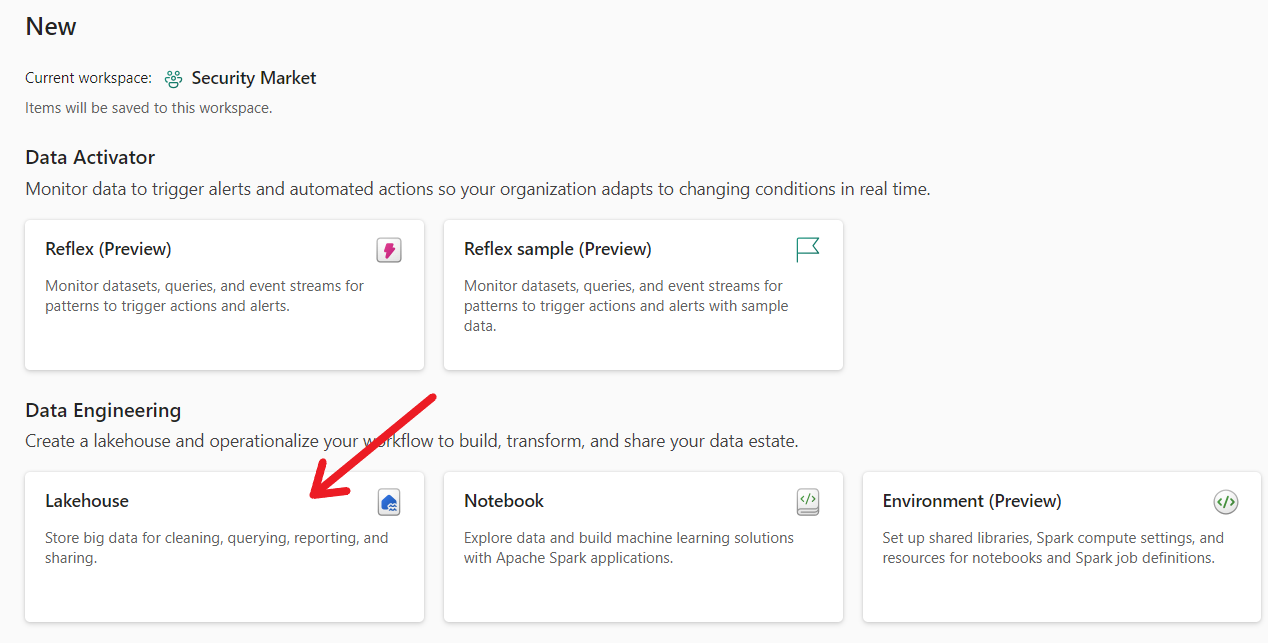
Use Lakehouse option to create a new Lakehouse. Rename this Lakehouse as per your choice.
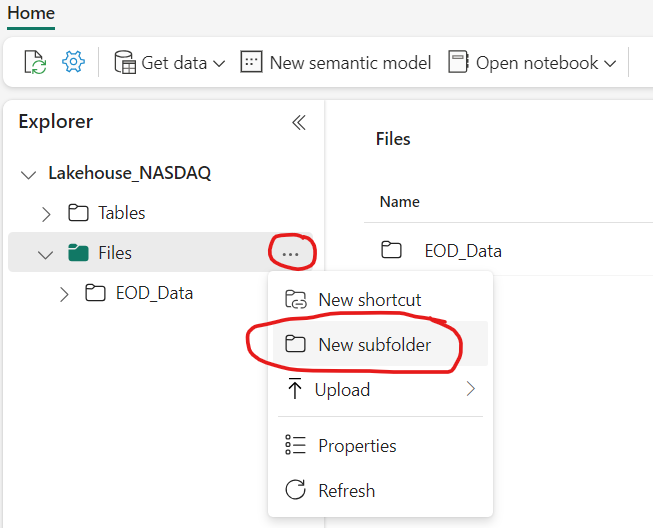
Lakehouse can host structured data Table & Semi-structured / Unstructured data Sub-Folder to store raw / processed files. We will create a sub-folder named EOD_Data to store data received from API request in CSV file format, which in-turn would be available for Data Scientist for further processing (refer below screenshot).
Step 03: Create Notebook
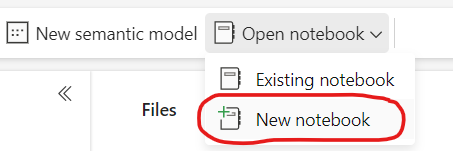
Once Lakehouse is ready, we can proceed towards the next step, where we will be writing Python code to capture & ingest data. Click on Open Notebook > New Notebook to initialize a blank Notebook (refer below screenshot).
This would open a blank Notebook. Copy-paste below Python code into code cell as shown in below screenshot.
import datetime as dt
import requests as httpclient
from notebookutils import mssparkutils

api_key = 'hfoZ81xxxxxxxxxxxxxxxx'  # Secret API Key
symbol_list = ['MSFT', 'GOOG', 'PRFT']  # Symbol list

target_date = dt.datetime.today()
file_content = 'symbol,timestamp,open,high,low,close,volume\n'  # insert CSV header
dt_YYYYMMDD = target_date.strftime('%Y-%m-%d')  # YYYYMMDD

for symbol in symbol_list:  # Iterate through each symbol (security)
    api_url = f'https://api.polygon.io/v2/aggs/ticker/{symbol}/range/1/hour/{dt_YYYYMMDD}/{dt_YYYYMMDD}/?apiKey={api_key}'
    resp_obj = httpclient.get(api_url).json()
    for r in resp_obj['results']:  # Iterate through each rows of security for respective frequency of timestamp
        price_open, price_close, price_high, price_low, trade_volume = r['o'], r['c'], r['h'], r['l'], r['v']
        timestamp = dt.datetime.fromtimestamp(r['t']/1000).strftime('%Y-%m-%dT%H:%M:%S') # decode unix timestamp
        file_content += f'{symbol},{timestamp},{price_open},{price_high},{price_low},{price_close},{trade_volume}\n' # append row

mssparkutils.fs.put(f'Files/EOD_Data/{dt_YYYYMMDD}.csv', file_content)  # Save file into Datalake with Date identifier
df = spark.read.load(f'Files/EOD_Data/{dt_YYYYMMDD}.csv', format='csv', header=True, inferSchema=True) # Read file into dataframe
df.write.saveAsTable('nasdaq', mode='append')  # Append dataframe rows to "nasdaq" table
Execute the above code, after the NASDAQ market is closed. Let us understand in nutshell, what this Python code does:
- Every Market Data platform offers a secret API key, which needs to be provided in URL or HTTP header (as defined in API documentation).
- Just to experiment, we have selected 3 securities MSFT (Microsoft Corp), GOOG (Alphabet Inc – Class C) and PRFT (Perficient Inc).
- URL requires date to be in YYYY-MM-DD format, which variable dt_YYYYMMDD is holding.
- Next, we run a loop for every security we want to query.
- HTTP Get request is made to Market API platform by dynamically preparing URL with target date, security (symbol) and API key, setting frequency of hourly data to be returned.
- In the JSON response, result property holds array of hourly data changes of security attributes (like open / close / high / low / etc.) as depicted in postman request screenshot. Kindly refer to respective market platform API documentation to know this in detail.
- Next, we run a loop to iterate and capture hourly data and append them to a text variable named file_content in comma separated format, to prepare our CSV file (notice we already wrote CSV header in line no 9 of code).
- Post execution of both the loops, in line no 20, a file with naming structure (YYYYMMDD.csv) is created under sub-folder EOD_Data.
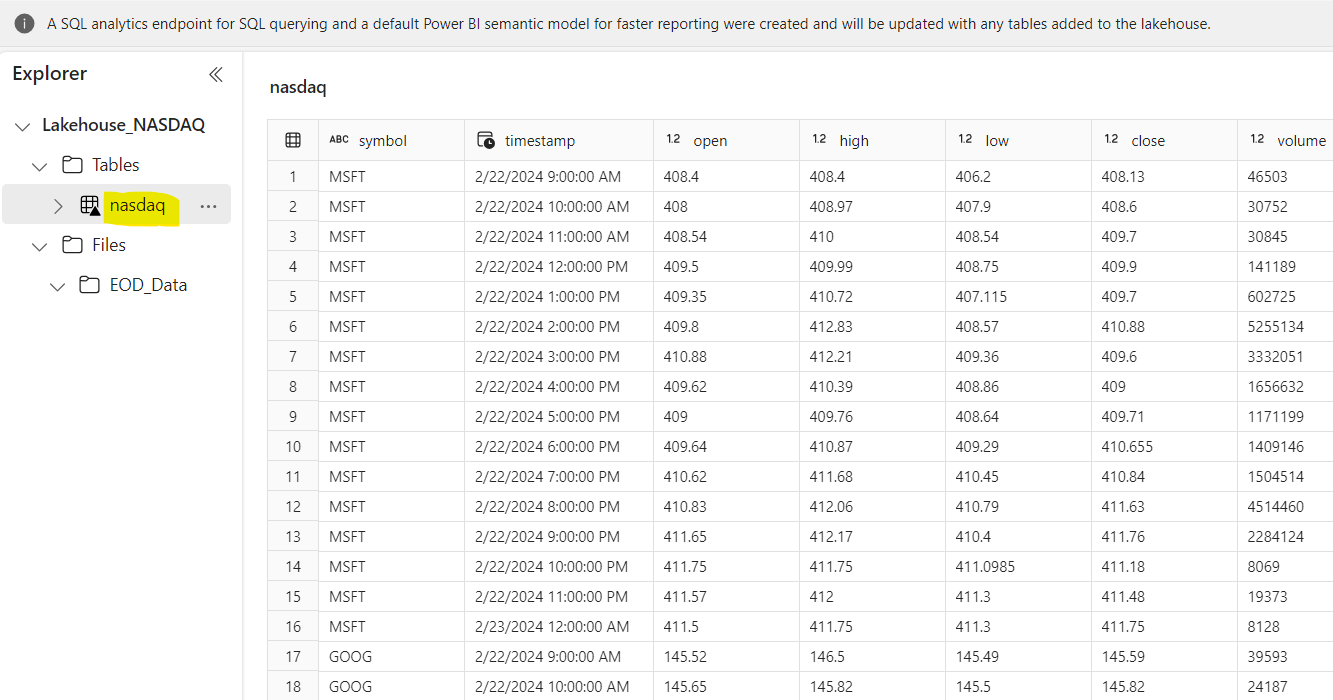
- In the last, this saved CSV file is read using spark reader into data frame, and the result is appended to a table named “nasdaq” (spark will auto create table if not found).
Let’s preview the data to ensure success of Python script. Navigate to Lakehouse, expand Tables, and ensure a table named “nasdaq” is created. Refer below screenshot for sample data.
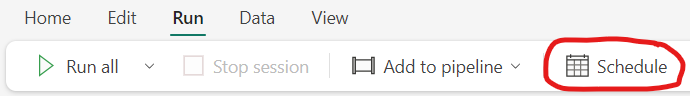
Step 04: Schedule Job
This notebook code needs to be run every day. Notebook offers a feature of scheduling the code to run automatically on set frequency event. This option is available in Notebook under option Run > Schedule.
This would open detailed scheduling option page as below. Assuming 4.00 pm EST as closing timing and adding buffer of 30 min for safety, let us apply timer to execute this Notebook Daily at 4:30 pm (refer below image).
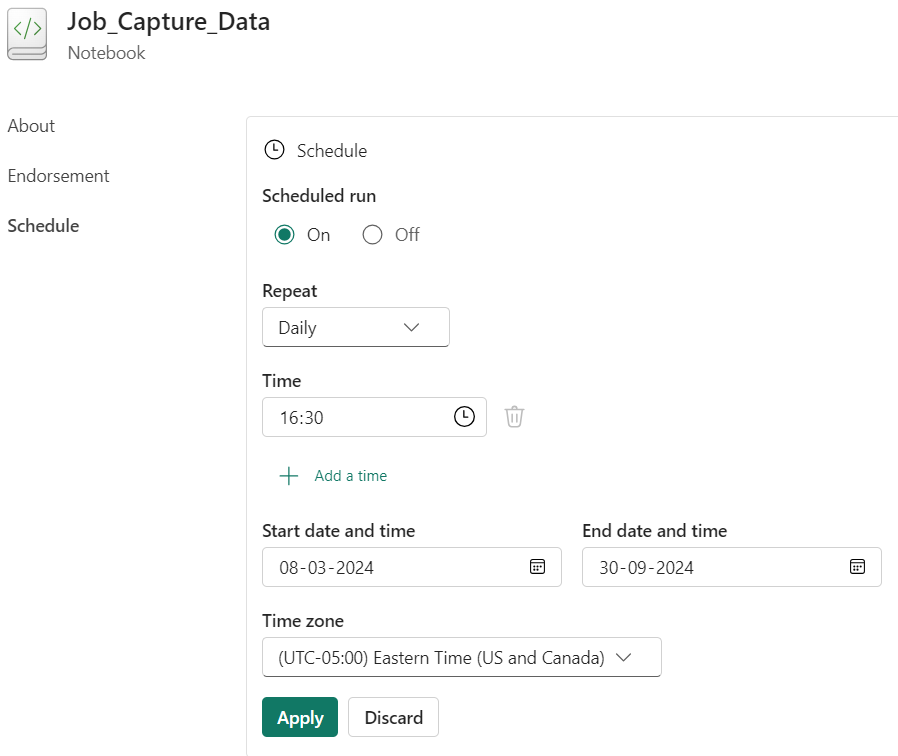
The job would run daily even on weekend when market is closed. Ideally this should not affect analytics, as for weekend Friday day-end position would continue. Data scientists are free to delete weekend data or ignore that data from their further calculation scripts.
Step 05: Generate Semantic Model
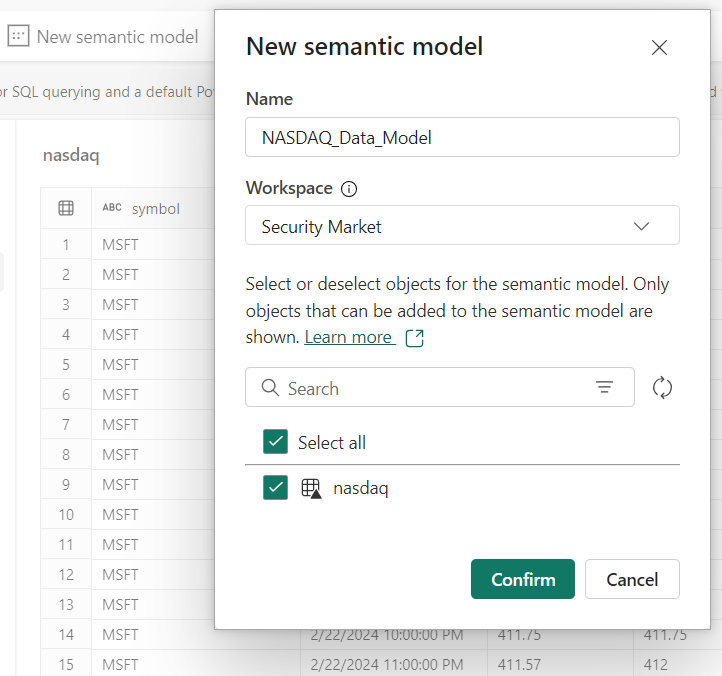
Semantic Model (previously known as Dataset) serves as data source for Power BI reports. Lakehouse contains an option to generate semantic model providing option to choose specific tables to be loaded into model required by BI developer (refer below screenshot).
BI Developer can further build upon that semantic model creating relationships & measures. Only limitation is that calculated columns cannot be added into tables from model editor, as in backend there is no Power Query. Columns need to be added using in Notebook.
Conclusion
The story does not end here but continue with authoring dashboards & reporting from Power BI based on the semantic model produced by Lakehouse. Fabric enables integration of team of data scientist, data engineers & data analyst on a single unified platform. Azure administrator just need to provision Fabric Capacity, which is scalable just like regular Azure Workload, based on CU (Consumption Units), which can be tweaked on hourly basis, to accommodate for peak workload hours. Blog intends to share few capabilities of Fabric for dealing real scenario. There are many components of Fabric like Data Activator, ML Model, Data Pipeline, which for further complex level use-cases, which can be a great for exploration.