AWS | Cloud
AWS Lambda unit testing with Python 
Dennis Vriend 10 Nov, 2018


In this blog post, we examine the relative costs of different language runtimes on AWS Lambda. Many languages can be used with AWS Lambda today, so we focus on four interesting ones. We made the complete project available on GitHub because any benchmarking claims we make are frivolous without the supporting code for potential peer review.
Rust: According to StackOverflow, Rust has been developers’ most loved programming language since 2016. Rust also features the best combination of performance and safety among mainstream languages, which naturally makes it an interesting choice for AWS Lambda. Rust just came to AWS Lambda in November 2023, so probably a lot of folks are wondering whether to try it out.
Scala: Xebia has an extensive background in JVM development, including AWS Lambda development. We target JVM 21 for our experiment, using Scala as the language frontend and ecosystem, but one might reasonably expect similar outcomes for Java and Kotlin. We are aware that we could use a tool like feral to target a JavaScript runtime instead, and that this could certainly produce a different outcome. But we abstain because we want a JVM-based contestant for improved coverage of the solution space.
Python: Consistently one of the most widely used and sought languages in recent years, Datadog reports that Python is one of the top choices for AWS Lambda development. We use mypy for the safety afforded by a static type system.
TypeScript: Programming equates to web programming for the majority of software developers, and JavaScript remains the most widely used programming language of them all. Node.js was born out of the desire to unify the whole development stack, and this technology is well-supported for AWS Lambda. We use TypeScript for the same reason that we use mypy.
Obviously, we want to be fair to each of the contestants, so first, we must formulate a suitable rubric.
The specific contest should be framed around real-world use cases that drive businesses and solutions to AWS Lambda. In other words, the contest must be sincere, and the resultant benchmarks should be useful and actionable.
Wherever possible, the same implementation techniques should be obtained for each contestant. When deviation is unavoidable, it must be described and justified.
The implementation should use ordinary code, follow common algorithms, and adhere to sound practices. No implementation should fare better (or worse) than any other due to an abundance (or dearth) of cleverness.
Official AWS SDKs should be used, not third-party alternatives.
The total cost of reproducing the benchmarks should be small in case anyone wants to reprise the contest for themselves.
The contest comprises three services arranged in a linear pipeline and two benchmark tests.
Here’s the system diagram for our contest:

A user instigates the process by contacting the https-a generator service via their web browser. The https-a service generates data bundles and posts them to an on-demand Kinesis event stream (A). The events-a service pulls these events, processes them, and posts the results to another on-demand Kinesis event stream (B). The events-b service pulls these events and passes them straight through to DynamoDB without further processing.
https-aThis is a generator of Kinesis events, serving as the catalyst for the other services. It’s a simple web service that accepts:
A seed parameter used to prime a pseudorandom number generator.
A chars parameter that specifies the number of alphanumeric characters to generate pseudorandomly. The resultant payload defines an arbitrary work unit for heavy computational processing downstream. This payload is an abstract surrogate for some important data bundle in a real-world process. The parameter is tunable to accommodate different input sizes.
A hashes parameter that specifies the number of times to iteratively hash each payload downstream. A cryptographic hash is used as an abstract surrogate for some compute-intensive processes, e.g., LLM execution, signal processing, fluid dynamics simulation, protein folding simulation, code optimization, graph optimization, etc. The parameter is tunable to accommodate different algorithmic costs and complexities.
A messages parameter that specifies how many Kinesis events to generate at once. The maximum injection size is 500.
JSON is the currency of our services. The generator produces JSON documents that comprise:
A UUID that labels the payload.
The payload itself.
The number of times to iteratively hash the payload.
Here’s an example document where chars=1024 and hashes=100:
{

    "uuid": "1115bcd4-95a4-4d1d-8d48-6769ae919cdc",

    "doc": "W7ckP4Mc1crUrkdKsxB8VTIwgGpaVnt8qOLhogAYYFU0r4HU1LY5PLWGJyuJWrX2UvZc4goASfnGZgtpWX7CkjsFag7ElQk4dKv8oufwi2OUH23yuxnk7ils51PHPRNOftyijP3FIAeW9m8NOPIweep0ylLt68XpAtAPAyDbNK26F5QJto0ri7fnj9eECN1f8xmbMZBckDz2sXKAuJmDg7ZgKyccLzzI9ZHhNMtOTaqfvXWpkfDYaV2aUvRcfzuMabDCEEoNpqzZE8tPQ1TBRa3Eqm56eYTTutJZuO1Jb94O",

    "hashes": 100

}
Note that the document does not include the hash yet. The next service in the pipeline performs the actual computation. The generator merely records the volume of work to be done. The generator posts its progeny to an on-demand Kinesis event stream, uncreatively called A, from which the events-a service will consume. For simplicity and expediency, we don’t benchmark this service at all. Therefore, we only need to implement it once, and we can choose a language runtime arbitrarily. We choose Rust.
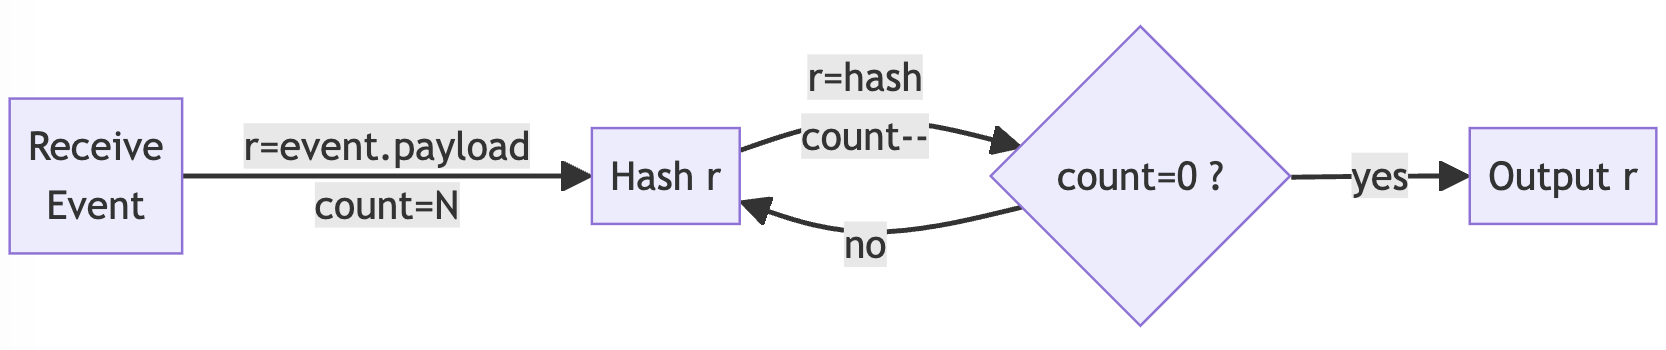
events-aThis service hashes items posted to event stream A and then posts results to event stream B. We use SHA3-512 as the cryptographic hash function, partially because hardware acceleration is not as readily available as with earlier algorithms in the SHA family. We initially hash the pseudorandomly generated payload, then iteratively hash the successive cryptographic digests until the target count is reached. So if a document specifies hashes=100, there will be an initial payload hash followed by 99 digest hashes. This diagram illustrates the process:
The result is a variant of the incoming JSON document format, augmented by a hash property:
{

    "uuid": "1115bcd4-95a4-4d1d-8d48-6769ae919cdc",

    "doc": "W7ckP4Mc1crUrkdKsxB8VTIwgGpaVnt8qOLhogAYYFU0r4HU1LY5PLWGJyuJWrX2UvZc4goASfnGZgtpWX7CkjsFag7ElQk4dKv8oufwi2OUH23yuxnk7ils51PHPRNOftyijP3FIAeW9m8NOPIweep0ylLt68XpAtAPAyDbNK26F5QJto0ri7fnj9eECN1f8xmbMZBckDz2sXKAuJmDg7ZgKyccLzzI9ZHhNMtOTaqfvXWpkfDYaV2aUvRcfzuMabDCEEoNpqzZE8tPQ1TBRa3Eqm56eYTTutJZuO1Jb94O",

    "hashes": 100,

    "hash": "38BCD7FB1629C1F1596186969928120E6C7A4ACABBEF1A6A26EE3835D0BACCB616FB6F1030FADA1852BD67CB6B557E1C661C71112227CC060114E777F44DECF9"

}
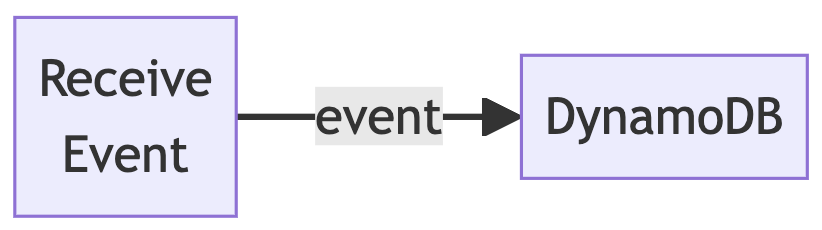
events-bThis service simply accepts items posted to event stream B and passes them verbatim to DynamoDB. We endeavor to perform as little work as possible, with maximum parallelism and asynchrony for insertion. So wherever possible, we invoke the database insertion API asynchronously, once for each outgoing item, and then we gang the futures together and await their aggregate completion. The following diagram shows how basic the service is:
Now that we’ve examined the contest’s structure, let’s dive into the evaluation criteria. We want apples-to-apples comparison wherever possible, but we are willing to commit additional resources if they are required for any
particular contestant to complete its tasks. Additional resources incur additional costs on the platform, so we note where variations are unavoidable and document the effect of any such adjustments on final cost.
Let’s establish the baseline metrics:
Each lambda is given 128MB RAM. This keeps execution of the services inexpensive. We assume that increases in available memory will improve compute performance by reducing OS paging, deallocator overhead or garbage collector thrash, and so forth. Naturally, increased memory commitment is a second cost axis on the platform, so any real-world deployment scenario needs to investigate where the sweet spot is.
Each lambda is given 15 minutes to run. This is a vast overabundance of time for the volume of work under consideration, which is perfect for avoiding double-counting compute time due to execution timeouts and function retries.
Each lambda uses dedicated Kinesis streams and DynamoDB tables, lest function interaction in the middleware layer complicate the analysis.
Each lambda processes a total of 2,000 incoming events. We direct the generator to inject events into event stream A in batches of 500.
We use the defaults where we don’t provide configuration values. This simplicity makes setting up the experiment and producing the benchmarks easier.
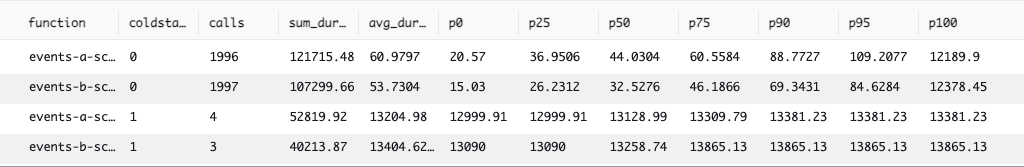
We compute two different benchmarks:
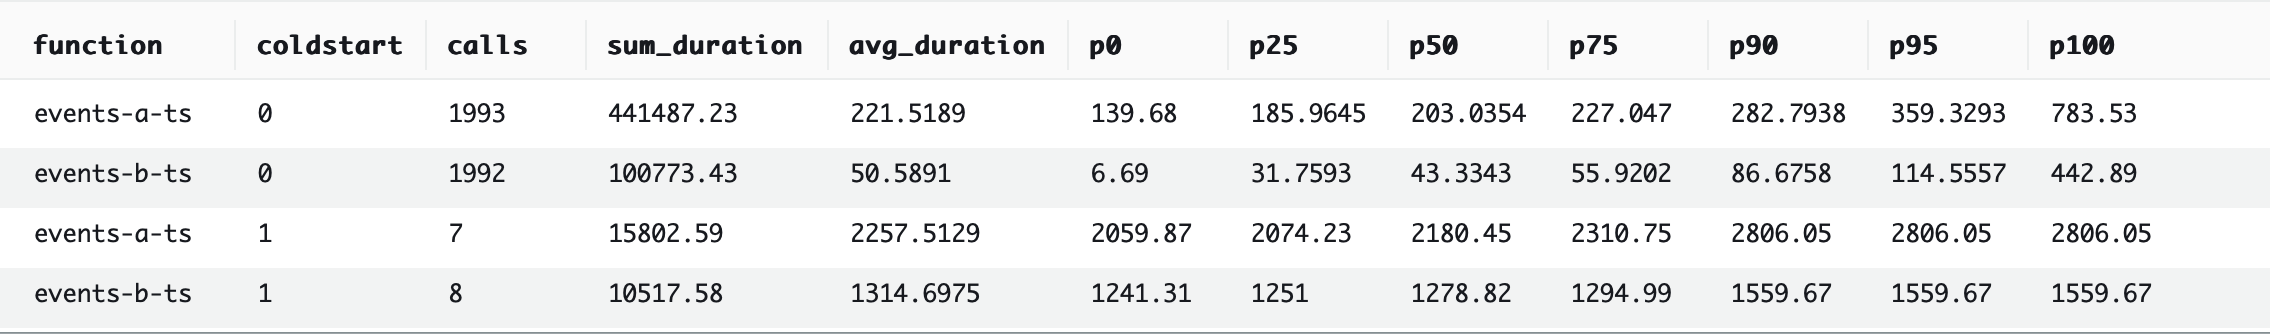
The maximum event batch size for events-a and events-b is set to 1. This case is not at all representative of real-world use cases, but minimizes variability and nondeterminism when taking measurements. It allows us to extrapolate a kind of idealized unit cost. We refer to this as benchmark #1 in the results below.
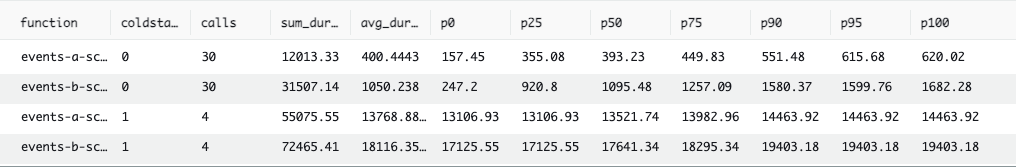
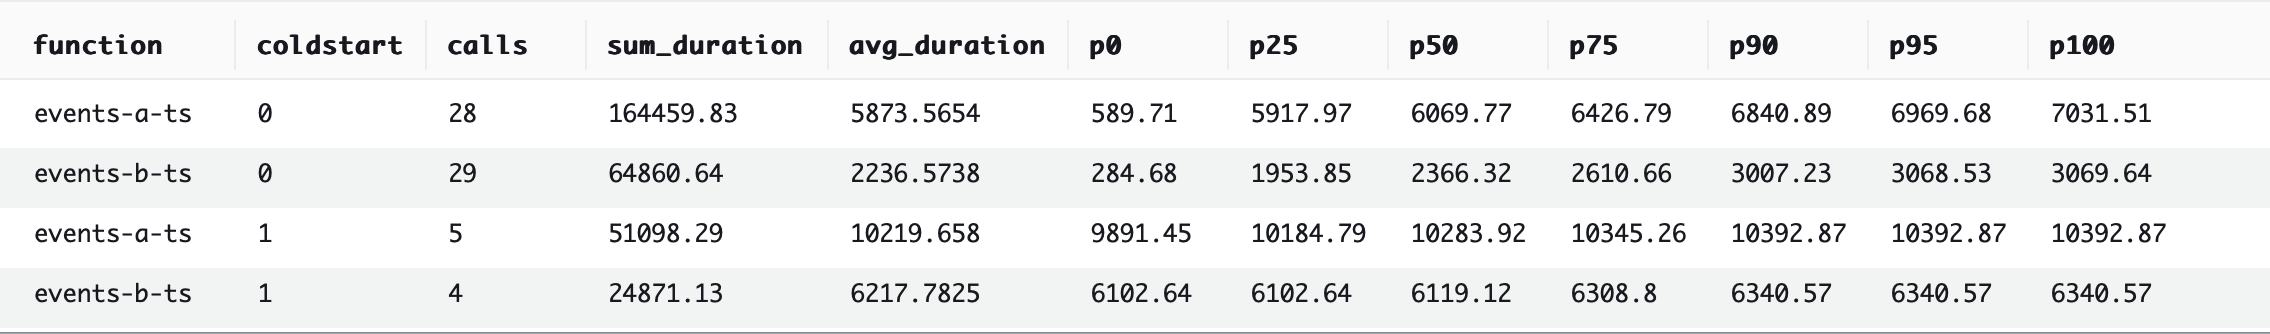
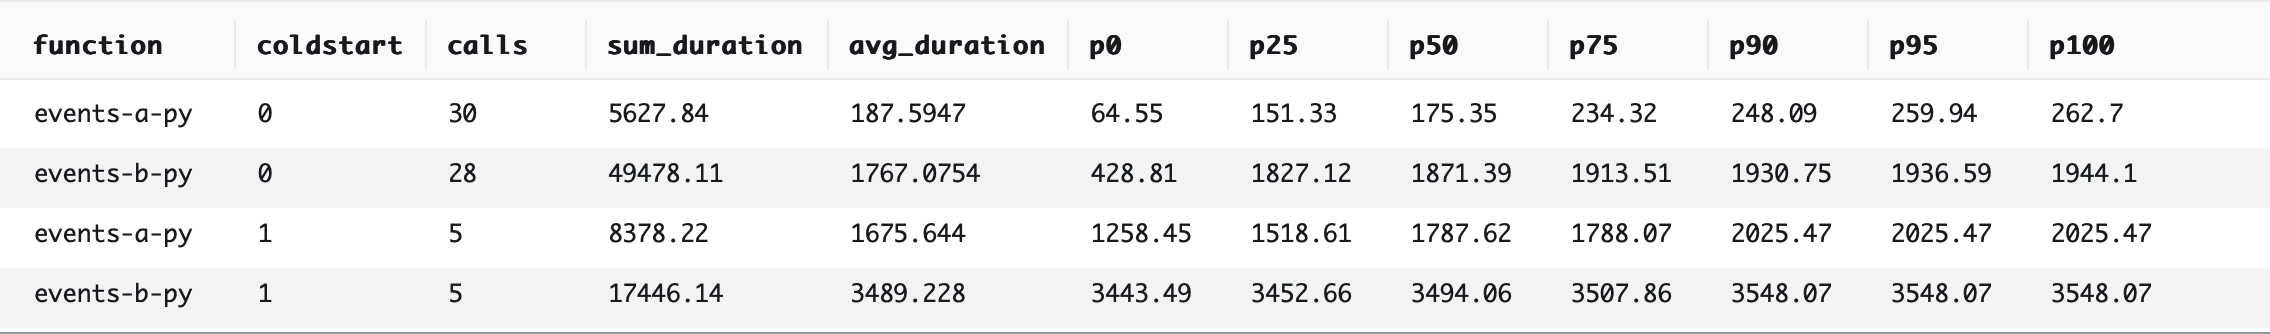
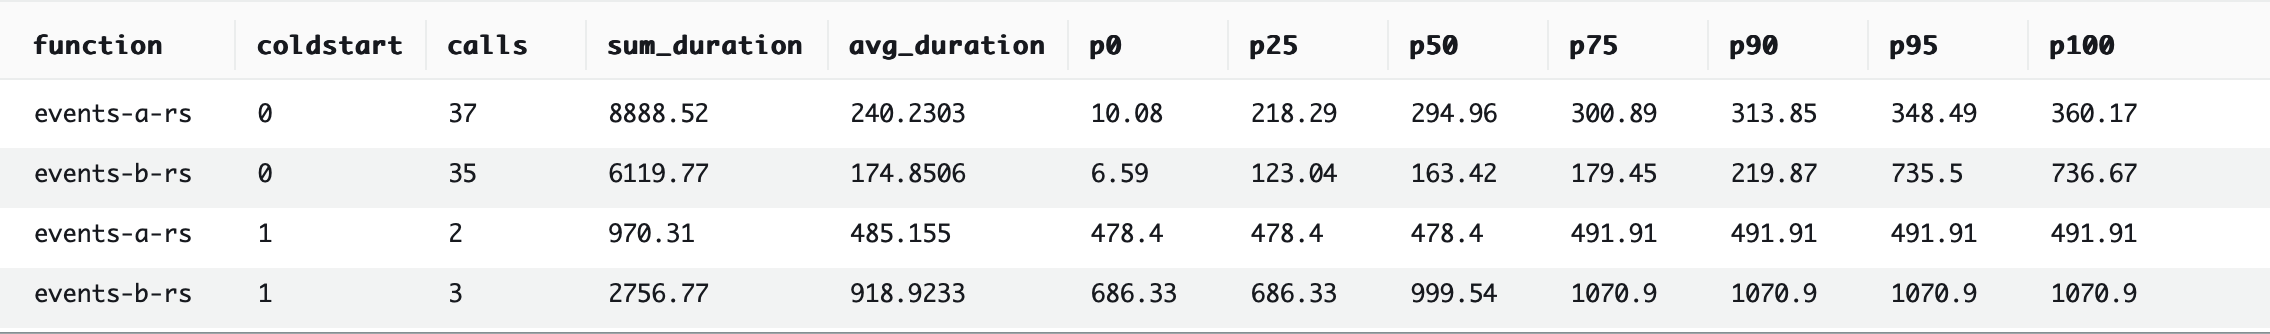
The maximum event batch size for events-a and events-b is set to 64. This case more closely aligns with real practice. The associated variances are present in almost all real-world use cases, giving us insight into typical patterns. We refer to this as benchmark #2 in the results below. We use the following Cloudwatch Logs (CWL) Insights query to define the benchmarks themselves:
filter @type = "REPORT"

| parse @log /\d+:\/aws\/lambda\/(?<function>.*)/

| stats

count(*) as calls,

sum(@duration + coalesce(@initDuration, 0)) as sum_duration,

avg(@duration + coalesce(@initDuration, 0)) as avg_duration,

pct(@duration + coalesce(@initDuration, 0), 0) as p0,

pct(@duration + coalesce(@initDuration, 0), 25) as p25,

pct(@duration + coalesce(@initDuration, 0), 50) as p50,

pct(@duration + coalesce(@initDuration, 0), 75) as p75,

pct(@duration + coalesce(@initDuration, 0), 90) as p90,

pct(@duration + coalesce(@initDuration, 0), 95) as p95,

pct(@duration + coalesce(@initDuration, 0), 100) as p100

group by function, ispresent(@initDuration) as coldstart

| sort by coldstart, function
Let’s break that down:
The regular expression selects the target AWS Lambda function. We use it to select the appropriate implementations of events-a and events-b.
We group the results by function and cold start indicator.
All timings are given in milliseconds (ms).
function is the function itself.
coldstart is 1 if the function started cold and 0 if it started warm. During a cold start, AWS Lambda has to deploy the function internally and start an appropriately configured execution environment. Cold starts can be much slower than warm starts, based on package size and language runtime.
calls is the number of function invocations.
sum_duration is the total billable time.
avg_duration is the average billable time.
px are performance percentiles. Specifically, px indicates that x% of the samples in the group finished within this time. So, 25% of the samples completed by the time given by p25, 50% completed by p50, and so forth.
p0 is therefore the minimum observed completion time for a sample in the group.
And p100 is therefore the maximum observed completion time for a sample in the group.
The final score for each benchmark is the sum of sums of four groups:
events-a warm start.
events-b warm start.
events-a cold start.
events-b cold start.
This score denotes the total billable compute time. This is the number that each contestant wants to minimize, as it translates directly into reduced cost on the AWS Lambda platform.
Okay, enough about process! Now, the moment you’ve been waiting for: it’s time to check out the juicy results. We caption the result tables with the approximate final score.
We couldn’t get Scala to perform either benchmark with only 128MB RAM, so we had to give the function 512MB RAM to even compete. A quick trip to the AWS Lambda Pricing Calculator and some basic data entry demonstrate that quadrupling the memory quadruples the memory-related cost — they are coupled linearly.
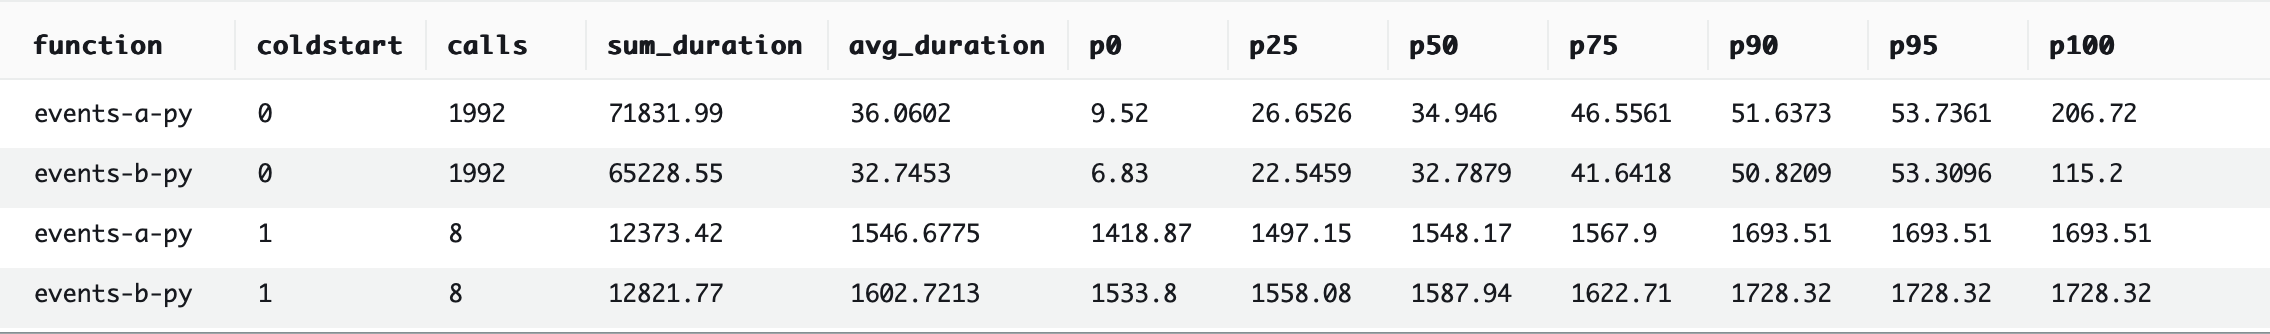
The official AWS SDK for Python, boto3, does not offer an asynchronous client. The network calls to the remote API are inherently asynchronous, of course. However, the client control flow is synchronous, meaning that the function is penalized by having to wait for an API call to complete before it can start the next one. There’s an unofficial AWS SDK that provides an asynchronous client, aioboto3, but we eschewed its usage in order to adhere to the rules we established above. Python does really well despite this handicap, handily outperforming the other contestants so far.
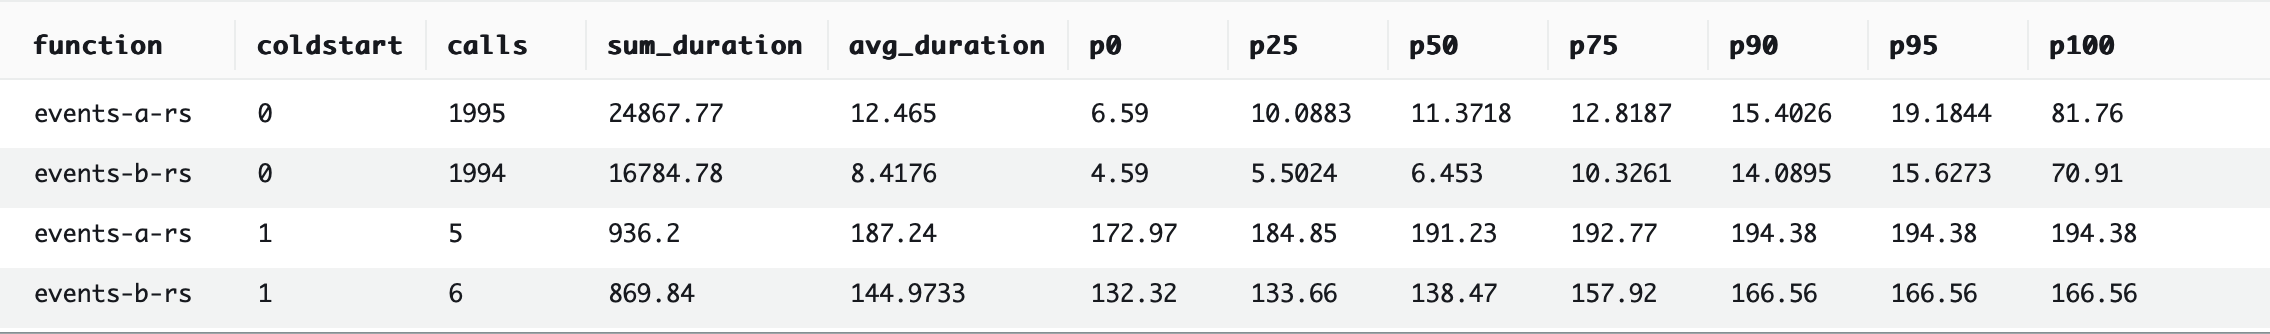
But Rust is our crowned king of performance. Its one-at-a-time benchmark (#1) outperforms Python’s one-at-a-time benchmark by ~373%, and even outperforms Python’s 64-at-a-time benchmark (#2) by ~186%. And using a batch size of 64 improves the performance of Rust by another ~232%.
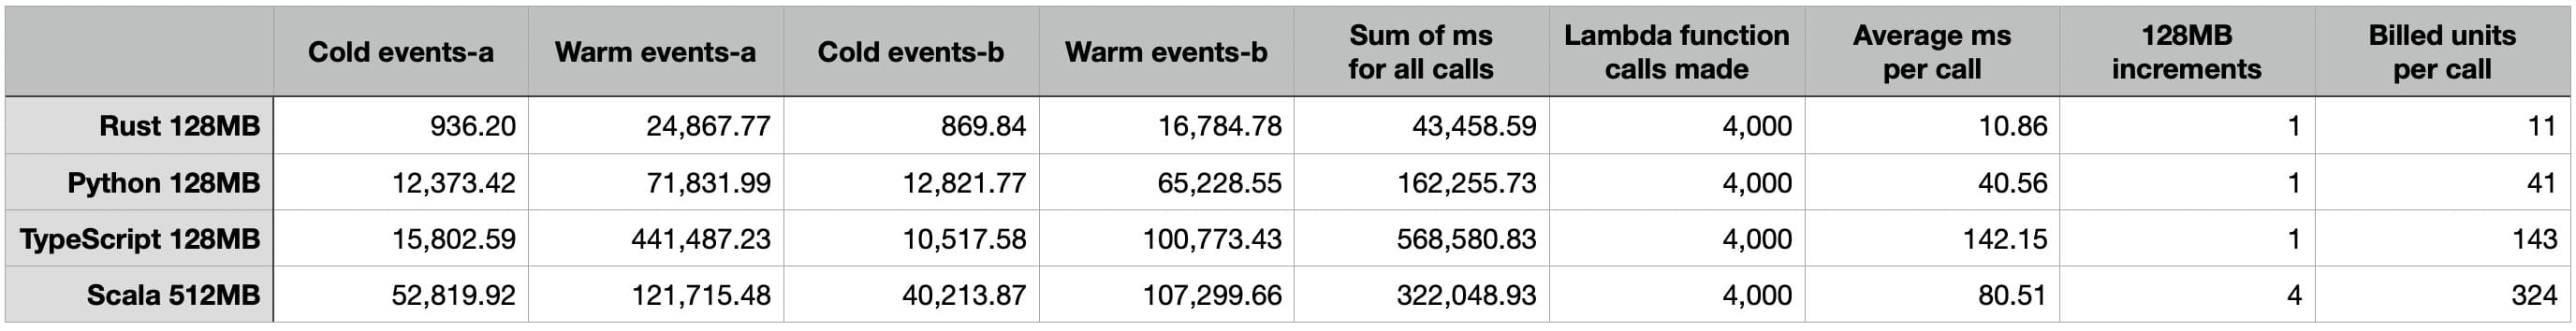
Let’s aggregate the results for benchmark #1:
Cold events-a: This is the sum, in milliseconds, of all cold invocations of events-a.
Warm events-a: This is the sum, in milliseconds, of all warm invocations of events-a.
Cold events-b: This is the sum, in milliseconds, of all cold invocations of events-b.
Warm events-b: This is the sum, in milliseconds, of all warm invocations of events-b.
Sum of ms for all calls: This is the sum, in milliseconds, of all invocations of the contestant language, irrespective of service or start temperature. It is obtained simply by summing Cold events-a, Warm events-a, Cold events-b, and Warm events-b. In other words, this is the final score determined above.
Lambda function calls made: This is the total number of function invocations, irrespective of service or start temperature. It is always 4,000 in our benchmarks.
Average ms per call: This is the average call time, in milliseconds, of an invocation of the contestant language, irrespective of service or start temperature. It is obtained by dividing Sum of ms for all calls by Lambda function calls made.
128MB increments: This is the amount of RAM used by the contestant language, as the number of 128MB RAM increments. This value serves as a cost multiplier. For Scala only, it is 512MB / 128MB = 4; for the other three languages, it is simply 1.
Billed units per call: This is the average number of billing units, computed as Average ms per call times 128MB increments. This is our abstract cost metric, permitting relative analysis of the contestants.
We can visualize Billed units per call in the following bar chart:
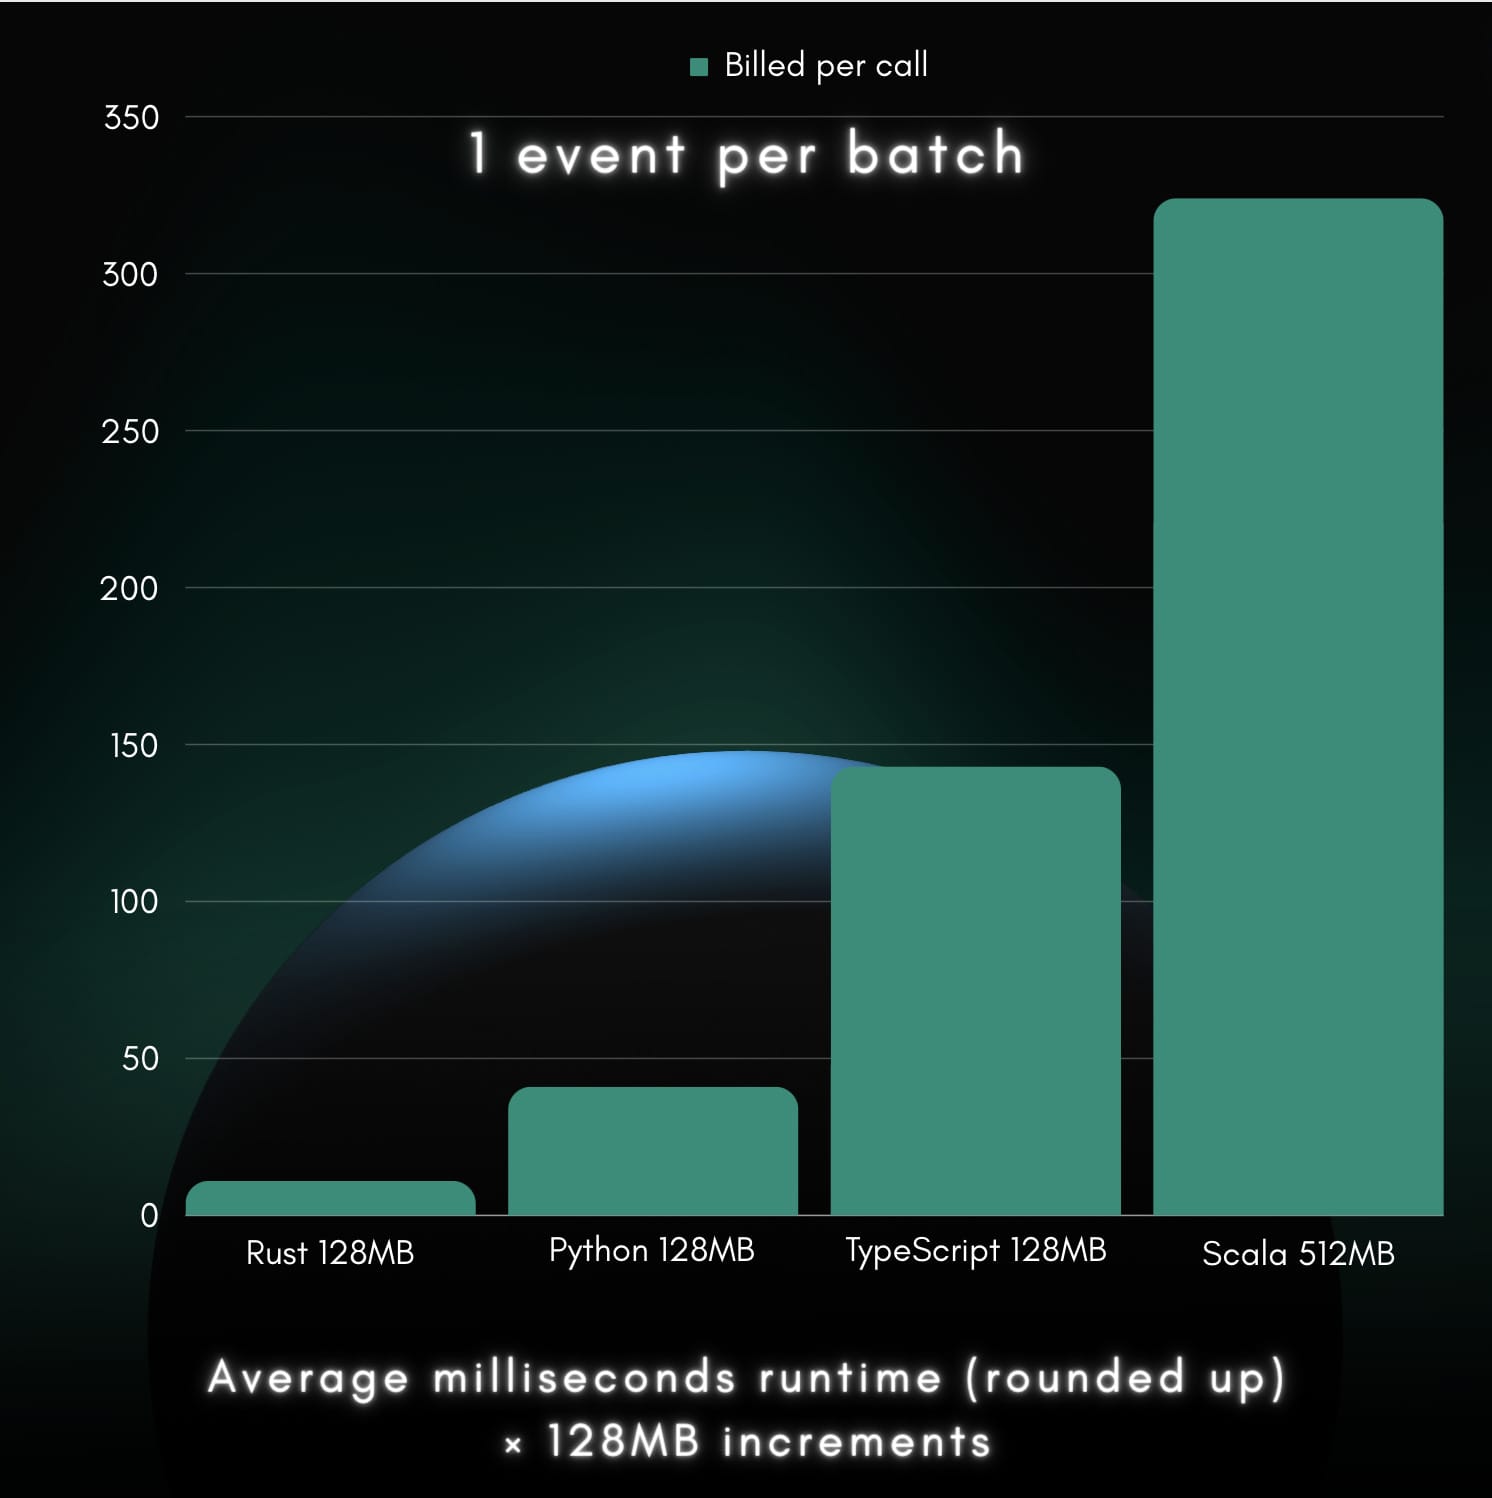
With some simple math, we can establish cost ratios to guide decision-making. Since Rust yielded the lowest billed units per call (11), we divide each of the four contestant values by Rust’s value to obtain our cost ratios:
Rust: 11 / 11 = 1
Python: 41 / 11 ≈ 3.73
TypeScript: 143 / 11 = 13
Scala: 324 / 11 ≈ 29.45
So if you are spending $20,000 per month on a lambda function written in Scala (or some other JVM-targeted language), you could expect to pay only 20,000 / 29.45 ≈ 679.12 per month for the same behavior after porting to Rust: a savings of ~96.6%. With a little bit of work, you can prove these results for yourself using the AWS Lambda Pricing Calculator:
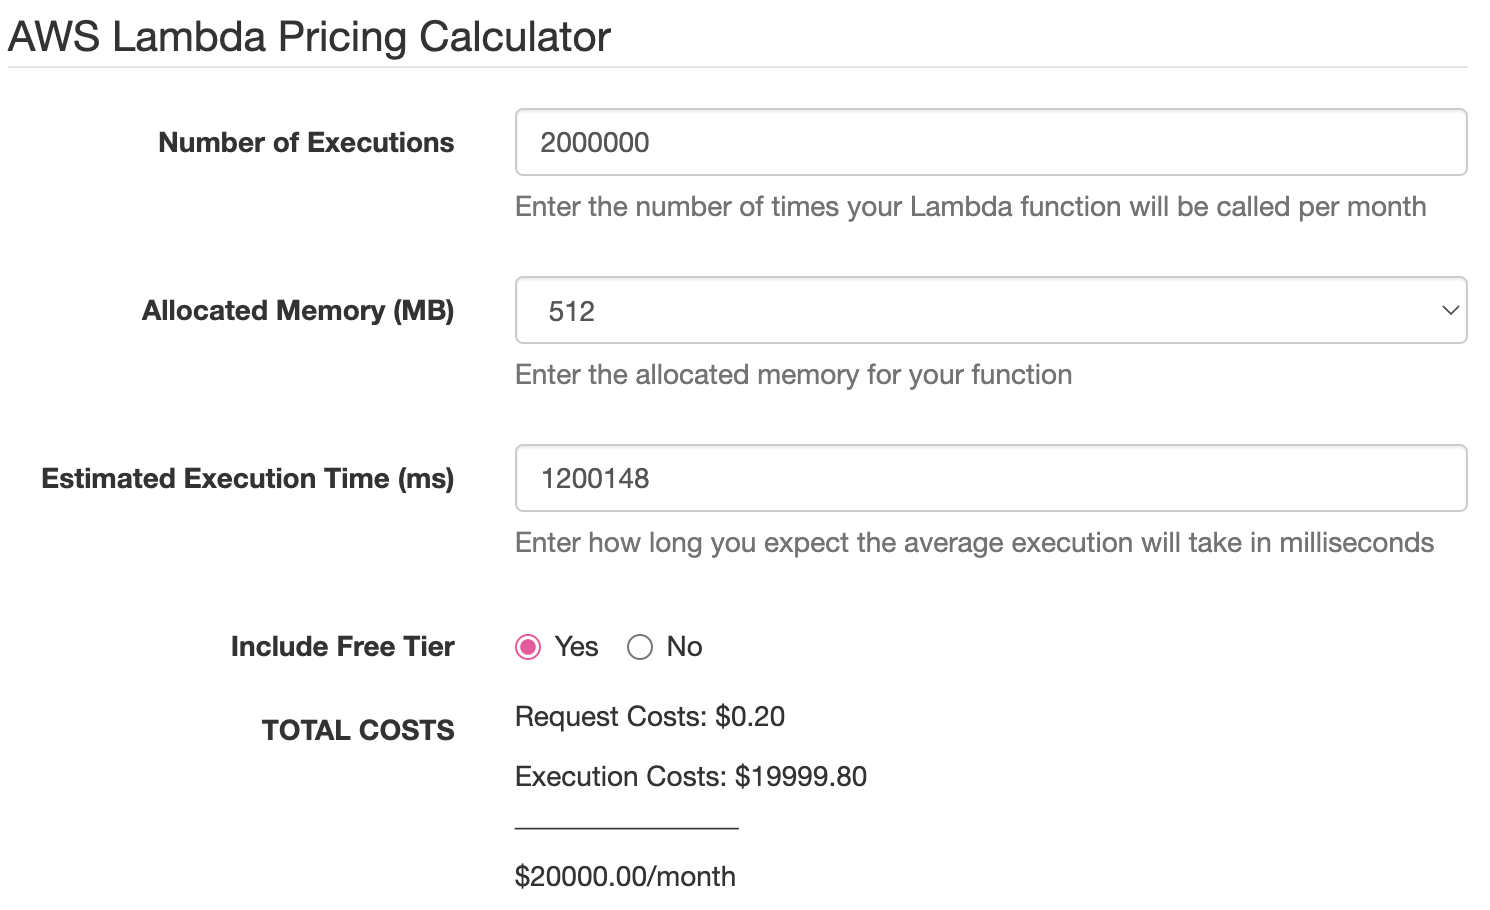
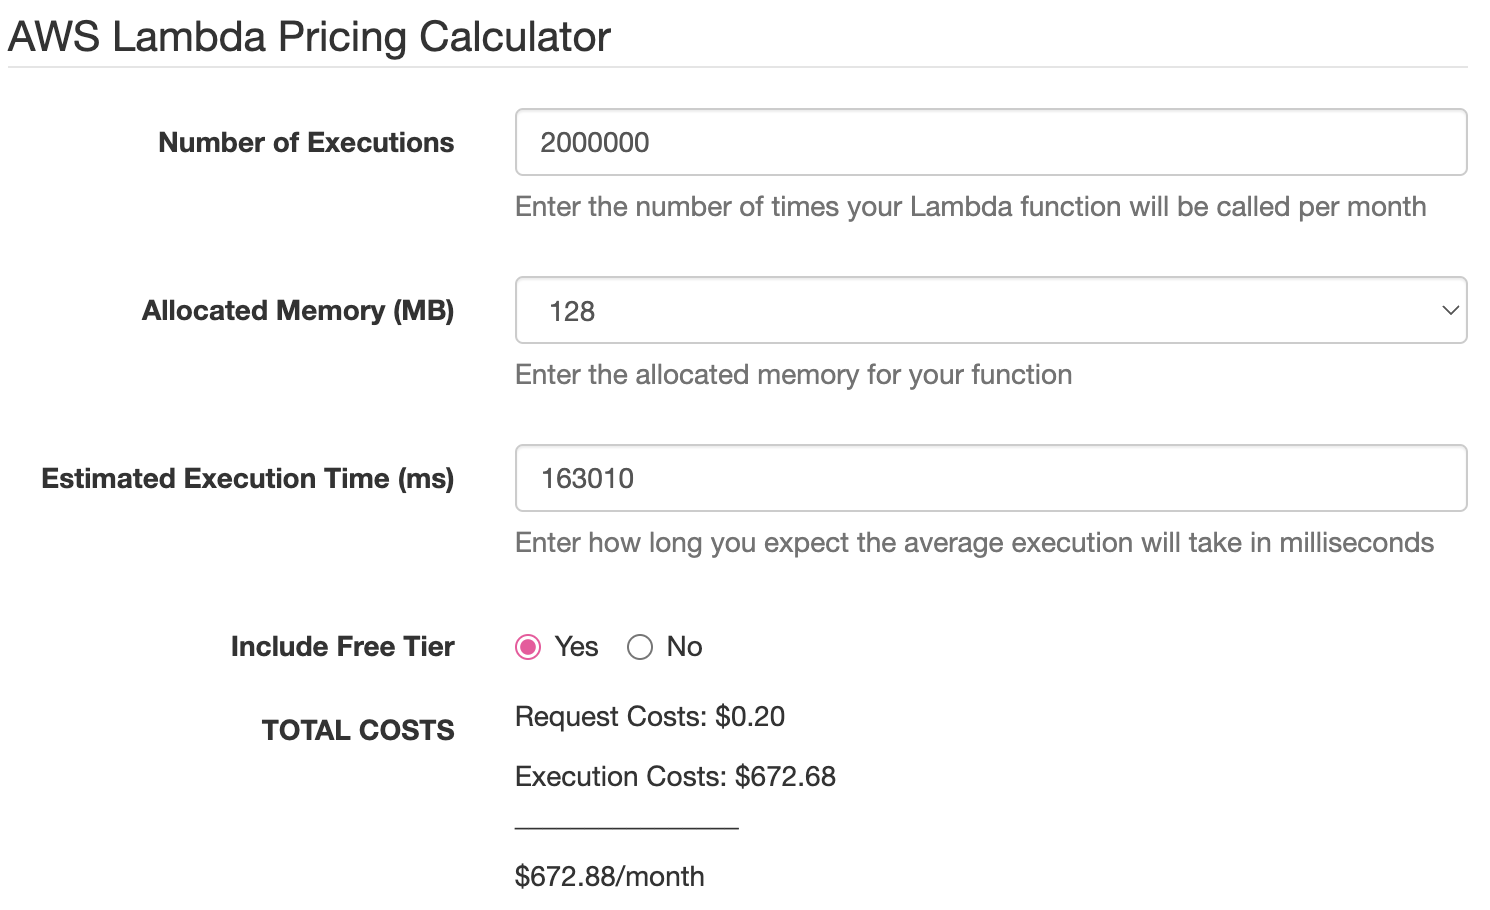
The screenshots show a difference between expected and official of only 679.12 - 672.88 = 6.24: less than 1% error.
Consider these as guidelines rather than gospel. Your own use case may alter one or more aspects of the calculus presented here. Perhaps your process lives long enough for the JVM to warm up properly, and the dynamic translator eventually overtakes the static optimizations performed by a native compiler. Or maybe you have a transpiler that allows you to write your favorite interpreted language but run it at native speeds. Or perhaps you can leverage some readily available, well-tested library that only has good bindings for your language, and that library erases the performance advantage of using a faster language.
But all other things being equal, Rust can help you improve performance, reduce operational costs, increase security and safety, and enhance developer productivity. Don’t let the lack of in-house Rust talent discourage you: Xebia specializes in cutting-edge technology, including Rust, and we can help you transition smoothly. Contact us today to learn how our Rust team can take your projects to the next level, ensuring they run faster, smoother, and cost-effectively in the cloud.
Finally, I would like to give a shout-out to my fellow Xebians, Paul LaCrosse and Valentin Kasas, who helped me with development, benchmarking, asset creation, proofing, and sanity checking. I think I am still sane, and I have them to thank for it.

