In today’s business landscape, there’s a buzz around the benefits of Power BI reports, but many are unsure where to begin. Enter the Power BI Purchase Dashboard: a powerful analytics tool allowing organizations real-time insights into their procurement activities, supplier performance, spending habits, and more. With Microsoft Power BI’s capabilities, raw procurement data turn into actionable insights, offering cost reduction, operational streamlining, and risk mitigation.
From supplier performance analysis to purchase order tracking, spend analysis, inventory management, and beyond, we will delve into the various functionalities of these Power BI Dashboards and demonstrate how it can help organizations like yours to drive business success through data-driven procurement management.
Whether you’re a small startup or a large enterprise, this blog will provide valuable insights into how you can optimize your procurement processes, enhance decision-making, and gain a competitive edge in today’s dynamic marketplace.
Purchase Analysis Dashboards
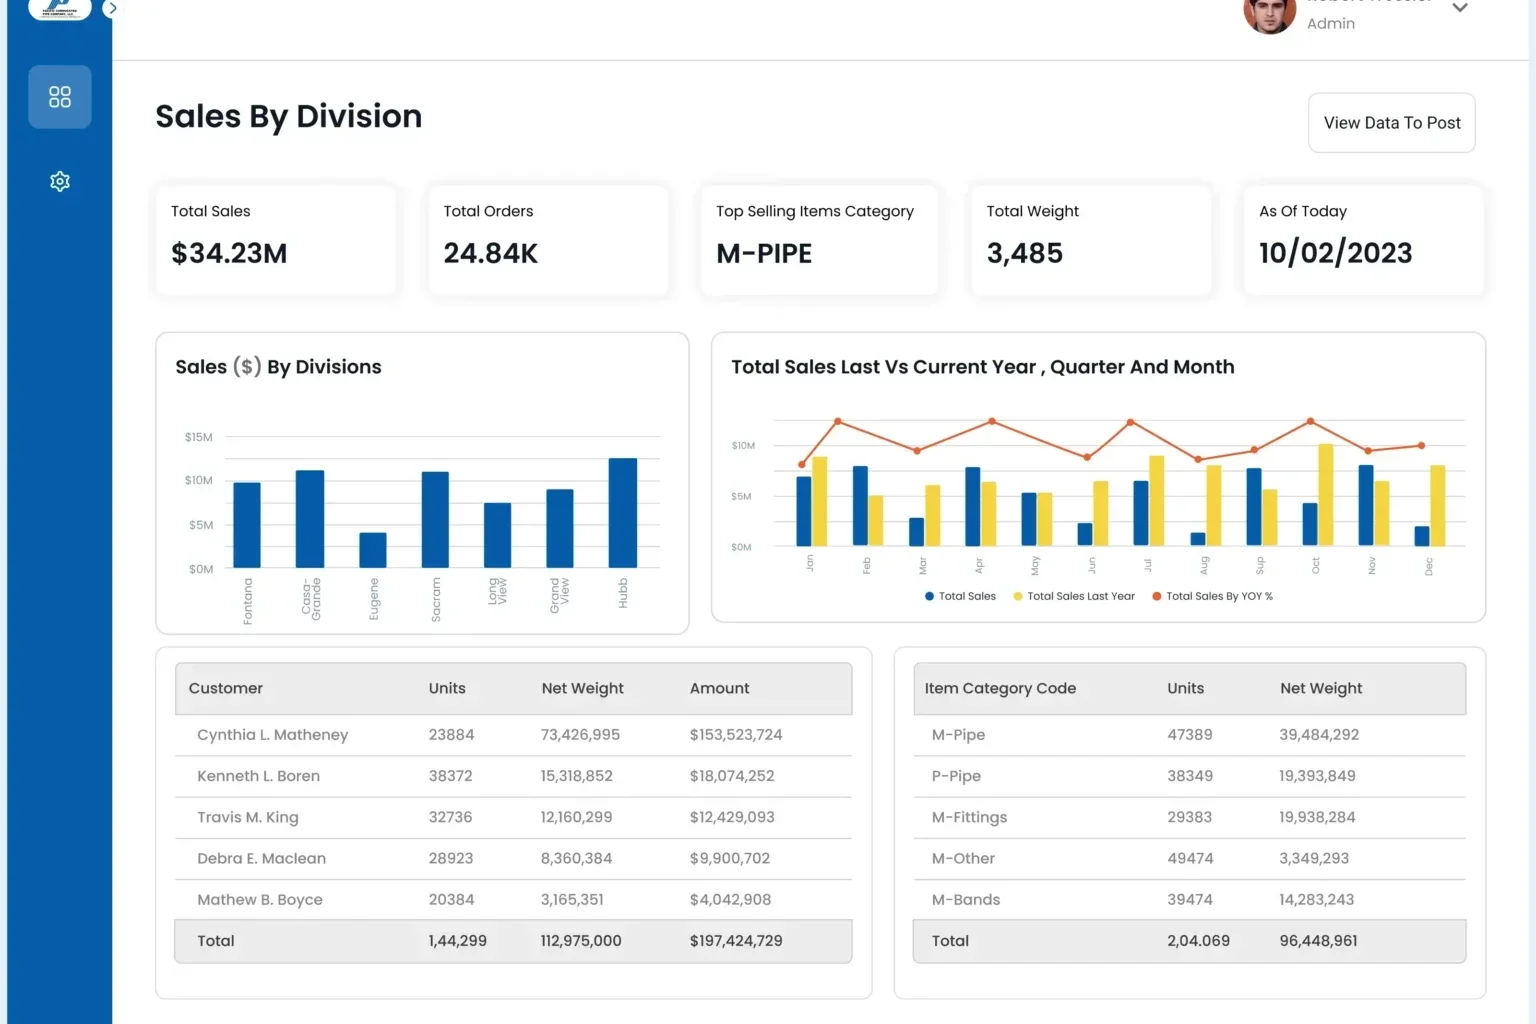
The Power BI Dashboard provides detailed insights into the company’s spending habits, offering a comprehensive overview of key metrics such as Purchase Document Count, Purchase Amount, and Invoiced Quantity. Additionally, it presents data extracted from business purchases, including the total PO Amount and Quantity, as well as any outstanding balances.
To aid in analysis, the dashboard employs visualizations such as graphs and charts, which vividly represent monthly purchase trends, average unit costs, purchase categorization, and the most significant purchases made within the specified time frame. These visual representations facilitate quick understanding and interpretation of complex data.
Furthermore, the dashboard allows users to explore deeper into specific areas of interest by offering robust filtering options. Users can customize their view by focusing on particular items, GL accounts, vendors, or fixed assets, enabling a more targeted analysis tailored to the company’s specific needs and priorities.
Types of Purchase Power BI Dashboard
Supplier Performance Dashboard
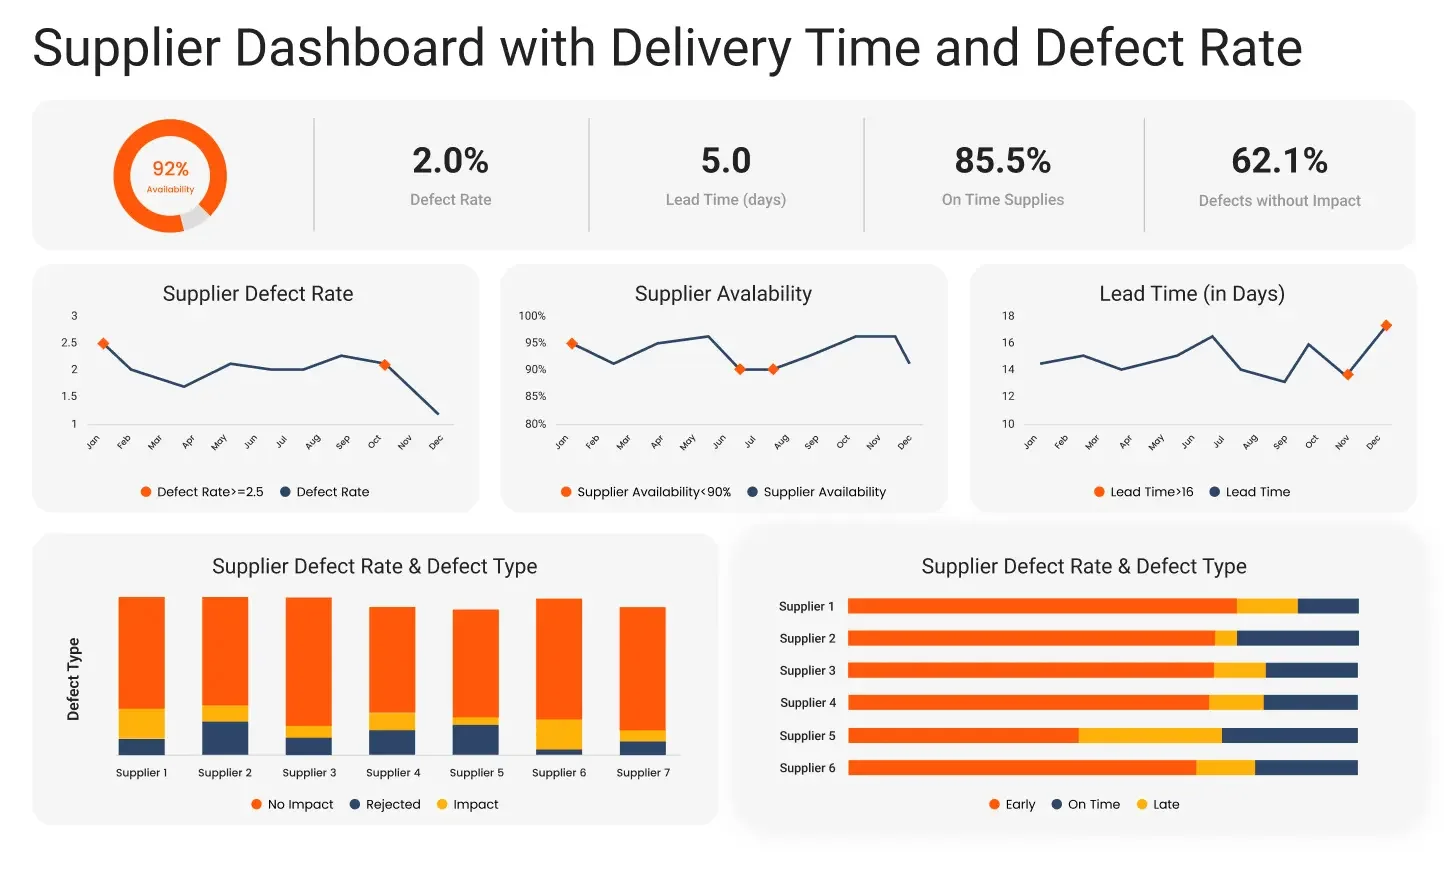
A Supplier Performance Dashboard is a tool used by businesses to monitor and assess the performance of their suppliers. It typically provides Power BI reports of various key performance indicators (KPIs) such as:
- On-time delivery rates: Measures the percentage of deliveries that are made on time as promised by the supplier.
- Quality acceptance rates: Tracks the percentage of delivered goods or services that meet the predefined quality standards.
- Lead times: Reflects the time it takes for suppliers to fulfill orders from the time of request.
- Negotiated savings: Calculates the cost savings achieved through negotiations with suppliers compared to previous agreements or market benchmarks.
The dashboard aggregates and presents this data in an easily understandable format, such as graphs, charts, or tables. It enables businesses to quickly identify areas where suppliers are performing well or falling short, allowing them to make informed decisions regarding supplier selection, negotiation strategies, and overall supply chain management. Overall, the Supplier Performance Dashboard plays a crucial role in optimizing supplier relationships and ensuring the efficiency of the supply chain.
Purchase Order (PO) Tracking Dashboard
The Purchase Order Tracking Dashboard offers visibility into the entire lifecycle of purchases. From creation and approval to order fulfillment and receipt of goods or services, it provides real-time updates on PO status, delays, or pending actions. By identifying bottlenecks and streamlining procurement processes, this dashboard ensures timely order fulfillment and enhances operational efficiency.
- PO Lifecycle Tracking: Tracks the entire lifecycle of purchase orders from creation to approval, order fulfillment, and receipt of goods or services.
- Status Monitoring: Allows users to monitor the status of POs, including pending approvals, delays, or completed orders.
- Bottleneck Identification: Identifies bottlenecks or delays in the procurement process, enabling users to take proactive measures to address them.
- Integration with ERP Systems: Integrates seamlessly with enterprise resource planning (ERP) systems or other procurement software to pull and synchronize data, ensuring accuracy and consistency.
The Purchase Order (PO) Tracking Dashboard helps SMBs streamline their procurement processes by providing visibility into the lifecycle of purchase orders. SMBs can monitor the status of POs in real-time, identify bottlenecks, and ensure timely order fulfillment. This ensures that SMBs can meet their operational needs efficiently and avoid delays or disruptions in their supply chain.
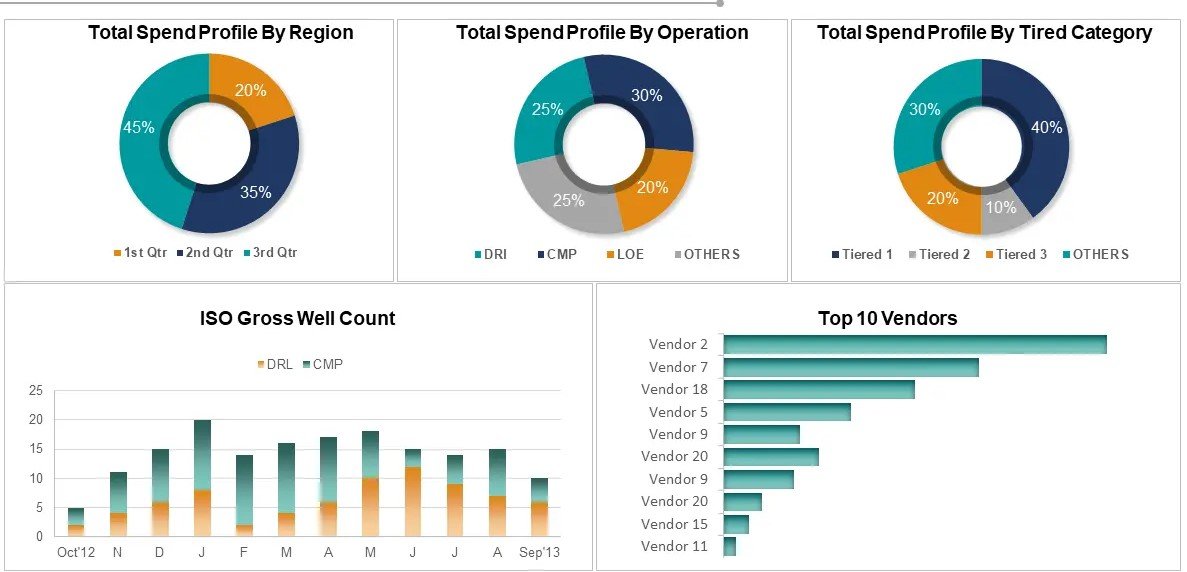
Spend Analysis Dashboard
A Spend Analysis Dashboard is a tool used by businesses to analyze and monitor their spending patterns and expenses. It provides a comprehensive view of how funds are allocated across different categories, suppliers, departments, or projects within an organization. It helps in identifying cost-saving opportunities, consolidating purchasing power, and optimizing procurement strategies. By providing actionable insights into expenditure allocation, this dashboard supports informed decision-making and cost-effective resource management.
- Spend Categorization: Classifies spending into various categories such as goods, services, travel, utilities, etc., allowing users to understand where the money is being allocated.
- Contract Compliance: Monitors compliance with contract terms and agreements to ensure that purchasing activities align with negotiated terms and pricing.
- Budget Monitoring: Tracks spending against budget allocations to help organizations stay within budgetary constraints and identify areas of overspending or cost overruns.
- Trend Analysis: Identifies spending trends over time, allowing businesses to forecast future expenditures and make informed budgeting decisions.
- Risk Assessment: Assesses potential risks associated with spending, such as supplier reliability, price fluctuations, or compliance issues.
- Ad Hoc Reporting: Allows users to generate custom reports and ad hoc analyses based on specific criteria or requirements.
- Integration with ERP Systems: Integrates with enterprise resource planning (ERP) systems or other financial management software to pull and synchronize spending data, ensuring accuracy and consistency.
The Spend Analysis Dashboard enables SMBs to gain insights into their spending patterns and identify areas for cost savings and optimization. By analyzing spending by category, supplier, or department, SMBs can identify opportunities to consolidate purchasing, negotiate better pricing, and reduce unnecessary expenses. This helps SMBs to maximize their budget and improve their overall financial performance.
Inventory Management Dashboard
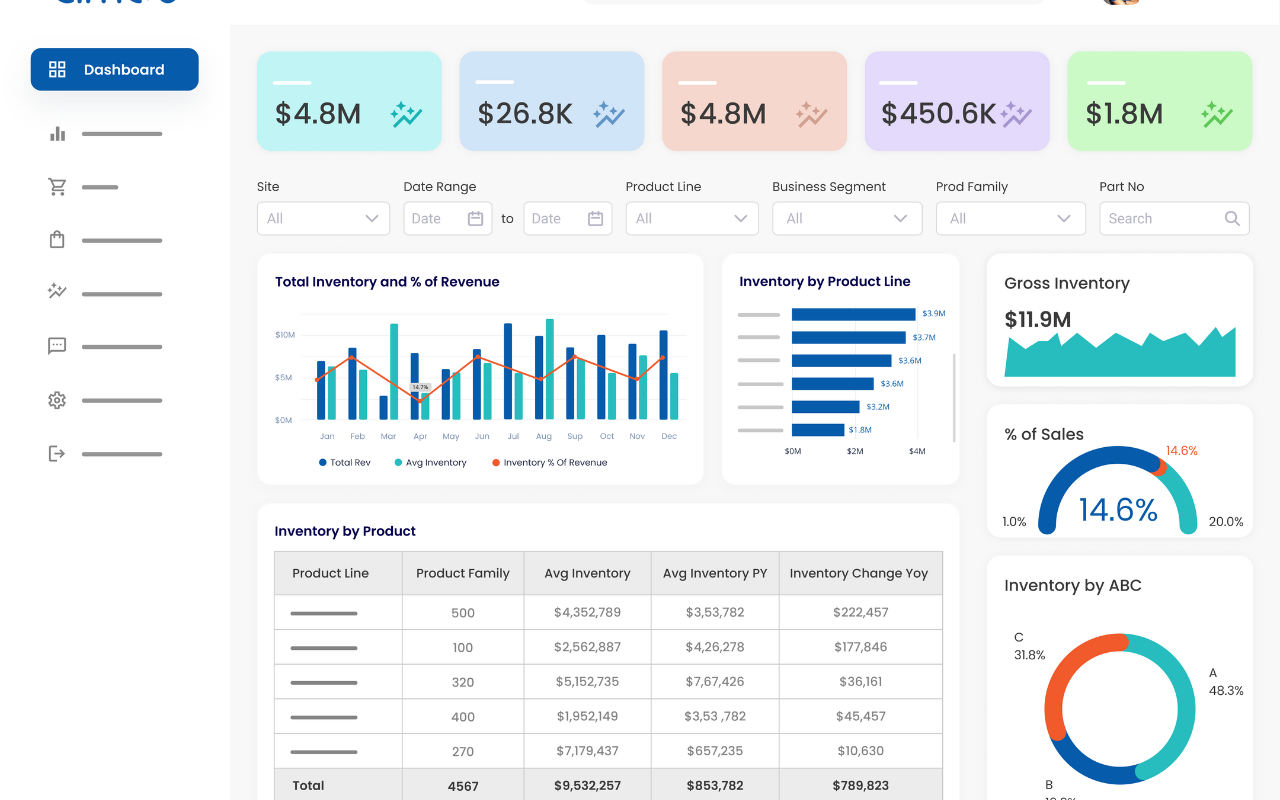
An Inventory Management Power BI Dashboard is a digital tool that provides businesses with an overview of their inventory levels, turnover rates, stock movements, and related metrics in a visual format. It offers real-time insights into inventory data, options to select item categories, enabling businesses to make informed decisions regarding stock control, replenishment, and forecasting.
- Inventory Visibility: Provides real-time visibility into current inventory levels across multiple locations or warehouses.
- Stock Movements: Tracks inbound and outbound stock movements, including sales, returns, and transfers between locations.
- Stock Status: Displays the status of each item in inventory, including available quantities, reserved stock, and backorders.
- Inventory Valuation: Calculates the total value of inventory on hand based on unit costs and quantities, providing insights into asset valuation and financial reporting.
- User Access Control: Allows for role-based access control to restrict access to sensitive inventory data and functionality based on user roles and permissions.
- Integration with Other Systems: Integrates seamlessly with other business systems such as ERP, POS, or warehouse management systems to ensure data accuracy and consistency.
The Inventory Management Dashboard helps SMBs effectively manage their inventory levels, minimize stockouts, and optimize their inventory turnover ratio. By monitoring inventory levels, reorder points, and stockout rates, SMBs can ensure they have the right amount of inventory on hand to meet customer demand while minimizing carrying costs. This helps SMBs improve their operational efficiency and customer service levels.
Budget vs. Actuals Dashboard
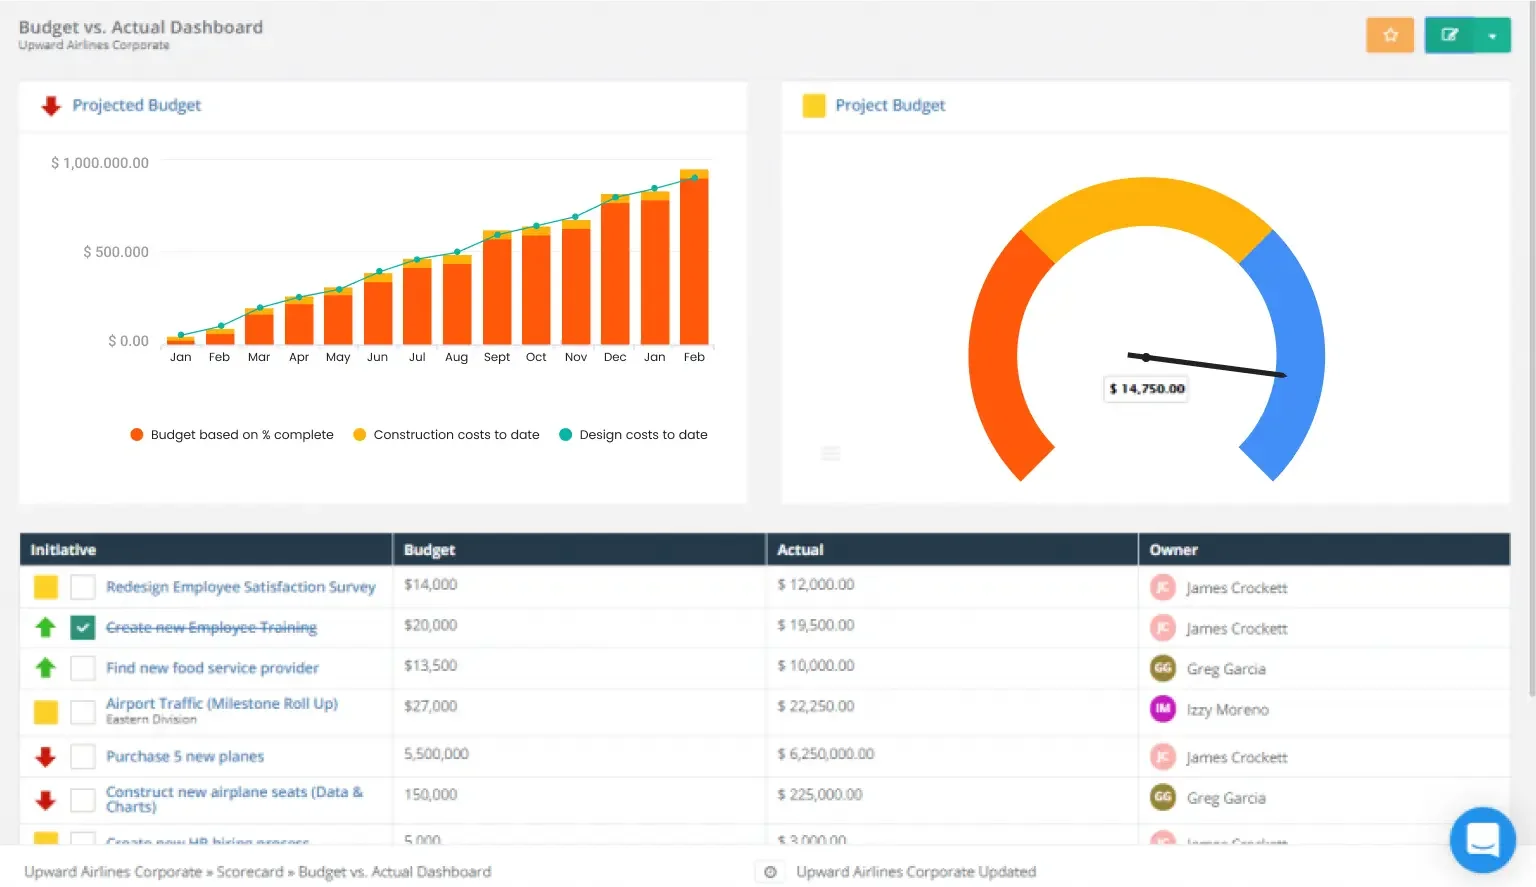
A Budget vs. Actuals Dashboard is a financial management tool that compares planned or budgeted financial figures with actual financial performance. It provides a visual representation of how actual expenditures or revenues align with the budgeted amounts, highlighting any variances or discrepancies. It enables financial planning, forecasting, and cost control efforts by providing insights into spending trends and utilization rates. By aligning actual spending with budget allocations, this dashboard supports fiscal responsibility and ensures optimal resource allocation.
- Planned Budget Display: Clear presentation of the planned budget for the specified time periods, broken down by categories such as revenue, expenses, and allocations.
- Filters and Drill-down Capabilities: Options to filter data by different categories (e.g., departments, projects) and drill down into specific details to investigate variances further.
- Variances: The differences between planned or budgeted figures and actual performance, often presented as variances in percentages or absolute amounts.
- Comparative Analysis: Capability to compare budget vs. actual performance across different periods, facilitating year-over-year or quarter-over-quarter comparisons.
The Budget vs. Actuals Dashboard allows SMBs to track their spending against their budgeted amounts and identify any variances or deviations. By monitoring budget utilization rates and identifying spending deviations, SMBs can ensure they stay within their budget constraints and make adjustments as needed. This helps SMBs to manage their finances effectively and make informed decisions about resource allocation.
Vendor Comparison Dashboard
The Vendor Comparison Dashboard evaluates and compares vendors based on pricing, quality, and delivery performance. It assists in informed vendor selection, negotiation, and performance management decisions. By providing a holistic view of vendor capabilities and performance, this dashboard fosters strategic supplier relationships and drives procurement efficiency.
- Pricing Analysis: Compares pricing structures, discounts, and total costs offered by different vendors to identify the most cost-effective options.
- Delivery Performance Tracking: Tracks and compares vendors’ delivery performance, including lead times, on-time delivery rates, and order fulfillment accuracy.
- Customization and Flexibility: Offers flexibility to tailor the dashboard to specific business needs, including adjusting evaluation criteria, adding new vendors, or modifying comparison parameters.
- Side-by-Side Comparison: Provides a side-by-side comparison of multiple vendors based on selected criteria, facilitating easy analysis and decision-making.
The Vendor Comparison Dashboard enables SMBs to evaluate and compare different vendors based on factors such as pricing, quality, and delivery performance. This helps SMBs make informed decisions about vendor selection, negotiate better terms, and build strong relationships with their suppliers. By comparing vendors side by side, SMBs can ensure they are getting the best value for their money and mitigate risks associated with working with unreliable vendors.
Power Up Your Business Intelligence with Power BI
Turn complexity into clarity with our user-friendly Power BI solutions.
Manufacturing Company Enhances Supply Chain Visibility
Challenge: A manufacturing company faced challenges in managing its supply chain effectively due to limited visibility into procurement activities and supplier performance. They struggled to identify bottlenecks, optimize inventory levels, and ensure timely delivery of materials.
Solution: The manufacturing company implemented a Power BI Dashboard to gain insights into its procurement processes. The dashboard integrated data from ERP systems, inventory management software, and supplier databases, providing real-time visibility into key procurement metrics such as purchase order cycle time, inventory turnover ratio, and supplier lead times.
Results: The manufacturing company experienced the following benefits:
- Increased Visibility: The dashboard provided stakeholders with real-time visibility into procurement activities, enabling better decision-making and resource allocation.
- Improved Inventory Management: By analyzing inventory levels and turnover ratios, the manufacturing company optimized inventory levels, reducing stockouts and excess inventory.
- Enhanced Supplier Relationships: The dashboard enabled the manufacturing company to monitor supplier performance and address issues proactively, leading to improved supplier relationships and on-time delivery of materials.
- Cost Reduction: By identifying cost-saving opportunities and negotiating better terms with vendors, the manufacturing company achieved significant cost savings.
Overall, the Power BI Dashboard reports helped the manufacturing company enhance supply chain visibility, optimize inventory management, and reduce costs.
Improving Business Growth with Power BI
A bicycle manufacturing company aimed to enhance its business operations through data analytics. Here’s an overview of how they utilized Power BI:
Challenge: The company faced several challenges, including:
- Limited visibility into sales performance and customer behavior.
- Inefficient inventory management leading to stockouts and overstocking.
- Difficulty in identifying profitable product lines and sales trends.
Solution: The company implemented Power BI to address these challenges and extract valuable insights from their data. They used Power BI to:
Sales Analysis: Dashboards in Power BI were created to analyze sales performance by region, product category, and customer segment. This enabled the identification of top-selling products, high-value customers, and sales trends over time.
Inventory Management: Power BI facilitated the optimization of inventory levels by providing visibility into stock levels, turnover rates, and demand forecasts. This helped in identifying slow-moving items, reducing stockouts, and improving inventory turnover.
Customer Analytics: Power BI was utilized to analyze customer data and behavior, including purchase history, demographics, and buying patterns. This allowed for personalized marketing campaigns, improved customer retention, and increased sales.
Results: By leveraging Power BI for data analytics, positive outcomes were achieved:
- Improved Decision-Making: Access to real-time insights enabled informed decisions about sales strategies, inventory management, and customer engagement.
- Cost Savings: Optimization of inventory levels and reduction of stockouts led to minimized storage costs and lost sales opportunities.
- Increased Revenue: Power BI identified cross-selling opportunities, targeted high-value customers, and optimized pricing strategies, resulting in increased revenue and profitability.
KPIs & Metrics
1. Total Spend:
This metric involves analyzing the total expenditure on purchases within defined time periods. It includes examining spending across different categories, suppliers, departments, or projects. Trends are analyzed to identify patterns and comparisons made with historical data and budgeted amounts.
2. Purchase Order (PO) Cycle Time:
This KPI measures the average time taken from the creation of a purchase order to the receipt of goods or services. It involves analyzing cycle time variations across different suppliers or categories and identifying bottlenecks or delays in the procurement process.
3. Supplier Performance Metrics:
- On-time Delivery Rate:
This metric assesses the percentage of orders delivered on or before the agreed-upon delivery date. It involves monitoring delivery performance over time and comparing it with contractual agreements.
- Quality Acceptance Rate:
This metric evaluates the proportion of received goods that meet specified quality standards. It includes tracking quality issues or defects and their impact on operations.
- Supplier Lead Time:
This metric measures the time taken by suppliers to fulfill orders from the point of purchase to delivery. It involves comparing lead times across different suppliers to identify opportunities for improvement.
- Savings Achieved:
This metric calculates cost savings achieved through negotiations, volume discounts, or alternative sourcing strategies. It includes benchmarking against industry standards or market rates.
- Purchase Order Accuracy:
This metric analyzes purchase order completeness and accuracy, including item descriptions, quantities, and pricing. It involves identifying errors or discrepancies in POs and their impact on procurement efficiency.
4. Spend Analysis:
- Spend by Category, Supplier, Department, or Cost Center:
This analysis provides a detailed breakdown of spending to understand where resources are allocated. It involves identifying areas of overspending or opportunities for cost reduction and comparing spending across different dimensions to prioritize strategic initiatives.
5. Budget vs. Actuals:
- Budget Variance:
This analysis examines the variance between planned budgets and actual expenditures. It involves investigating reasons for budget discrepancies and implementing corrective actions.
- Budget Utilization Rate:
This metric calculates the percentage of the budget utilized within a specified timeframe. It involves monitoring budget utilization to ensure efficient resource allocation and adherence to financial plans.
6. Vendor Performance Scorecards:
This involves developing scorecards to evaluate vendor performance based on predefined criteria. It includes regular reviews and feedback to suppliers to drive continuous improvement and integrating vendor performance data into supplier relationship management processes.
7. Purchase Order Aging:
This involves identifying aged purchase orders and analyzing their impact on operations. It includes root cause analysis to address delays or discrepancies in the procurement process and implementing measures to reduce PO aging and improve procurement efficiency.
8. Contract Compliance:
This involves monitoring supplier adherence to contractual terms and conditions. It includes tracking contract renewal dates and renegotiation opportunities and resolving contract disputes or non-compliance issues through effective contract management processes.
9. Inventory Metrics:
- Inventory Turnover Ratio:
This metric calculates the number of times inventory is sold or used within a given period. It involves optimizing inventory levels to minimize carrying costs and stockouts.
- Stockout Rate:
This metric measures the frequency or duration of stockouts. It involves analyzing stockout causes and implementing measures to mitigate their impact on operations.
By focusing on these detailed procurement KPIs and metrics, organizations can gain valuable insights into their procurement processes, drive operational efficiency, and achieve strategic objectives.
Benefits of Power BI Purchase Dashboards
Real-Time Insights
Access to up-to-date procurement data allows stakeholders to make quick decisions and adapt to changing market conditions. It also helps manage inventory, supplier relationships, and budgets more efficiently. By combining these benefits, organizations can streamline procurement processes and improve overall performance.
Data Visualization
By utilizing interactive and visually engaging charts, graphs, and maps, complex procurement data is presented in an understandable format. This enhances data comprehension and analysis, highlighting trends, outliers, and relationships visually. Through this merging of techniques, users can more easily identify patterns and anomalies, improving decision-making processes.
Customization
The system provides customizable dashboards, allowing users to tailor layouts and select relevant metrics according to organizational needs and personal preferences. This flexibility empowers users to personalize their dashboards, focusing on specific areas of interest or concern, and enhancing usability and effectiveness.
Self-Service Analytics
With Power BI Dashboards, business users can independently explore, analyze, and extract insights from procurement data, freeing them from reliance on IT or data analysts. This capability reduces the time and effort needed to create ad-hoc reports or conduct analyses, resulting in faster decision-making and problem-solving.
Integration with Multiple Data Sources
Power BI integrates with various data sources, such as ERP systems, databases, cloud services, and third-party applications. It unifies procurement data from these diverse sources into a unified platform, offering a comprehensive view of purchasing activities organization-wide. This merging of capabilities streamlines data management and enhances decision-making processes.
Mobile Accessibility
With mobile access support to dashboards and reports through dedicated mobile apps or web browsers, Power BI allows users to stay informed and engaged with procurement insights on smartphones and tablets. This capability ensures continuous monitoring and management of purchasing activities, even while on the go, enhancing accessibility and responsiveness.
Collaboration and Sharing
It improves collaboration among stakeholders by enabling the sharing of reports, dashboards, and insights with colleagues, partners, and customers. This promotes transparency, accountability, and alignment across teams and departments, fostering a data-driven culture within the organization. Through this merging of capabilities, stakeholders can work together more effectively and make informed decisions collaboratively.
Cost-Effectiveness
Power BI is a cost-effective solution for procurement analytics compared to traditional business intelligence tools, offering flexible pricing options and scalable deployment models. It achieves this by eliminating the need for expensive hardware infrastructure, software licenses, and ongoing maintenance, ultimately reducing the total cost of ownership. This merging of affordability and efficiency makes procurement analytics more accessible and sustainable for organizations of all sizes.
Overall, the Power BI Dashboard empowers organizations to gain actionable insights into their procurement processes, improve efficiency, reduce costs, and drive strategic decision-making.
Conclusion
Through features such as supplier performance analysis, purchase order tracking, spend analysis, inventory management, budget vs. actuals comparison, vendor comparison, and procurement KPI monitoring, organizations can gain valuable insights into their purchasing activities, identify areas for improvement, and drive continuous process optimization.
Furthermore, the benefits of the Power BI Dashboard extend beyond operational efficiency like collaboration, cost-effectiveness, and mobile accessibility. By facilitating collaboration and sharing, reducing total ownership costs, and providing access to insights on the go, this tool allows organizations to foster a data-driven culture and achieve sustainable growth.
In essence, the Power BI Purchase Dashboard serves as a strategic asset for organizations of all sizes, enabling them to utilize the data for procurement excellence, enhance decision-making, and achieve competitive advantage in today’s dynamic business landscape. Sunflower Lab can be a great supporting partner in your Power BI journey with its excellent Power BI Experts. Contact Us today and we will be happy to assist you further.
You might also like
Stay ahead in tech with Sunflower Lab’s curated blogs, sorted by technology type. From AI to Digital Products, explore cutting-edge developments in our insightful, categorized collection. Dive in and stay informed about the ever-evolving digital landscape with Sunflower Lab.