


When we think about innovation, most of us default to innovation on product/servicing offerings. While offering innovation is very much part of the innovation process, it’s not the only type of innovation, and some might even argue it’s the easiest for competitors to copy. And regardless of what we think innovation is, many of us may wonder how to innovate beyond just relying on the instincts of talented individuals. One way is to incorporate data and analytics to inform decisions on innovation using a framework.
In this article, we will:
- Review different types of innovations
- Provide examples of how some companies have implemented them through data and analytics
- Briefly articulate how AI can create an innovation flywheel effect
- Lay out capabilities to more easily use data and analytics to drive the innovation process
We will lean on frameworks and ideas from others, including:
- Ten Types of Innovation: The Discipline of Building Breakthroughs (Doblin, a Deloitte business)
- Ten Types of Analytical Innovation (Tom Davenport)
Types of Innovations
Doblin, a Deloitte business, describe three types of innovation:
- Configuration, which focuses on the internal business operations
- Offering, which is about the product or service itself
- Experience, which is how customers interact with the product, service, and business
Each of the innovation types themselves have components, which are described in Figure 1. Let’s highlight a few with examples.
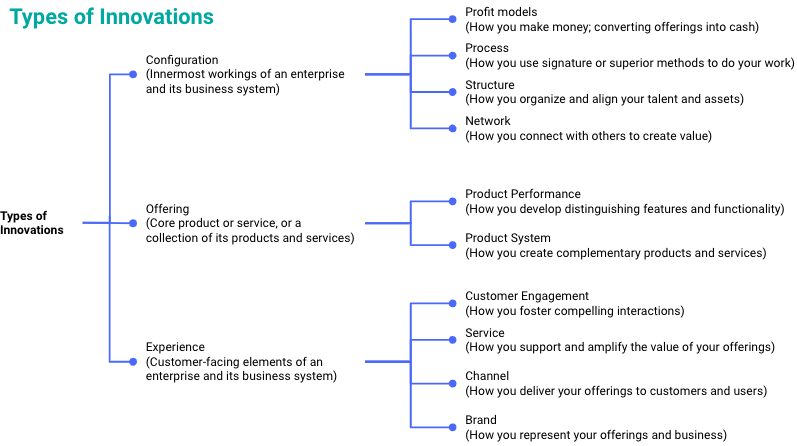 Figure 1: Types of innovations
Configuration Innovation
Within configuration innovation, let’s discuss profit models. The first step in innovating profit models is, arguably, to deeply understand what your customers and users truly value. This makes it far easier to determine the what, how, when, etc. of the offerings, the differentiation of those offerings, and how they can challenge the status quo for customers. Gaining that understanding across a wide audience is hard — it requires collecting data and making sense of it, and frequently that meaning is hidden in words, so it’s not as simple as creating a dashboard with numbers.
But Unilever is able to do this, as described in a Harvard Business Review article. They used AI to automatically and rapidly analyze customer opinions and feedback captured as text data to better understand how their customers engaged with their brands and products and what their needs were. As a result, they derived $550 million in total benefits (incremental sales and cost savings). In addition, they achieved these results despite having few data scientists (of their 250+ users, 96% were not data scientists), and this ability for the lines of business and analysts to use AI enabled them to launch 2,000+ projects in one year to find value-generating opportunities. Going forward, Unilever plans to use AI for marketing personalization, influencer marketing fit, and churn reduction among other use cases.
Also within configuration innovation is process innovation. All businesses rely on several processes, and many times we are frustrated with their manual and inefficient nature. AI can improve these pain points by analyzing the vast data points to create predictions that can be further used to optimize process metrics. Let’s take a look at some examples.
1. Sales Process
Most wealth management financial advisors (and many other sales-related positions) have too many clients to track. This creates a conundrum for them — how can they spend time developing relationships and researching ideas to advise clients while also reminding less active clients about their services in a way that is relevant to each individual client? Morgan Stanley Wealth Management uses Next Best Action to personalize client communication and engagement through AI-based recommendation engines. As a result, tailored messages can be created in 10 minutes vs. the typical 45 minutes when done manually, resulting in five to six more outbound calls per day, and enabling financial advisors to balance resources between active and less active clients.
2. Research and Development Process
Like most industrial companies, GE Aviation uses scientific equations to run experiments — in their case they use computational fluid dynamics (CFD) simulation, which requires two days for a single design of a turbine blade or engineering component. As described in a Forbes article, they turned to artificial neural networks, which, although they tend to be less accurate than CFD, enable design variations to be run in 15 minutes (192 million times faster), leading to 2x faster design of products. And version one was built by a chemist vs. a data scientist.
3. Production Process
Semiconductor manufacturing is difficult (that’s putting it mildly!) and defect detection is hard and costly. NXP Semiconductors was experiencing a 45% defect rate and 3-4 days time to defect detection due to unwanted particles in manufacturing materials. Using virtual metrology driven by AI, they were able to predict particle-related measurements on a continuous basis (vs. taking measurements only every 3-4 days), thus reducing the defect rate from 45% to 5%. Engineers (not data scientists) developed the solution.
4. Logistics Process
One CPG company loaded 288 vans with product from 32 warehouses to serve 79,000 points of sales based on a demand planner. At the end of each business day, unsold products needed to be scanned and placed back in the warehouse shelves, resulting in 38.5 million carton movements, 50% unloads, and 30 million scans. Using AI improved forecasting accuracy by 20%, saved 25% on carton movements, reduced uploads by 15%, and increased productivity 5x through automation — all without causing out-of-stock situations at the truck level.
Offering Innovation
Let’s move to offering innovation. The data and analytics opportunities here are about instrumentation — tracking customer behavior and products — to better understand them, how the products are used, and to anticipate customer needs and product improvements. This could be done in software products (e.g., browsers regularly track activity) and non-software products (e.g., using sensors and the Internet of Things to track physical movements and status).
One example is Oshkosh Corporation, a company that builds heavy vehicles like trucks and military vehicles. They equipped their trucks with IoT sensors to transmit vehicle status and location to determine service needs in real-time. They also monitored oil degradation and used predictive maintenance to determine the right time for oil changes, thereby reducing vehicle maintenance intervals 2-3x and downtime and support costs 50% over the life of the vehicle. It was mentioned earlier, but it bears repeating here: Offering innovation is probably the easiest type of innovation for competitors to copy even with patents in place as competitors match each others’ functions and features.
Experience Innovation
Finally, let’s highlight a few points in experience innovation, and more specifically, customer engagement and service, both of which significantly impact customer loyalty and stickiness.
- Customer Engagement Experience: Levi’s wanted to increase the relevancy of their online recommendations for customers, and they needed to do this in real-time, while avoiding problems like recommending non-relevant items (e.g., showing men’s jeans to a female shopper or showing a jean style that was out-of-place relative to other jeans). They solved the relevancy problem using AI models to implement different algorithms that were suitable for different customer profiles: e.g., popularity-based for brand new customers that they knew very little about, association rules mining for browsers who haven’t identified themselves, and similarity-based for customers they had more information on.
- Service Experience: One construction machinery and equipment company implemented predictive maintenance to improve their products. Predictive maintenance is a value-added service, and through this they were able to increase the uptime of their products 8%, resulting in savings of $1.7 million per truck per year. This service also increased customer loyalty, resulting in an 18% increase of the spare parts market share (from 80% to 98%) and driving hundreds of millions of dollars of revenue.
The AI Flywheel Effect to Drive Innovation
AI is especially helpful for innovation because of the AI flywheel effect (Figure 2 below). Here’s how it works:
- A company with products/services will acquire users, customers, installs.
- The company collects data on users and their activities.
- They use AI to learn more from the data.
- This learning translates to better AI applications/products/services.
- Naturally, a better product becomes more well-known and leads to new user acquisitions or to current users using the applications/products/services even more.
- This results in even more data, more learnings, better applications/products/services, and so on.
What is unique about AI vs. other analytics types is its ability to continuously learn/improve from the data (almost on its own).
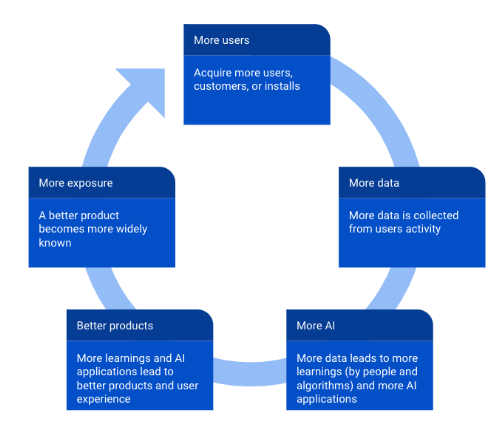
Figure 2: The AI flywheel effect
Data and Analytics Capabilities to Drive the Innovation Process
Unfortunately, driving innovation using data and analytics (including AI) doesn’t happen automatically. Once the data is collected, it needs to be turned into information/intelligence to be acted upon by businesses. This transformation happens through an analytics workflow (refer to Figure 3). Platform developers like Dataiku enable analysts, LoB members, data scientists, and many other personas to create innovation insights using capabilities built into the workflow. Generally speaking, the more capabilities and the easier they are to use, the more and the faster the insights can be created — some Dataiku customers have seen 70%-90% time savings for both BI and AI data products. Please note that the same workflow drives both business intelligence analytics and AI analytics. So — by using a platform that enables all personas to create this workflow — BI, AI, or both BI and AI analytics can be achieved through largely the same datasets.
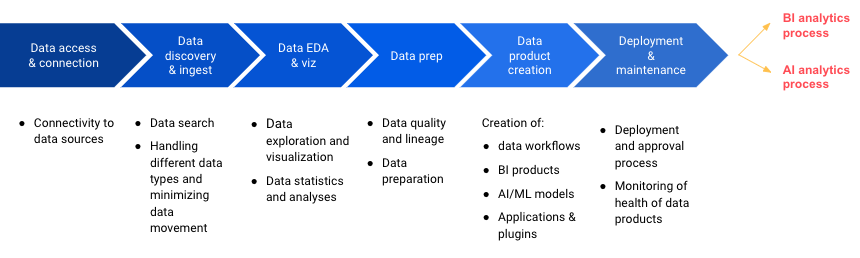 Figure 3: Data and analytics workflow capabilities
Conclusion
We’ve discussed a framework for your organization to drive many types of innovation by leveraging data and analytics to gain insights into customer behaviors and product/service use, to enhance product and service offerings, and to configure/improve internal resources. We also saw how many organizations today are using AI to innovate, and how the AI flywheel effect can ramp up your ability to drive innovation. Finally, we presented capabilities that organizations need to harness their data and to perform analytics (including AI) on them to make that data useful for making innovation decisions and executing innovation plays. These capabilities are offered by the Dataiku platform, and we invite you to learn more about the product and its role in innovation.