


It’s a dev-centric world.
There’s never been more value placed on developer experience (DX) than there is today. You’ll hear terms like “friendly DX,” “seamless DX,” etc., but I’ve personally taken kindly to the phrase “lovable DX” — a term that I first heard at GitLab during my time working there. Not only is it unique, but it’s a great descriptor for the level of care and intentionality that goes into creating an environment conducive to developer productivity and efficiency. After all, a friendly, or lovable, DX goes hand-in-hand with better developer productivity and efficiency.
As companies look for ways to improve developer experience, they’re gravitating towards engineering intelligence tools that provide insights into the development process as a whole to better understand how to increase developer productivity in parallel. I came across a great post by Mark O’Neill, Chief of Research at Gartner, that explains just how important this is:
Inquiries on developer productivity are up 178% in the past 12 months. And up 325% so far in 2023 from the same period in 2021. Many inquiries ask about how to "get more from less,” about the use of engineer intelligence tools to gather metrics, and now how AI can improve developer productivity.
The industry vertical shift is particularly striking. In 2021 the top industry asking about developer productivity was tech/telecoms. During 2022 that flipped over to banking/finance/insurance which is very much the top sector now in 2023 asking us about developer productivity.
Maximizing developer productivity is top of mind for everyone right now and this trend doesn’t appear to be slowing down anytime soon. Businesses of sizes are inquiring how to “get more from less,” and realize there’s a symbiotic relationship with business outcomes when developers and their teams are happy, productive, and efficient. That’s where data comes into play as a tool to power productivity.
It’s important that visibility into engineering data doesn’t come across like “big brother” for developers though (watching their every move in a sinister fashion), and instead acts as a helper to understand how to improve based on facts. Visibility into what’s working and what’s not only goes so far – it’s the conversations and actions that follow which are paramount to driving positive change.
I’d challenge you to ask yourself, “Does your data tell the whole story?” And more importantly, what can you DO with that data to drive the healthy cultural change that leads to higher-performing development teams and more productive developers?
More software, more problems
According to the Evans Data Corporation, there are just under 26 million developers worldwide, with that number continuing to grow exponentially year over year. As companies compete to gain an edge in digital markets and meet consumer demands, more applications are being built, more tools are involved throughout development, and added complexity in the SDLC can introduce problems that require more software to solve, relying on this growing developer population to do so. This creates more demand for skilled developers and places a higher value on their productivity/efficiency. This is especially true during times when poor market conditions force companies to operate leaner but achieve equal or greater results compared to when market conditions are favorable.
The role of DevOps and VSM today
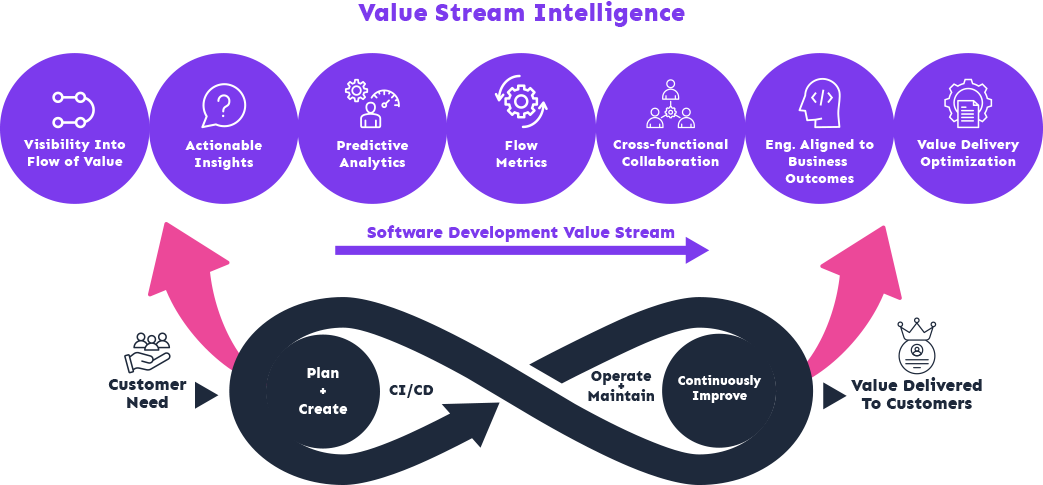
We’re starting to see the evolution of DevOps and its widespread adoption over the years pave the way for concepts like Value Stream Management (VSM) to thrive, leveraging data as a catalyst for change. DevOps and VSM have similar goals – deliver software better and faster and get value into the hands of customers sooner.
However, DevOps focuses on optimizing people, tools, and processes by automating everything and breaking down organizational silos in order to foster collaboration. Where DevOps can help get faster feedback and get in front of potential issues, VSM can take things to the next level with a deep understanding of how software is delivered backed by meaningful data.
VSM provides a way to put DevOps principles into practice and truly understand what's happening within your end-to-end SDLC. You can accurately measure things like productivity or efficiency and identify trends that inform how to properly address inefficiencies at individual levels, team levels, or in aggregate across your organization.
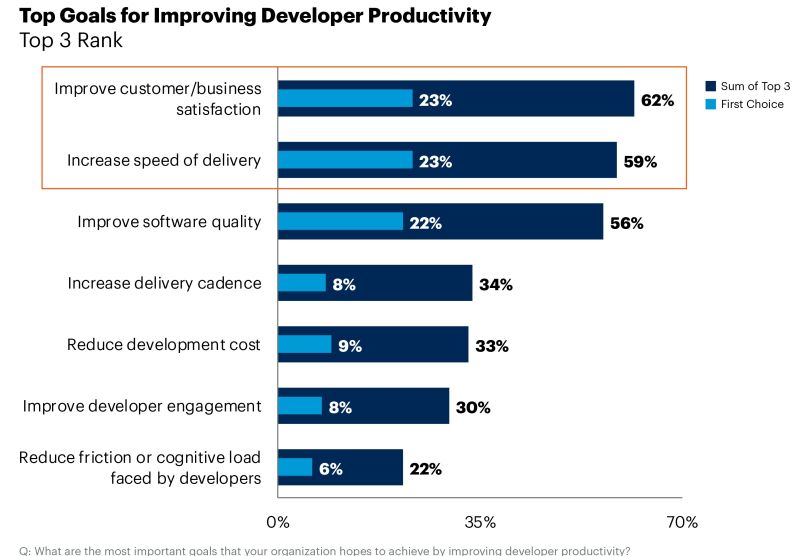
The top outcomes from adopting these methodologies align with the same goals for improving developer productivity cited earlier: improving customer/business satisfaction and increasing speed of delivery. I say this to point out the direct relationship between developer productivity and how important it is to the business to remove non-value-adding work from developers’ plates for them to reach their potential, both individually and in terms of the ROI for the business. The primary job of developers is to deliver value at the end of the day. The more productive they are, the more value that gets delivered. It sounds easy when stated in such simple terms, but as the old adage goes, you can’t measure what you can’t see.
That’s where solutions like Allstacks come into play.
Lights, data, action!
There’s been a proliferation of development-centric frameworks that focus on establishing metrics to measure productivity because it’s a difficult proposition for developers to measure their own productivity in the way that companies measure the value of what they deliver. For a majority of organizations, measuring these things has been a historical black box, where Agile and DevOps methodologies introduce metrics that speak to engineering efficiency and productivity at an operational level based on activity/output and development deliverables, but don’t align those outputs directly to business outcomes. They often overlook nuances throughout development workflows such as wait states and cross-functional approvals, etc. On the surface, a metric like number of deployments to production over a given time period only goes so far if leaders at your organization can’t answer the question “how has this impacted our business and helped us reach our strategic goals?” Without being able to answer questions like this, the default behavior becomes “how am I supposed to justify our development investments and the associated cost when I don’t know what we gain by shipping more frequently? How has this impacted our OKRs?”
Context is key. Data and metrics help provide visibility. But it’s what you do with this information to equip development teams and engineering leaders with what they need to be successful and perform better that matters most.
Let’s get into a few key steps that can help you maximize developer productivity and reap the benefits of contextualizing engineering metrics with Value Stream Intelligence.
Turn the lights on
First and foremost, you have to make sure that your data isn’t left in the dark because you can’t manage what you can’t measure. It’s easy to assume that baseline activity or event-driven metrics from SCM or CI/CD tools across your tech stack can provide what you need on their own, and it’s simply about collating the data across these tools individually. In reality, that almost always proves to be more difficult and time-consuming than originally perceived. Before you know it, sifting through this data turns into a much larger effort and you’re building a homegrown tool to measure engineering metrics instead of capturing and organizing data streams that already exist within your workflow.
Introducing a solution like Allstacks saves you a ton of time and pain on the front end by ingesting data across your git-based SCM of choice, build tools, and project management tools like Jira or Azure DevOps. Rather than days or weeks, you can “turn the lights on” in minutes and start on the path towards measuring development productivity and efficiency in a way that translates into business value by using the structure and naming conventions inherited from your development workflow and data. You’re no longer looking at isolated metrics that lack context outside of a single tool, but instead visualizing and tracking engineering metrics in aggregate like PR response time, development velocity across teams, cycles time, lead time, bug fix rate, and more in a way that maps to strategic business objectives all the way down to individual contributions by developers.
Extract meaning from data
Once you’re out of the dark, you can start to measure, understand, and interpret data in a way that puts meaning to these metrics. Extracting meaningful insights from data isn’t always straightforward. A single metric, like code commit volume, can be misleading without the proper context.
There are ways to make up ground if you’re starting from scratch and trying to make sense of fresh data. Many teams have success by adopting one or more of the popular frameworks that exist today to help consolidate and contextualize engineering metrics in a more prescriptive manner. Consider using these to help establish a starting point:
DORA
- DORA metrics focus on four key metrics to classify development teams’ performance based on scores for speed with Deployment Frequency and Lead Time for Changes, as well as stability with Change Failure Rate and Mean Time to Recovery (MTTR). Organizations embracing DevOps or undergoing transformation have been adopting this framework in large numbers since its creation in 2018 by notable thought leaders Nicole Forsgren, Gene Kim, and Jez Humble. It’s often a good starting point for companies early on in their journey to modernize and transform their software delivery.
SPACE
- SPACE is particularly useful here because it focuses entirely on developer productivity. With this in mind, SPACE looks at Satisfaction and well-being, Performance, Activity, and Communication and collaboration, and Efficiency and flow. I really like the fact that SPACE acknowledges and values the human side of developer productivity and encourages looking at multiple dimensions for any given metric. For example, developer productivity = story points completed is less valuable than developer productivity = story points completed + PR cycle time + customer satisfaction.
Nicole Forsgren, also the creator of SPACE, gives some good insight into her motivations with “Developer productivity is complex and nuanced, with important implications for software development teams. A clear understanding of defining, measuring, and predicting developer productivity could provide organizations, managers, and developers with the ability to make higher-quality software—and make it more efficiently.” She follows this with, “Productivity cannot be reduced to a single dimension (or metric!)”
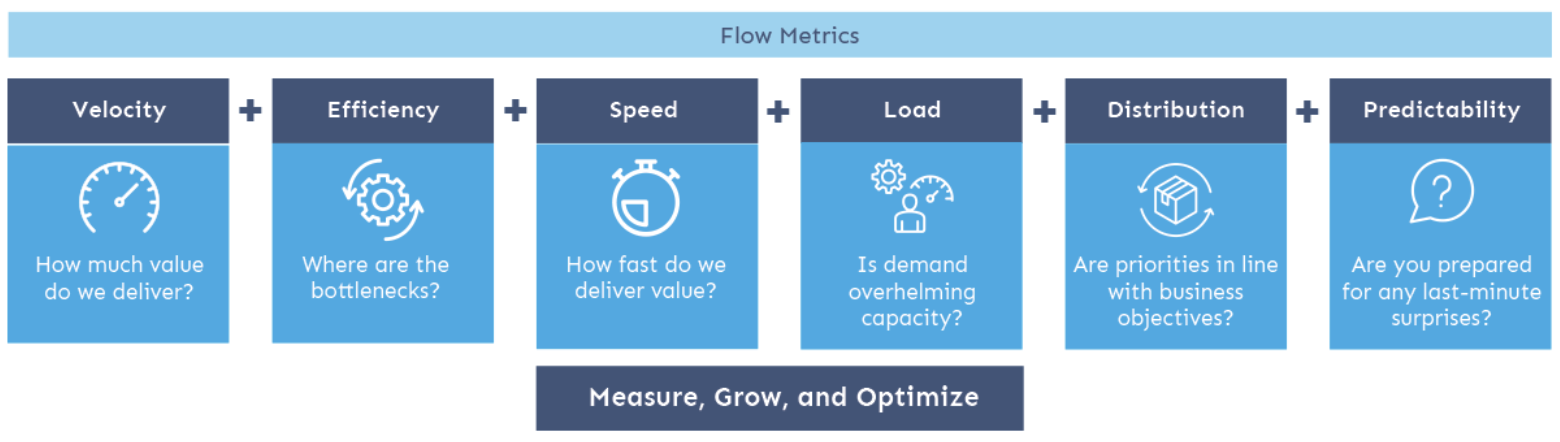
Flow:
- Flow metrics provide yet another angle to extract meaning from data and is a dogmatic approach directly related to VSM. It views each step of software development as work that must create value for the business. The 5 core metrics are:
- Flow Velocity: Is value delivery accelerating?
- Flow Efficiency: Is upstream work holding up delivery?
- Flow Time: Is time-to-market getting shorter?
- Flow Load: Is demand vs. capacity being balanced?
- Flow Distribution: Are we investing in both business value generation and protection?
Flow goes a long way in aligning business value to development work and encourages cross-functional conversations to ask questions that otherwise could be overlooked, and make decisions that directly impact business outcomes at a strategic level. Things like, “How is delivery impacting revenue, cost, and overall quality” or “What exactly is slowing down our delivery of value” are questions that Flow helps answer and improve.
Regardless of your approach or the metrics you care about most, Allstacks can provide a single source of truth that aligns developers around data-driven insights and business motivations in a language everyone understands, allowing for conversations to revolve around how to improve aspects like productivity. There’s no better intrinsic motivation to maximize developer productivity than ensuring that the value produced at an individual and team level can be easily measured, understood, and connected to the business.
By the way, if you’re curious to learn more about these frameworks, this is a great resource to check out about simple engineering metrics to measure efficiency.
Take action from what you learn
It’s important to ensure you’ve started developing engineering KPIs that can align with broader company-level objectives once you’ve turned the lights on and have established a baseline for understanding your data. Then, bring teams together with unified data, process visibility, and forecasting across the entire business that’s put into context to make collaboration and decision-making easier with a solution like Allstacks for Value Stream Intelligence.
Which actions you take depend on the needs of the business and your strategic objectives. With a clear view of your value stream, you can identify where to improve, reprioritize and orchestrate resources, and build cross-functional relationships that break down organizational silos.
What you can do:
- Understand where you are today, establish goals, and determine what you want to measure.
- Use engineering data to your advantage – whether you choose a popular framework to leverage or not, get all of your data under one roof.
- Don’t forget the human. Use the insights you gain to help build, or grow, healthy relationships between engineering leaders, developers, and customers.
- Connect developer output and engineering metrics directly to the business. Make sure that engineering teams understand how the value they create ends up in the customer’s hands.
- Trust in the process, open communication lines, and don't be afraid to ask the hard questions when discussing how to get better based on the intelligence you gain.
- Iterate to make incremental improvements towards your goals and value progress over perfection.
At Allstacks, we’re in the business of making sure that you get a complete view of your end-to-end software delivery process and can take action based on what you learn to improve. Interested in a quick walkthrough of how Allstacks can help your engineering team? Book a free demo today!

like this? share it: