


Most of us are well aware of the problems that can arise in data as a result of human bias — disparate outcomes, unfair policy, missed opportunities, the list goes on. When the power of AI is applied to sensitive situations, we start to worry about the danger that a mix of machine learning and bias can produce. So, what’s there to do about it?
Responsible AI is the framework through which an organization can craft its AI pipelines while appropriately addressing the potential of unintended consequences. Data scientists involved in building models may feel as though they don’t have much control over these outcomes, but we are here to tell you that that is not the case.
This blog revisits a Dataiku Product Days session where Dataiku’s very own Jacqueline Kuo (Solutions Engineer), Sibongile Toure (Data Scientist), and Andy Samant (Senior Data Scientist) shared the ways in which they interact with Responsible AI initiatives and demonstrated exactly how the various tools and techniques of Dataiku can be maneuvered to support these specific project goals.

Zooming In on Building AI Pipeline
The AI pipeline involves many stages, but we are going to start by zooming in on the part that data scientists are most integral to — building.

Within the building step of the pipeline there are three main stages:
- Data processing (cleaning and crafting features)
- Model building (making the model)
- Reporting (looking into performance)
In all three categories, in order to catch bias, it’s critical to be aware of the sensitive categories and attributes of your models. Let’s look at how we can be especially attuned to these factors through the three stages in this project example below.

The Coupon Redemption Project
After you make a purchase it's not uncommon to receive coupons in your mail or inbox following the purchase. For this project, our data science team wanted to do some digging into the data to see if the coupons are being sent out in a biased fashion. Let’s check it out!
Project Objectives
- Predict whether a customer will redeem a coupon
- Ensure that individuals in each age range have the same opportunity to receive a coupon (based on the model)
The Data
- Customer characteristics
- Customer sales
- Coupon attributes
- Sensitive attribute (age group)
- Target variable: redemption status
Cleaning the Data
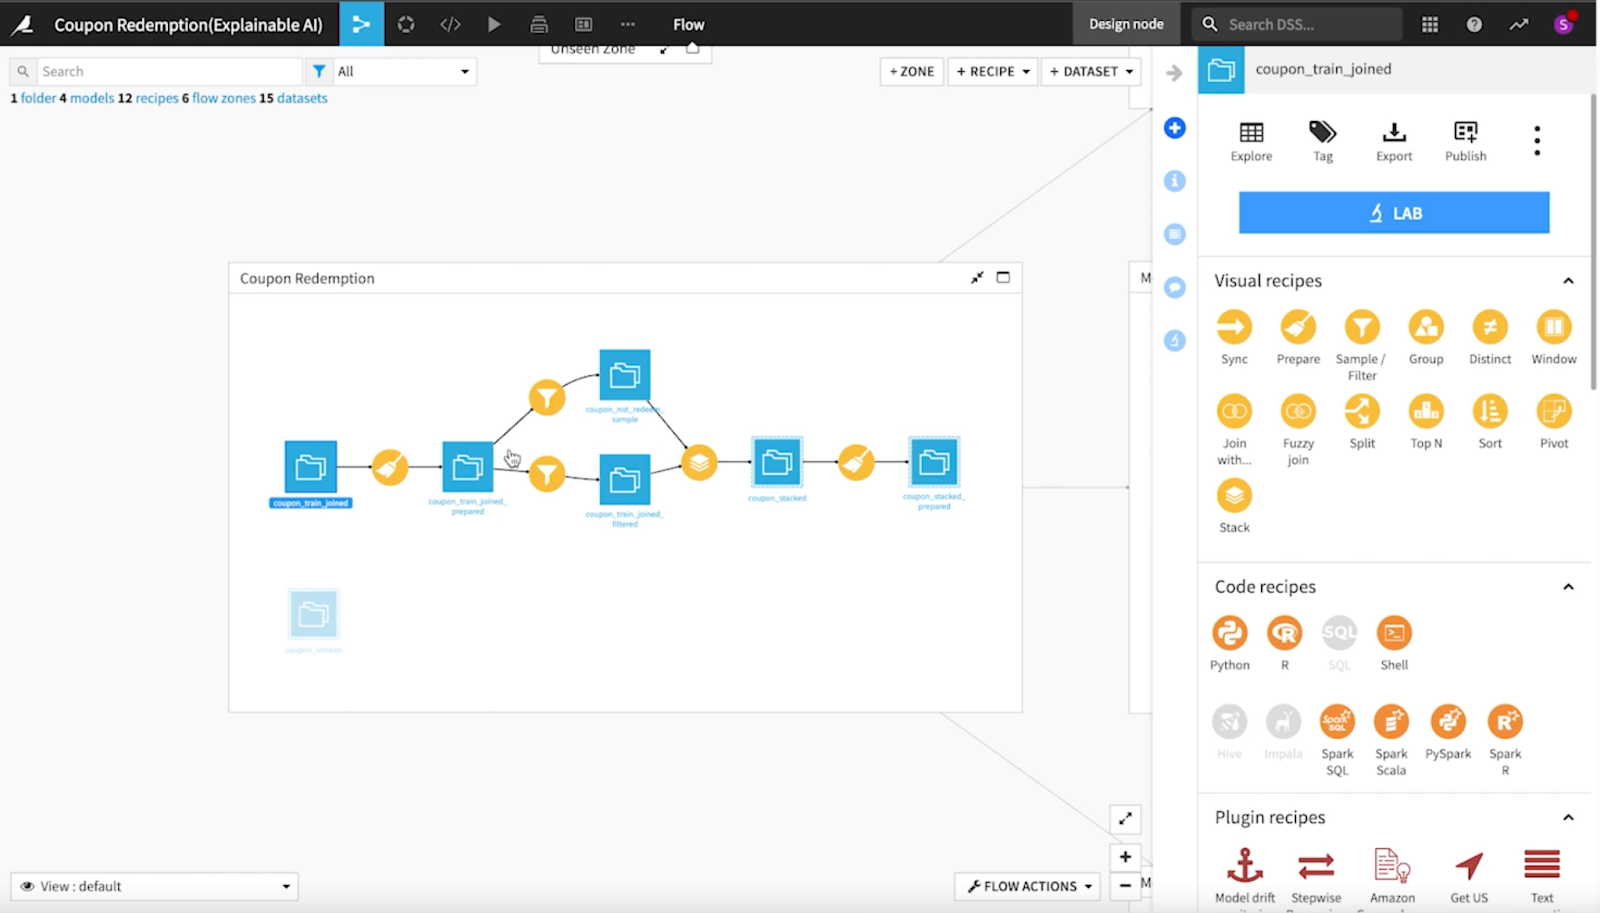
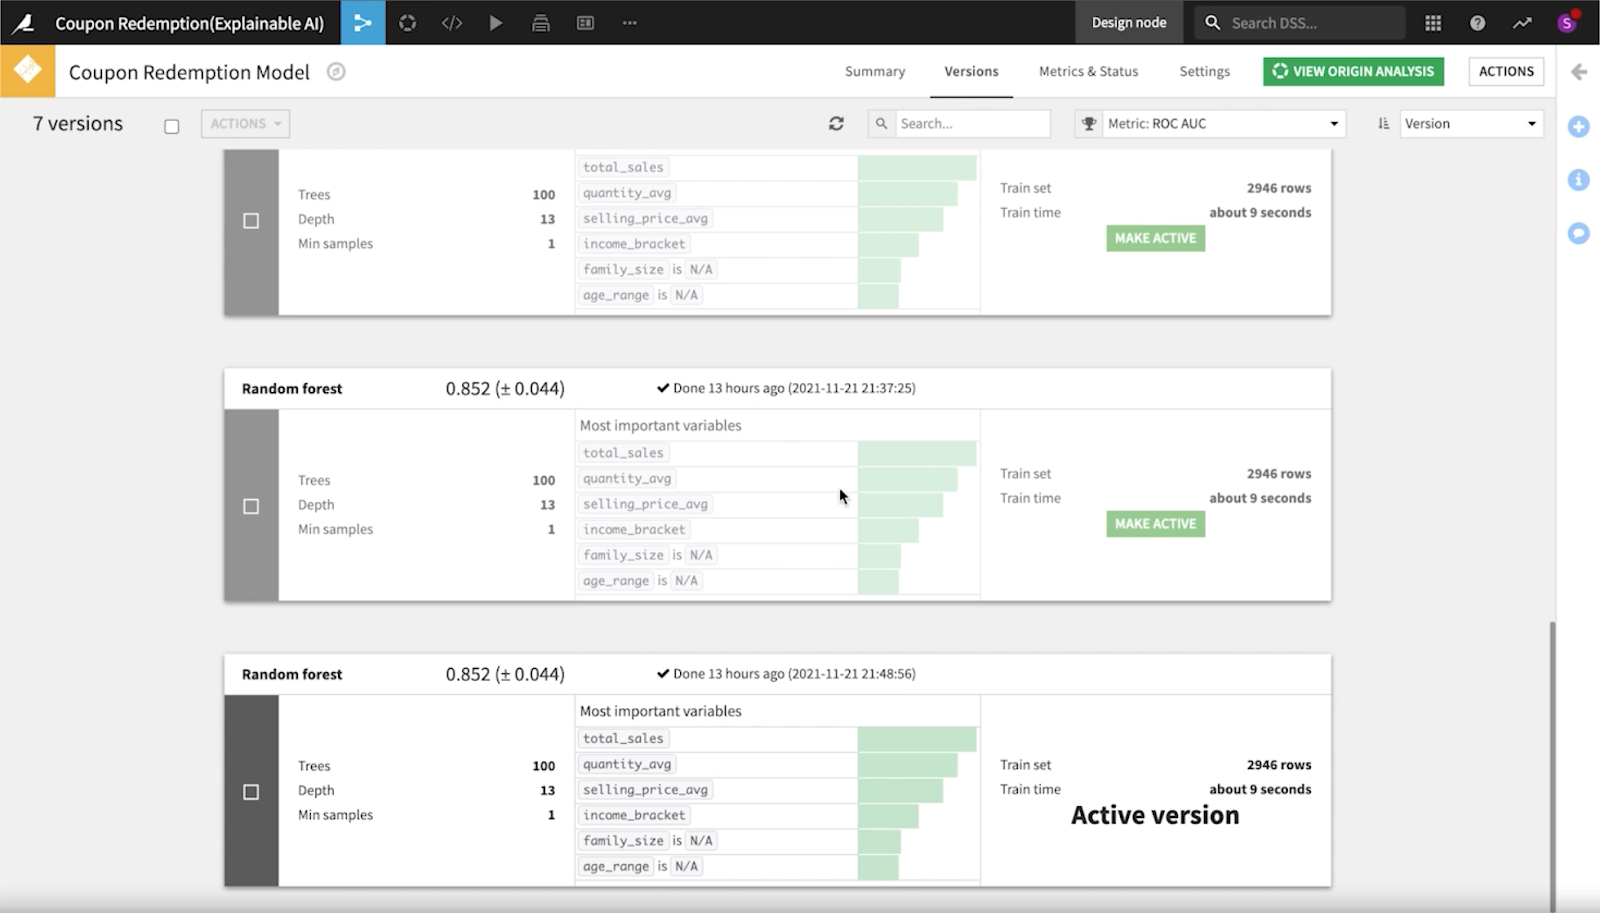
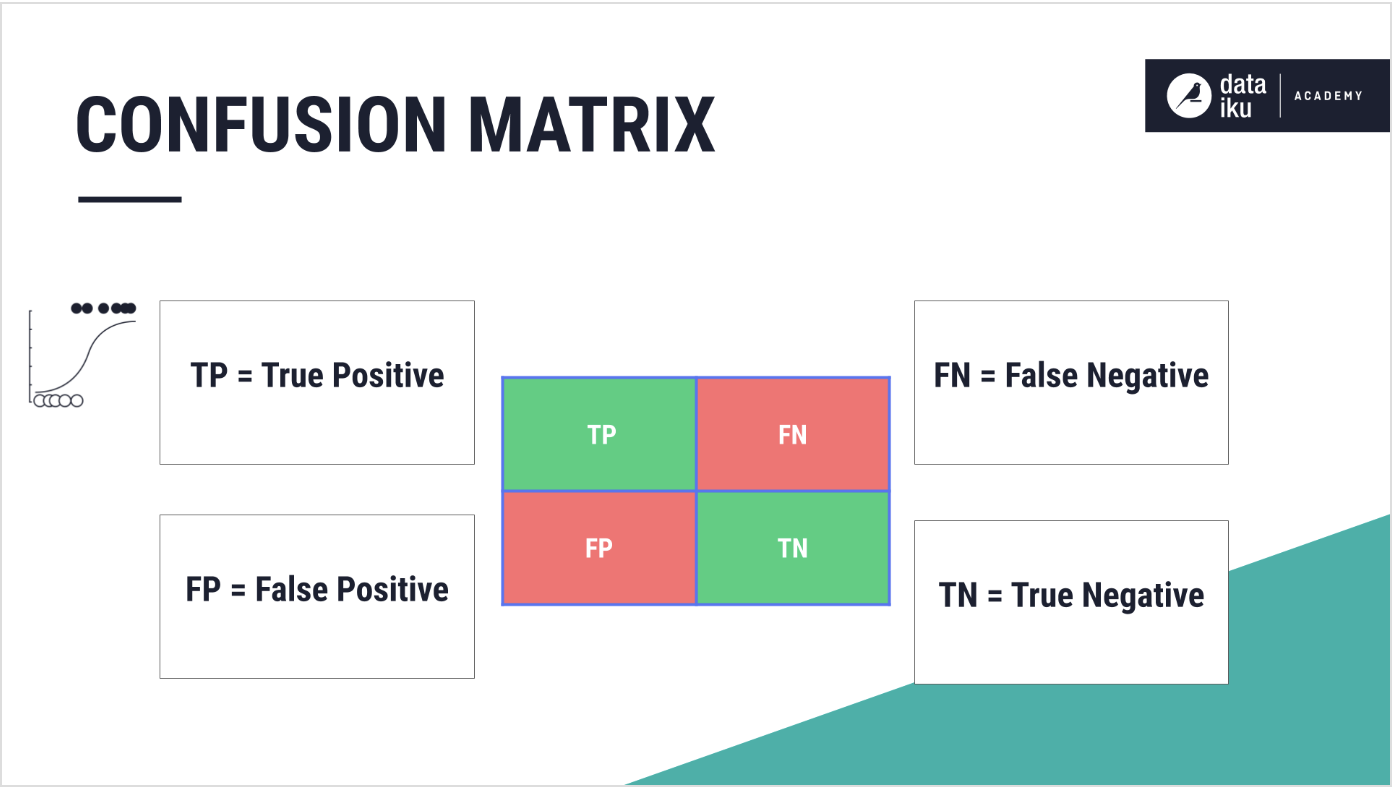
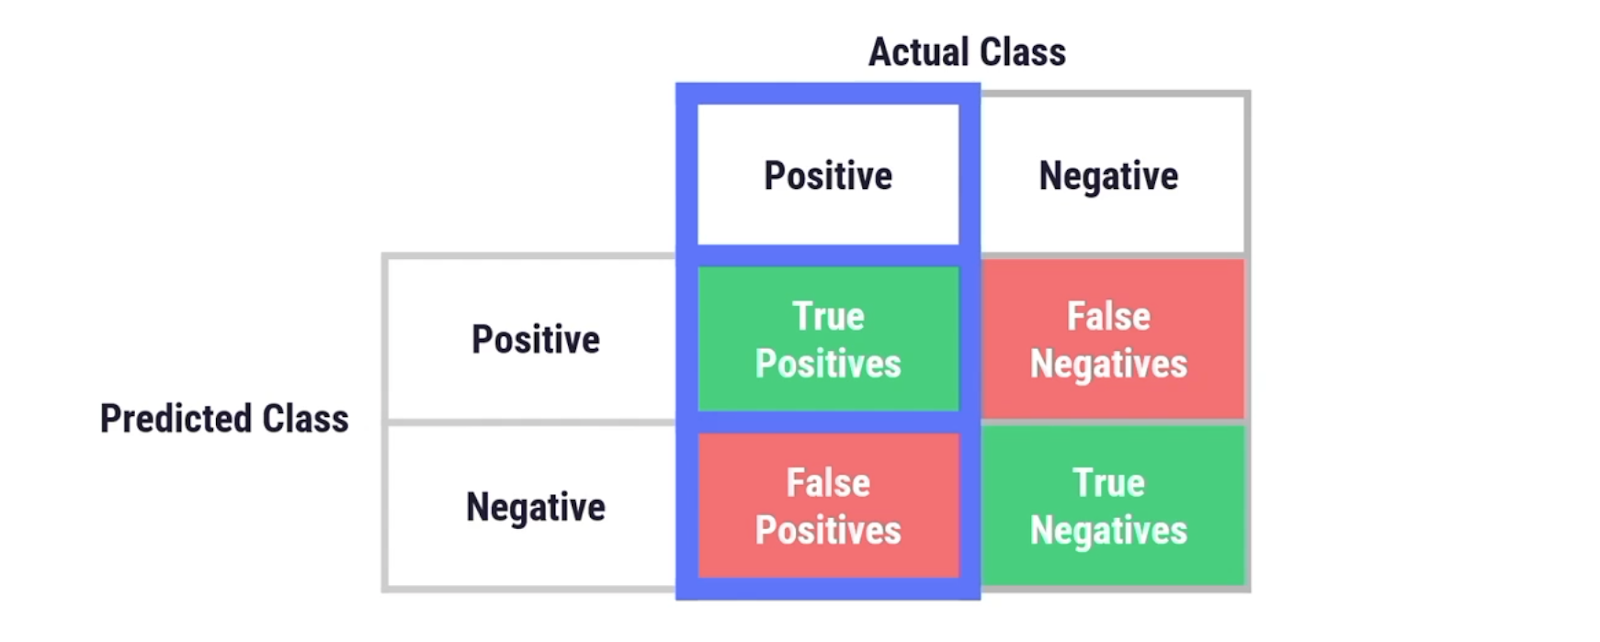
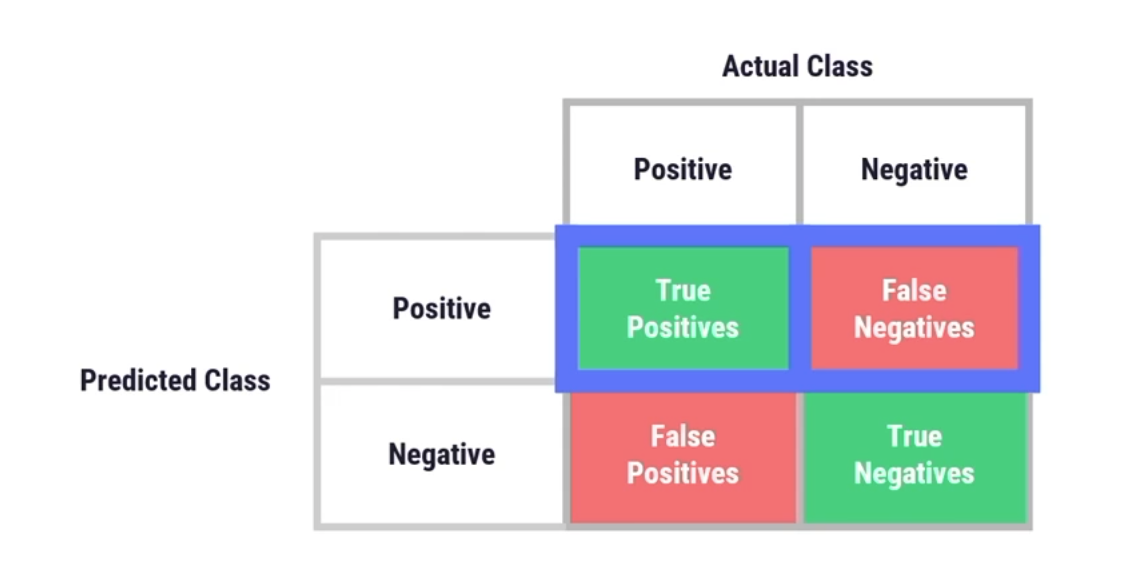
After looking at the initial data, the team did some simple cleaning and filtering and created a first model version, deciding to focus on recall (the number of true positives divided by the number of true positives plus the number of false negatives) as the main metric to identify bias. Splitting into the project flow zones allows us to organize the project into different parts.
Next came checking out the confusion matrix to focus on mitigating the number of false negatives and looking at the subpopulation analysis to see if the model is performing fairly across age groups.

Exploring Further Explanations
Remember, if we are seeing large differences across age groups this could indicate bias in our model, and here a drop in recall within the 70-plus age range was extremely evident.
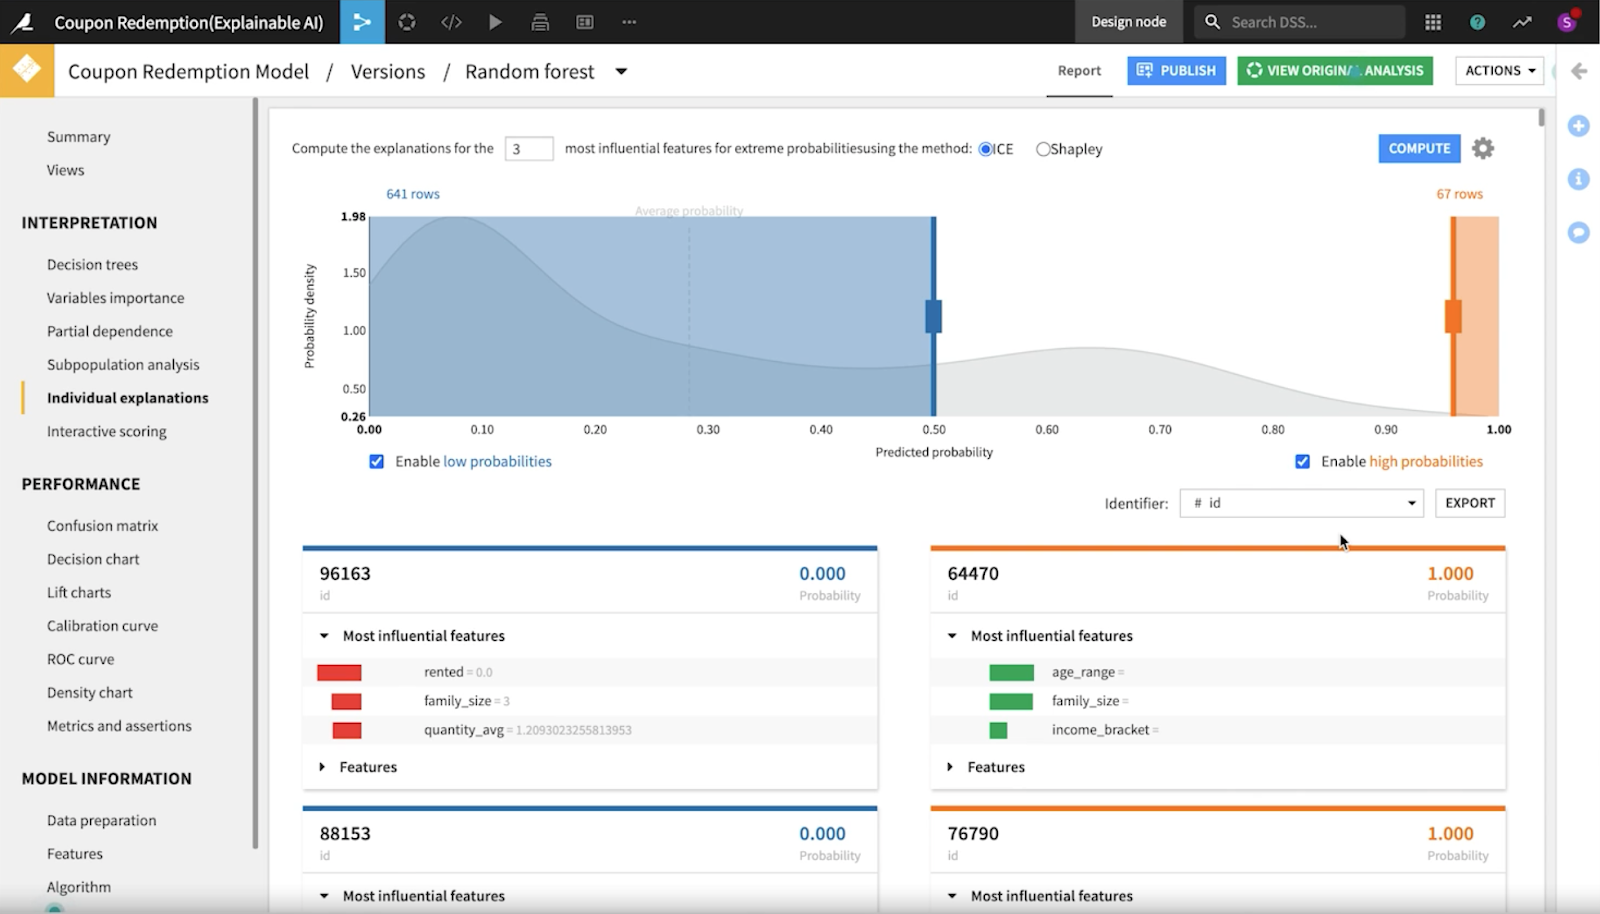
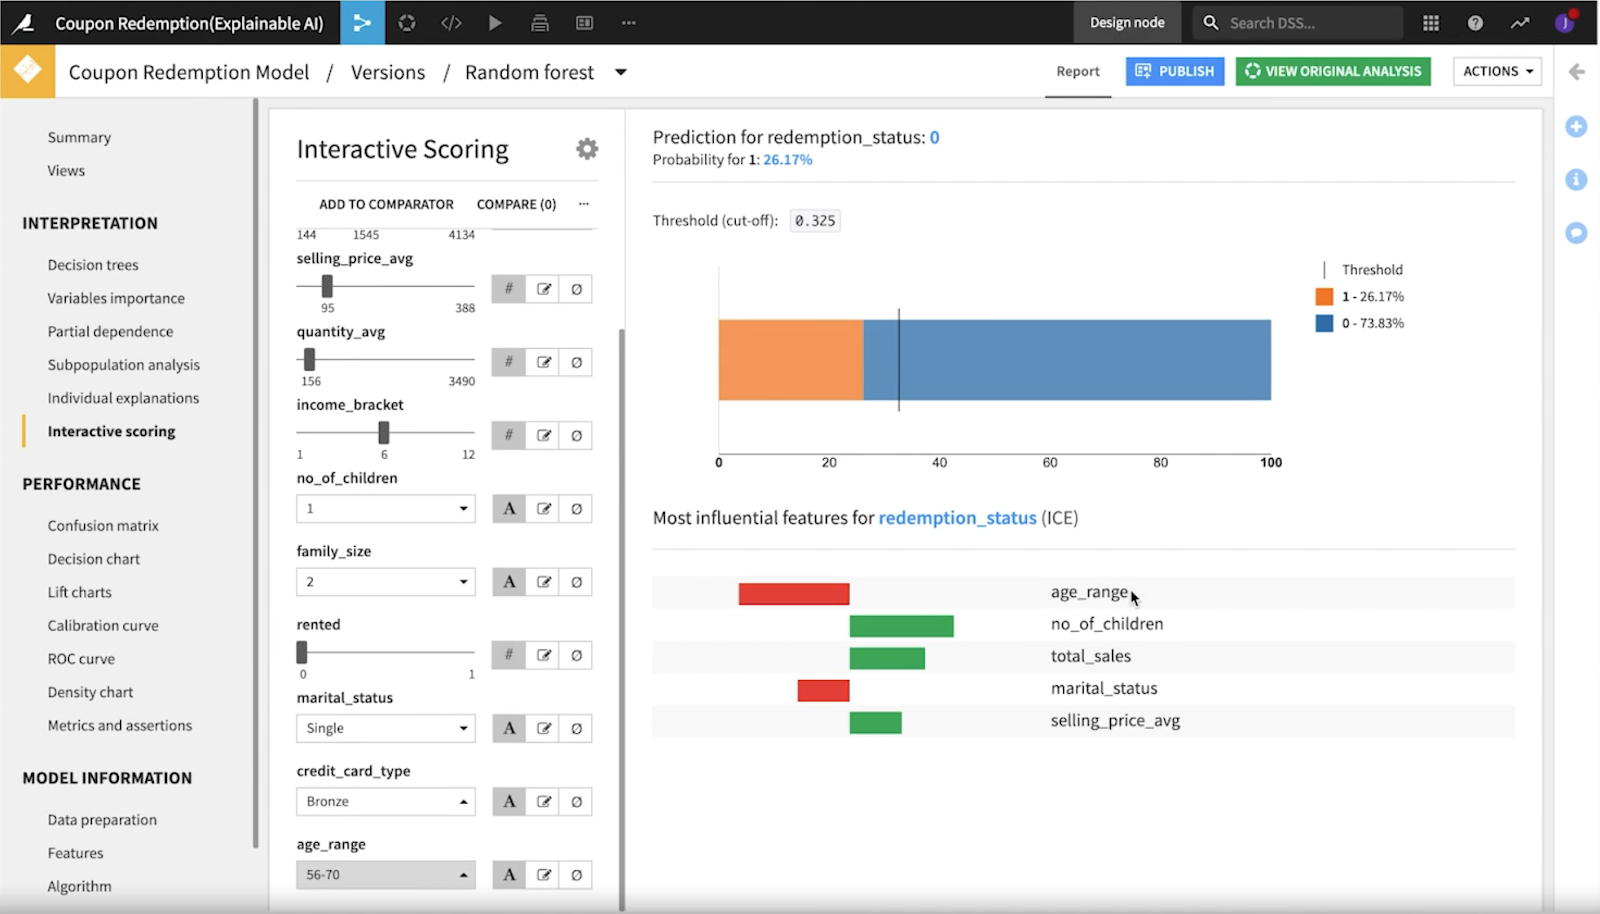
To further investigate, our data scientists looked into individual explanation records and computed explanations for the most influential features for extreme probabilities using the ICE method.
Evaluating Model Fairness
It’s necessary to evaluate the fairness of the model from two angles: mathematical and social.
- Mathematical fairness: Fair predictions are independent of sensitive attributes
- Socially-minded fairness: A fair model performs consistently across different groups such that outcomes are aligned with desired intentions.
To explore accordingly, the team used the Dataiku model fairness report to check out four different key metrics: demographic parity, equalized odds, equality of opportunity, and predictive rate parity.
Demographic Parity measures the rate of positive predictions (positive rate) between the sensitive and advantaged groups. The measure does not consider whether the positive predictions were true or false, only the rate of positive predictions for each group.
We would want to ensure the positive rate (the coupons distributed) is equal across each age group to make sure that one age group is not being prioritized.
Equalized Odds measure whether the true positive rate and false positive rates are equal among all groups. It assesses the classifier’s ability to correctly predict positive values and the likelihood of incorrectly predicting positive values. It compares the two rates, to see if they are equal across groups. In practice when applied to business objectives, this could help us determine whether marketing might be spending too much and sending coupons to people who are not redeeming those coupons

Equality of Opportunity measures the true positive rate (or recall) across all groups. It implies that the model correctly classifies customers who will redeem a coupon equally across the groups, giving all customers the equal opportunity of receiving a coupon (i.e., the most important metric for this project).

Now let's look at the side of socially minded fairness. Using the what-if analysis tool in Dataiku which allows you to toggle between different values of your model, it is easy to see how individual changes impact your overall model predictions. Right away, our team noticed the change in prediction when manipulating the age range for this example. Big bias alert!

Take Two: How Do We Improve?
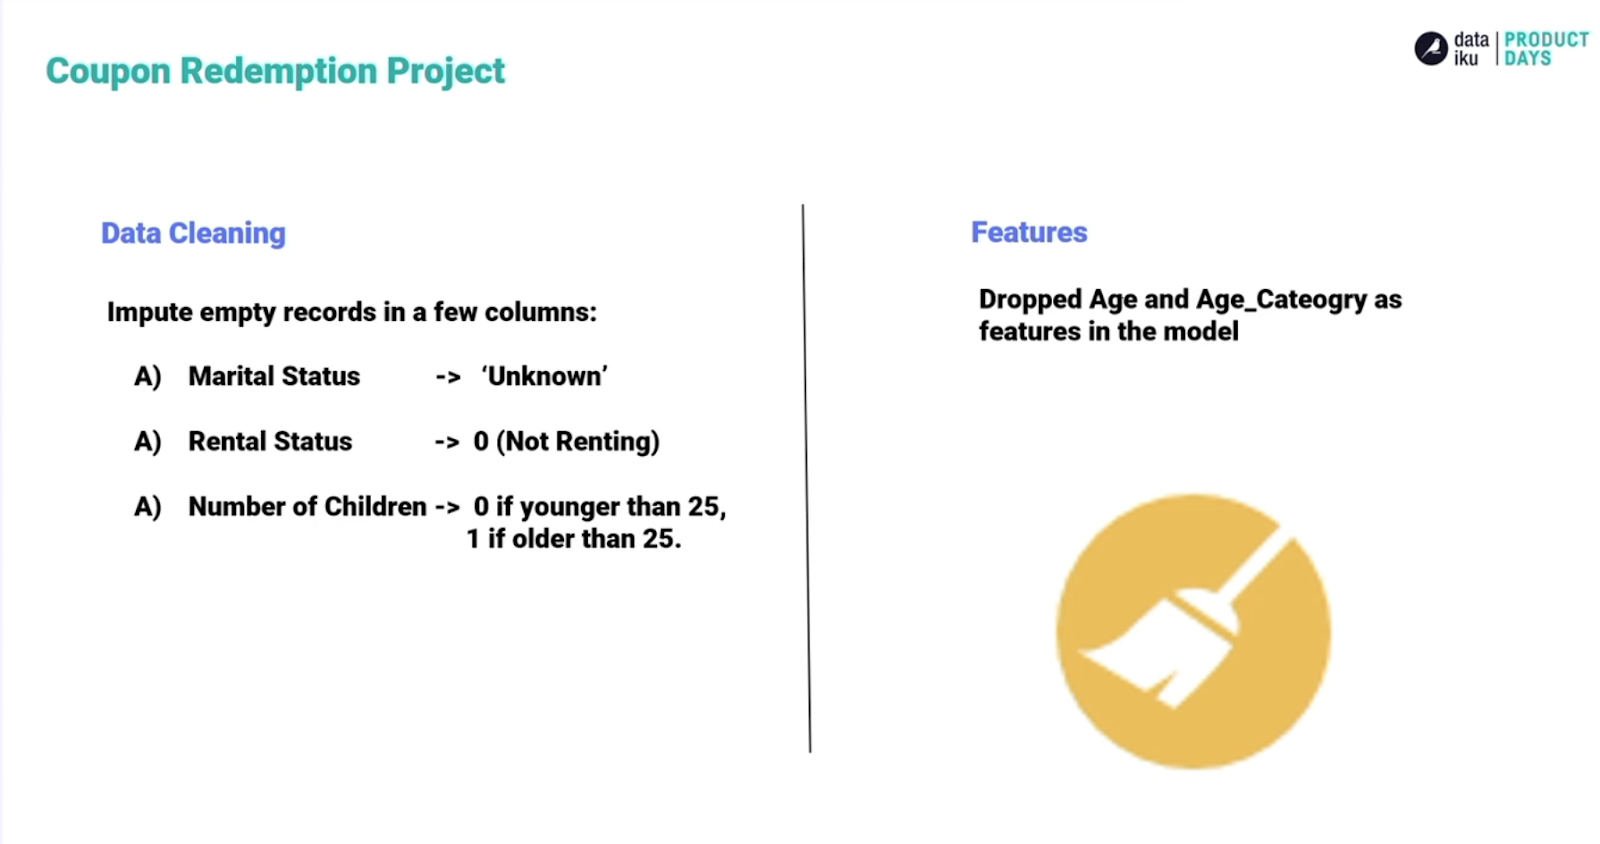
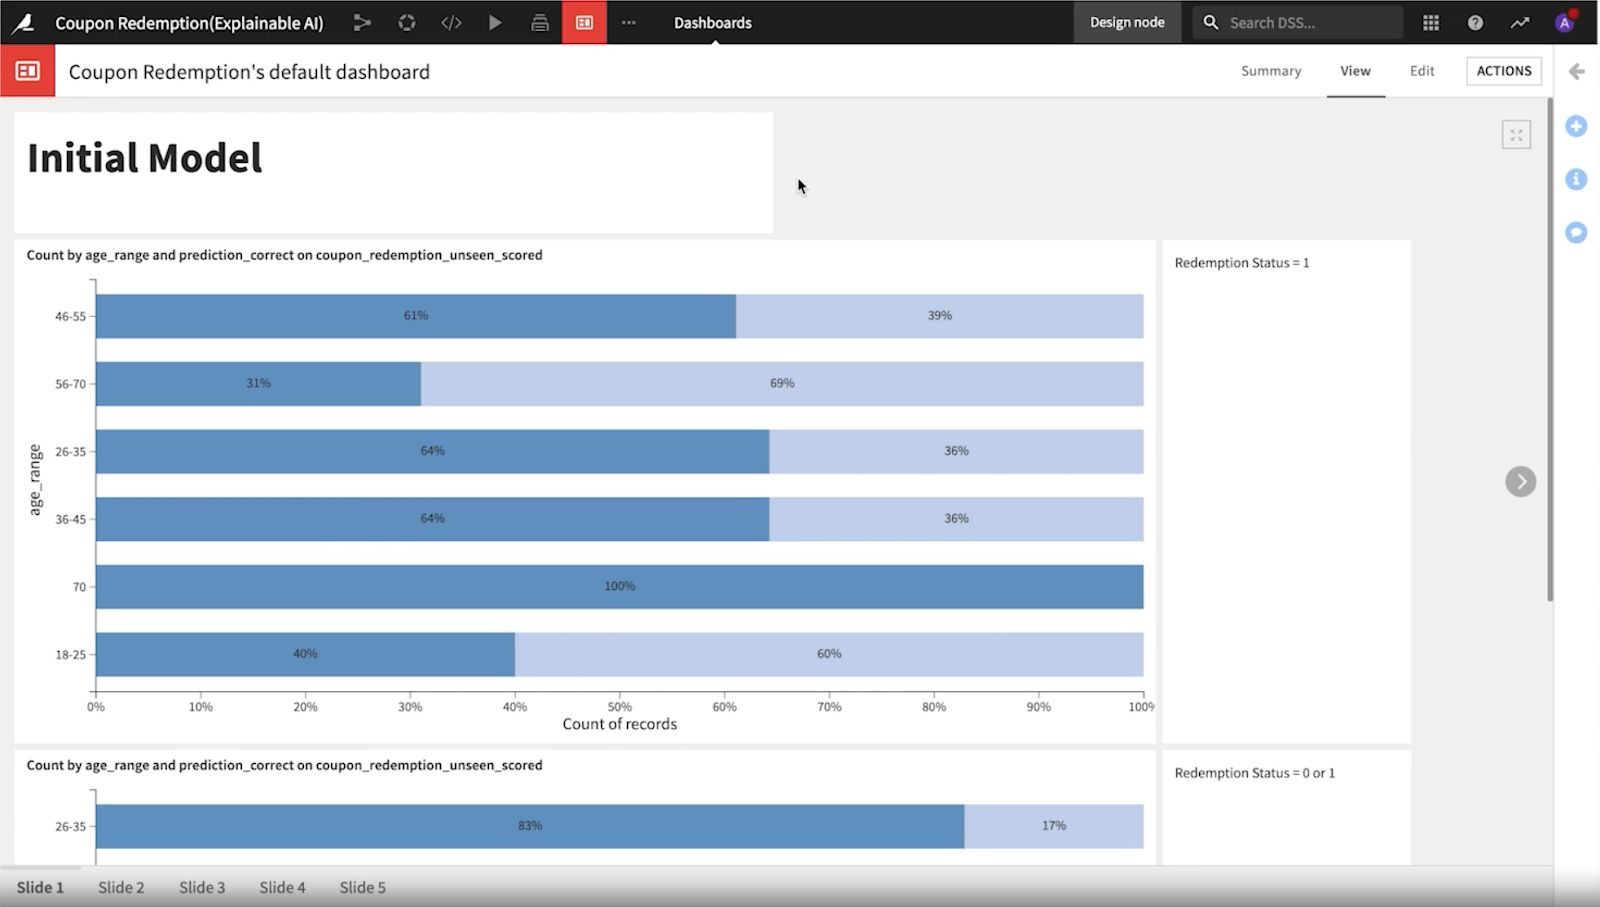
For a second try at creating a new, less biased model, the data scientists went back to the roots of the project with the intention of cleaning the dataset of bias-generating problem points. This included dropping age as a feature in the mode, but still including it as a column in our dataset for measurement purposes. Now it was time to consult the dashboard which is an accessible way to present data to all different kinds of user personas and end users.
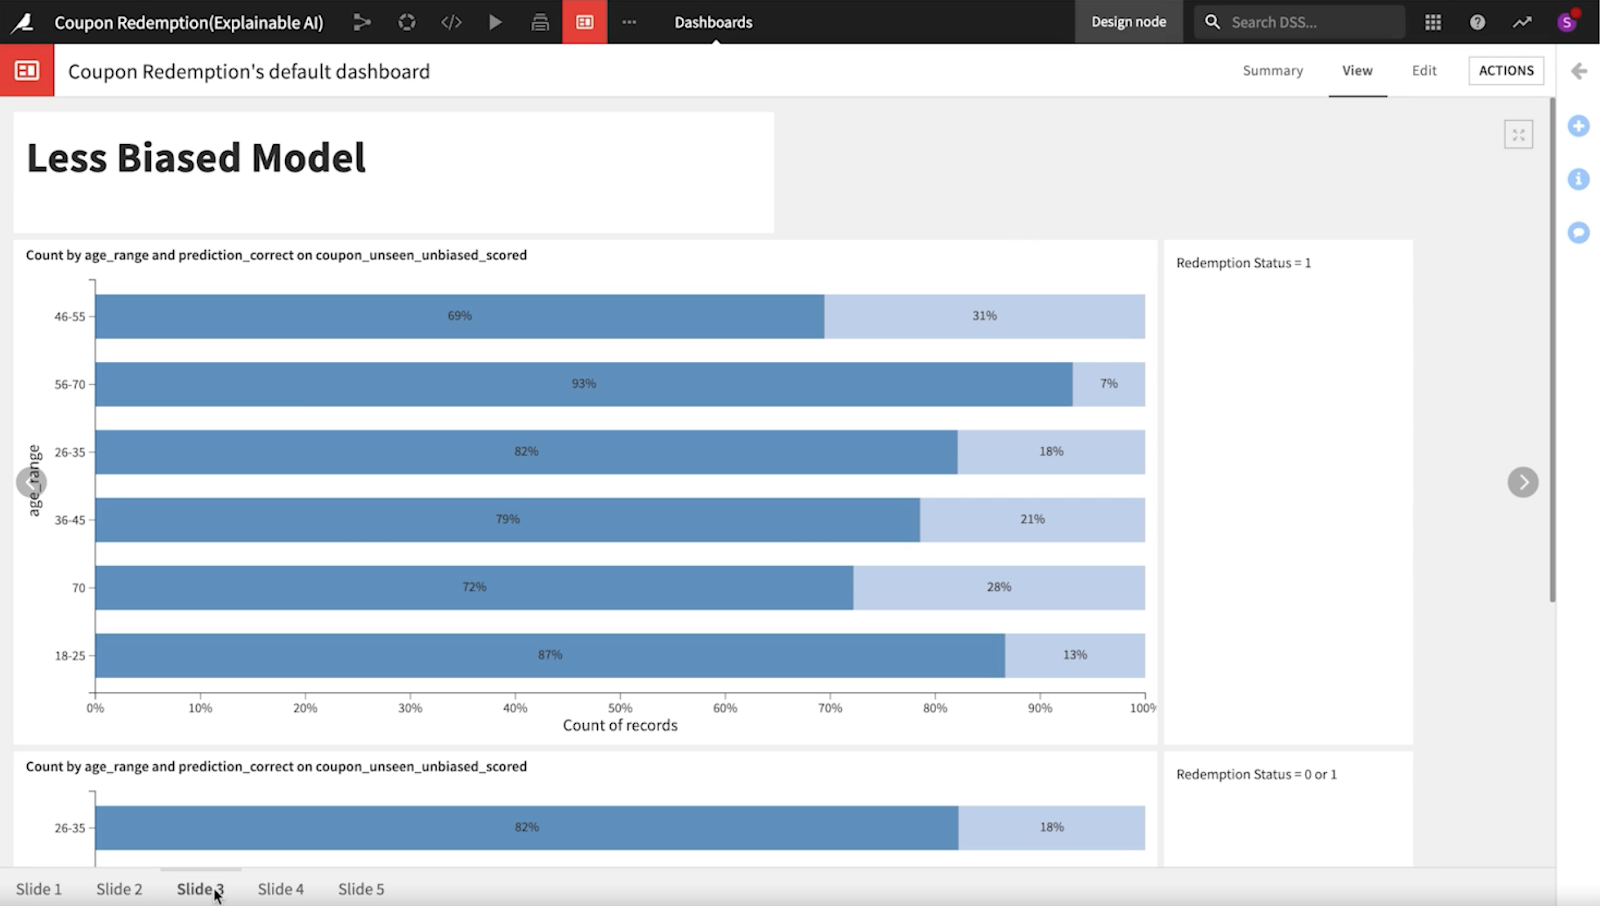
Quickly, the team took note of how notable the difference in performance is across age ranges in the initial model, the team then examined the new model.
They observed that the second model was more consistent across the age ranges and a little fairer. The false positive rates were closer together. However, some bias concerns still existed, so they decided to look into other features like credit card type, marital status, rental status, number of children, etc.

Some of these features in the second model could be directly related to age and as a result, driving the disparity that they were able to observe. To see if these features actually relate to one another or if they are instead independent, they performed a chi-square test using the statistics tab in Dataiku.
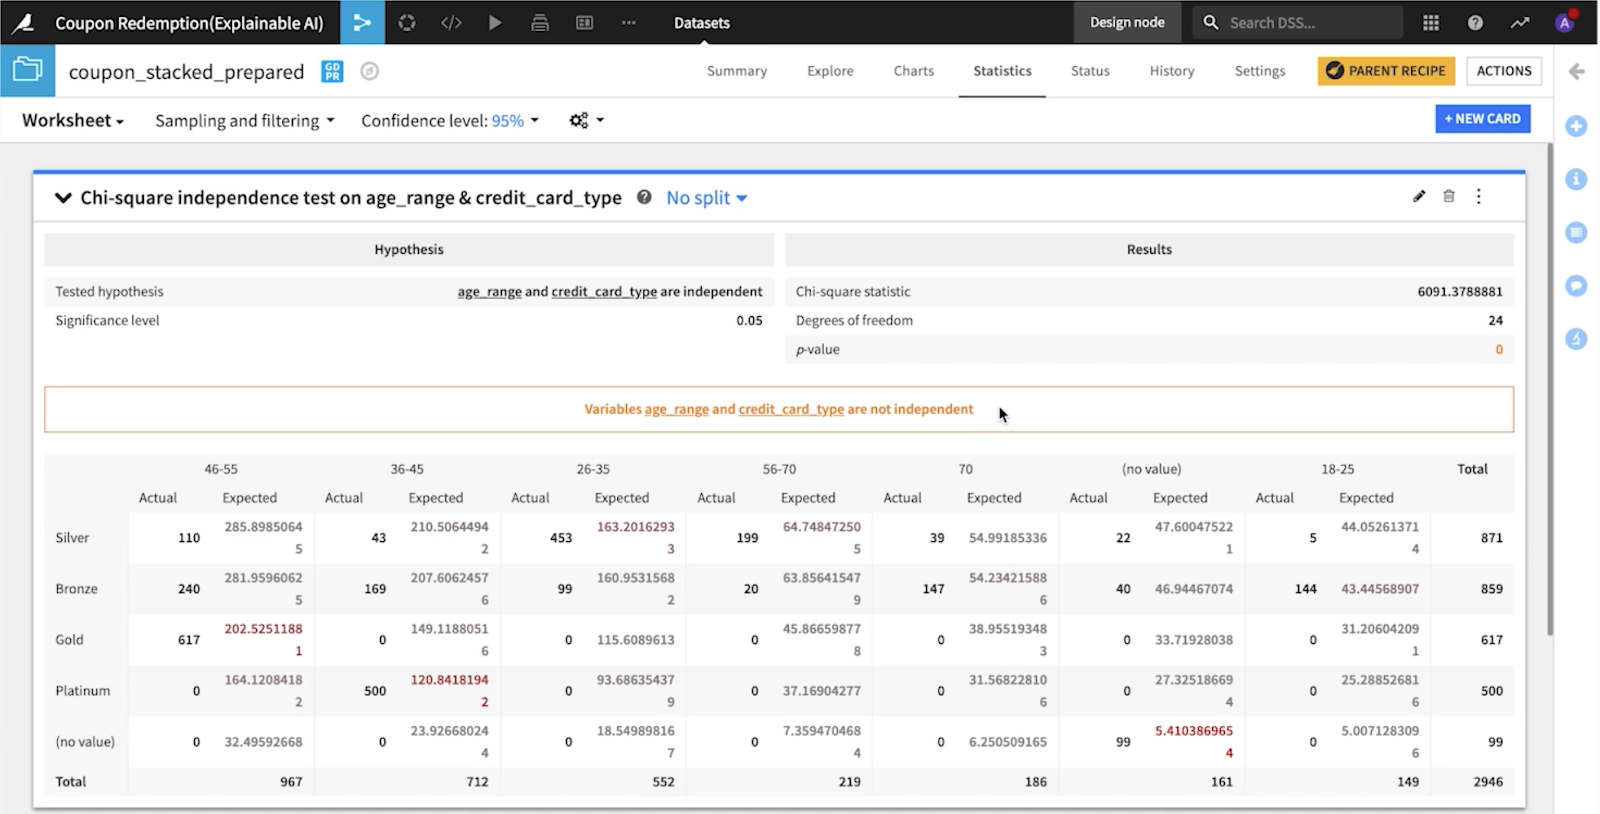
For this test, they looked at age range and credit card type and were able to detect a relation that made sense intuitively. As a result, the call was made to drop this feature as well. Then, after further tests, for the same reasons, family size and income size were dropped for the third model version.
Third Time's the Charm: The Final and Less Biased Model
In the third iteration of the model for this project, our data scientists saw that the false positives get smaller and smaller for each age range. The model is not perfect but it is less biased thanks to the tools in Dataiku that guided the team to identify which features they should ditch.
It Doesn't Stop There
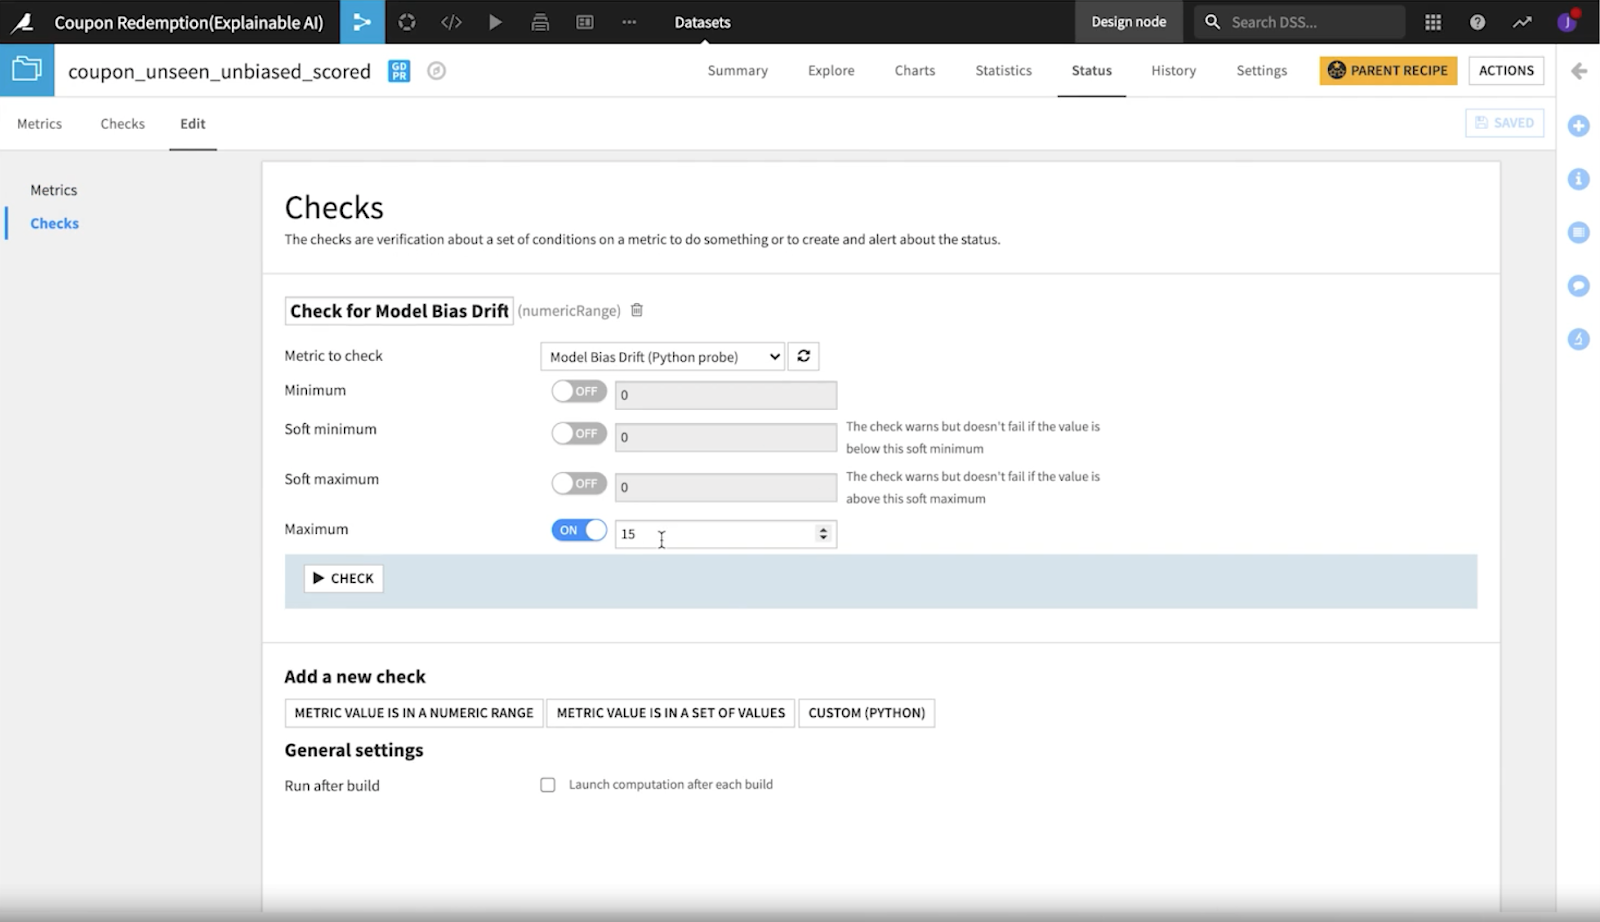
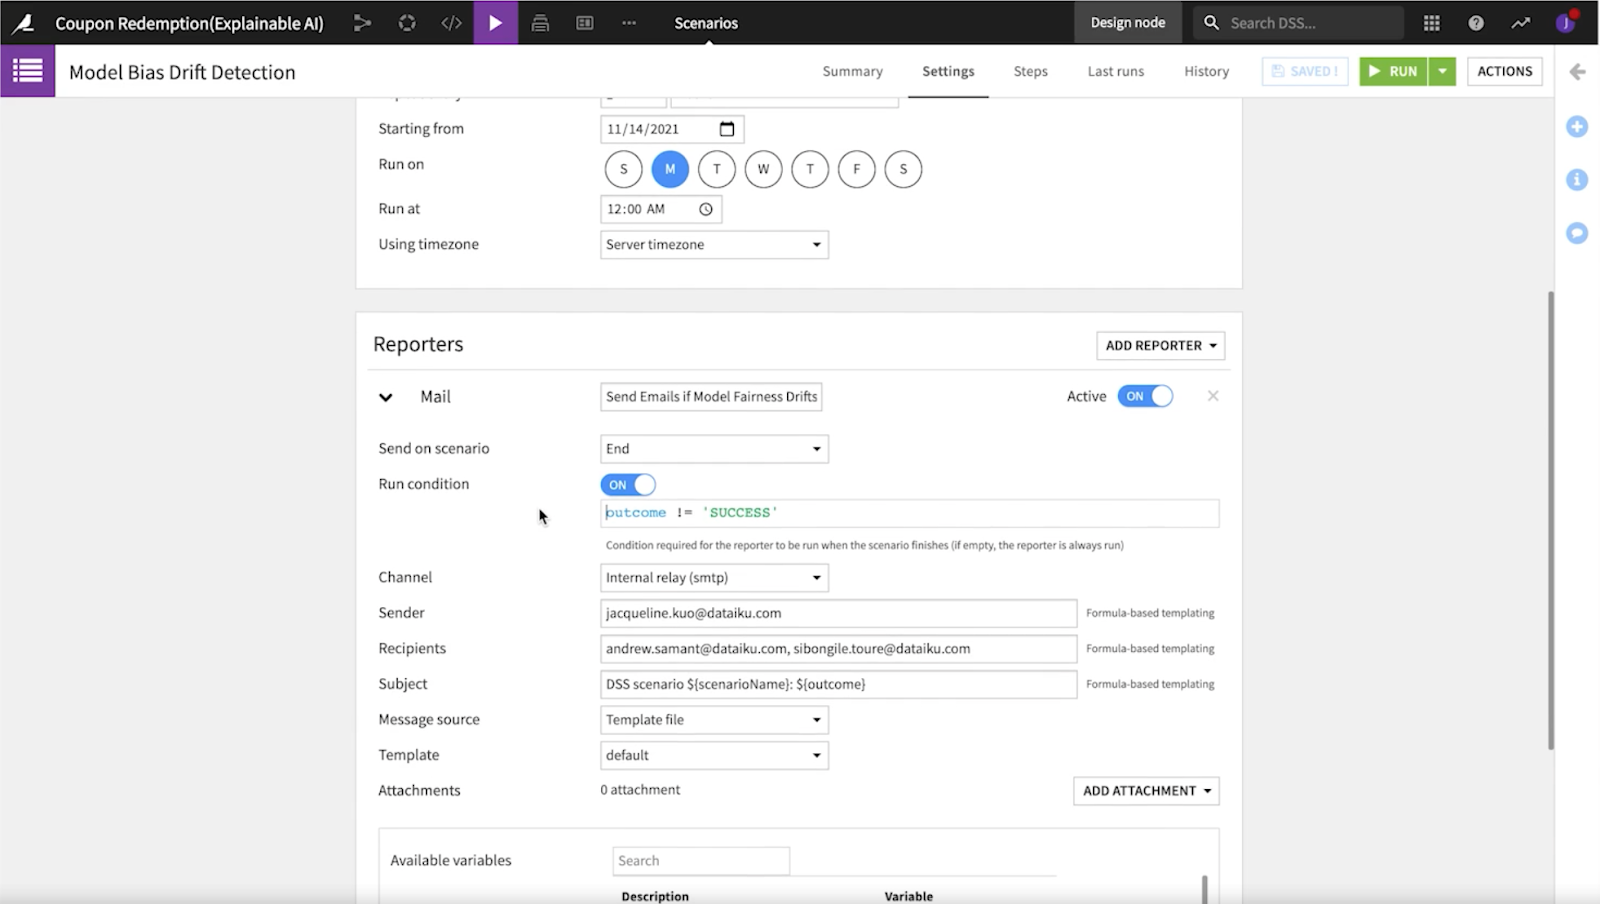
Not only does Dataiku help you rework models to create improved iterations like we just saw above, but it also enables you to track the performance of the models that you have created over time with metrics, checks, and scenarios.
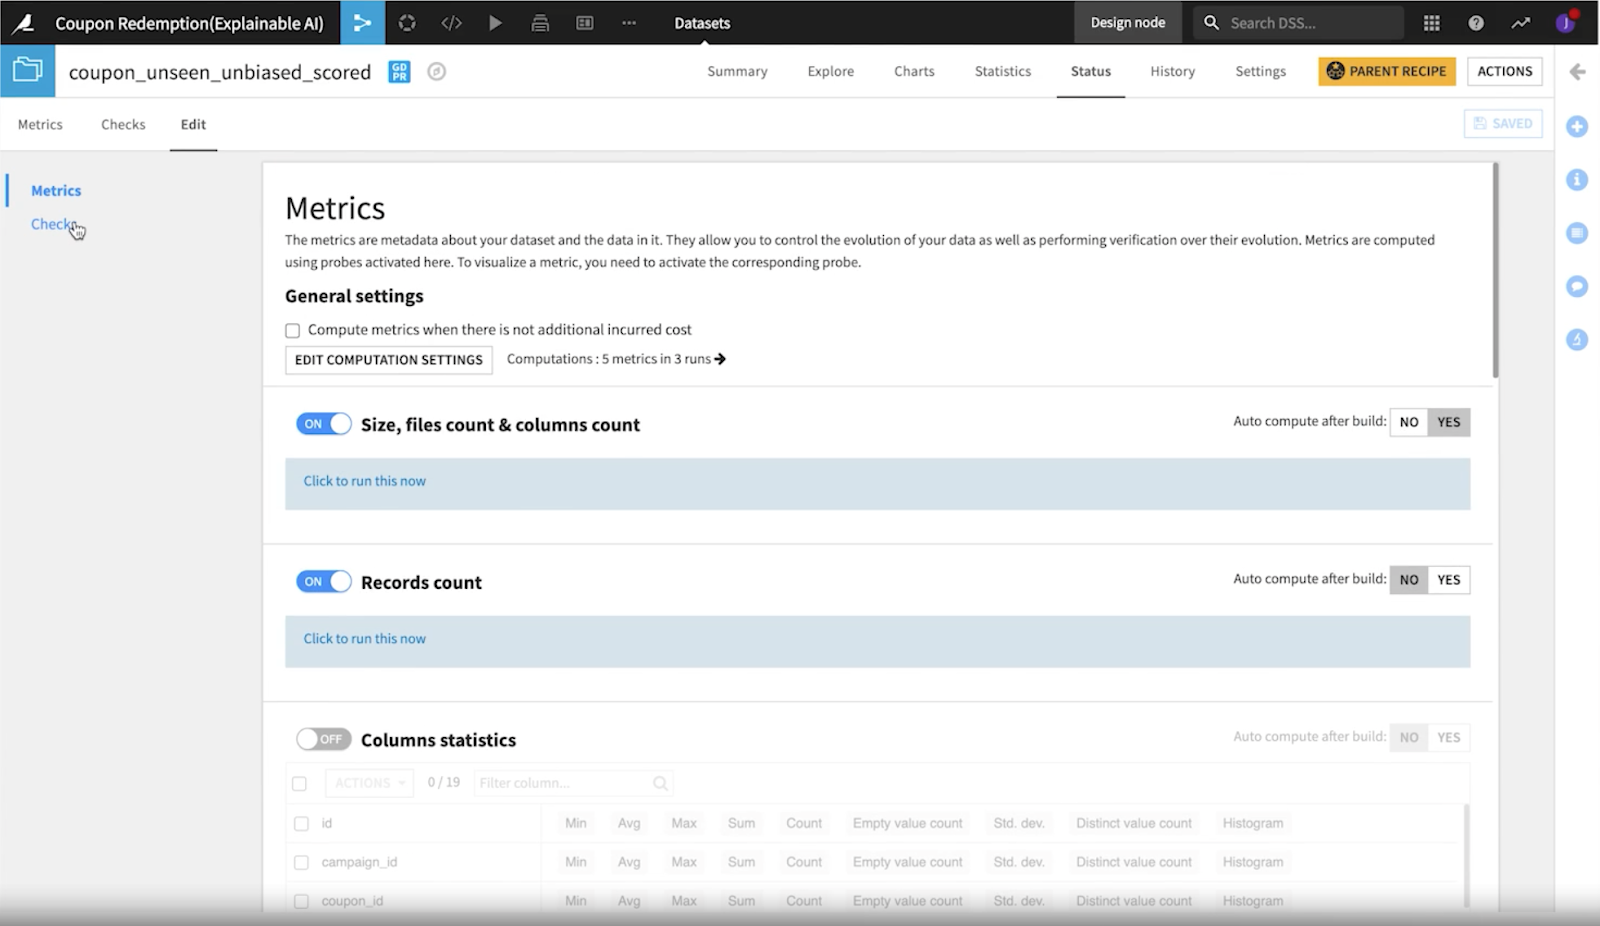
Metrics and checks go hand in hand, equipping you with the ability to inspect your datasets and follow the evolution of your models over time. Scenarios allows you to schedule jobs that correlate to the metrics and checks of your model. You are able to set up alerts that uncover bias automatically through detection tools that are seamlessly integrated into the flow.
For the Coupon Redemption Project, our data scientists created a custom python metric and a check to show when their specified value exceeded a certain threshold.
Managing AI at Scale and Key Takeaways
Why does it all matter? Keeping bias at bay is incredibly important for the more obvious reasons (staying out of the bad AI headlines) but also on a more nuanced basis for reasons such as the long-term health of AI applications in the rapidly evolving space of tech.
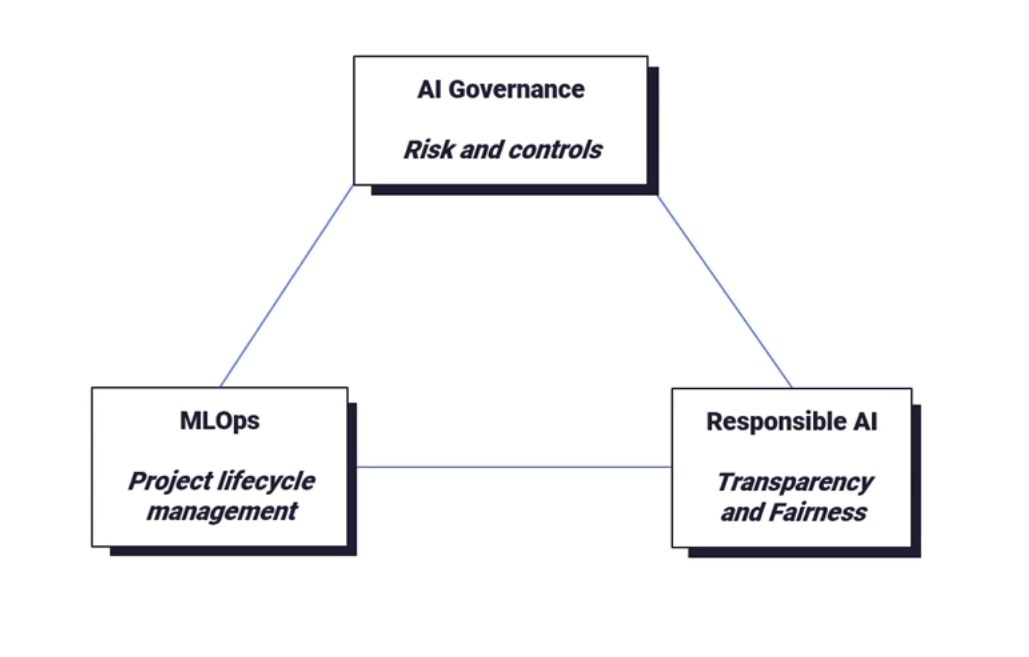
Understanding the larger risks of AI systems should be top of mind for AI leaders in organizations everywhere, in all industries, and the three interconnected concepts that organizations should hone in on are:
- AI Governance (risk and controls)
- MLOps (project lifecycle management)
- Responsible AI (transparency and fairness)
That said, it can’t end with the data leaders. Data scientists should play their part in this three-part web of scaling AI by incorporating transparent reporting and best model fairness practices into their model building process as demonstrated in the example above. Data science teams should also work hand in hand with AI Governance teams to align project goals throughout the entire AI pipeline.
Data scientists are not just optional players in organization-wide plans to scale AI. Their contribution to decreasing bias for fairer models is a core aspect of Responsible AI, MLOps, and AI Governance relatively. However, to play their part in recognizing bias and building fair models, data science teams need the proper tools at their disposal (or at least it helps greatly) which is why the assistance for bias identification and understanding provided by Dataiku is a huge game changer!