AWS | Cloud
AWS Lambda with Golang 
Dennis Vriend 10 Nov, 2018


In this blog Simon Karman and Matt Watson will dive into monitoring an Amazon MSK cluster. Amazon MSK is the AWS managed offering for Apache Kafka. To identify issues and to be able act quickly on those, the health of these clusters is important to monitor.
We want to identify when the MSK cluster (or in other words: one of the underlying brokers) is struggling due to load. Because this can result in producers being throttled which means messages or events can be lost. So when this occurs, it is important to resolve the struggling cluster as quickly as possible. Therefore, we need to have a way to check that all brokers are running optimally so that they can handle the request load of producers and consumers.
In this article we’re going to identify the important metric(s) that we can use to show that brokers are struggling and then show the available options to resolve the issue.
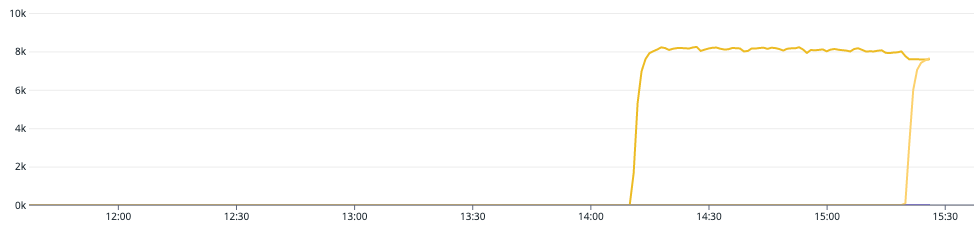
To identify which metric(s) could be used when a cluster is overloaded, we did a load test. We started out load testing (in the graph at 14:10) to see which metrics would significantly change and noticed that the aws.kafka.request_handler_avg_idle_percent metric changed significantly as the load increased (shown in the graph below).
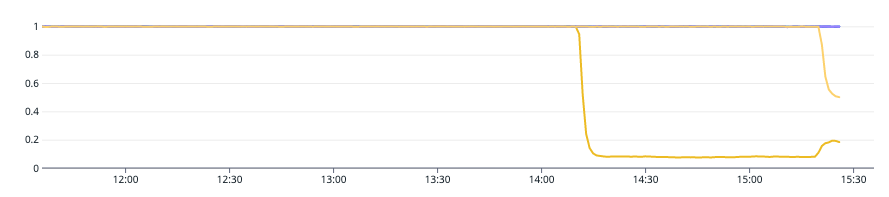
The Kafka topic we used for the load test only used a single partition, this means that a single broker would receive all the load and this made it simpler to make performance comparisons with other brokers. During the load test, we saw that the single broker became saturated during the load test using the aws.kafka.request_handler_avg_idle_percent metric, thus it was a decent indicator for an unhealthy Kafka broker and a generally slow Kafka cluster.
If the request handler idle percent is constantly below 0.2 (20%), your cluster is likely overloaded and requires a capacity increase (source from Network and Request Handler Capacity). This is why we created a monitor in our system, that tracks that the value of this metric, with an alerting threshold of 0.2 (20%).
Once you identified that the cluster or broker is struggling, you need ways in which to resolve the situation.
The easiest approach is to update the broker types so that they have more memory and CPU or increase the number of brokers in the cluster, however in general, this is only useful when the majority of brokers are overloaded.
If a subset of brokers are struggling, it could indicate that a topic is not correctly partitioned. In that case, increasing the number of partitions could help to spread the load across more Kafka brokers, relieving the stress on the struggling broker(s).
Since the Kafka topic we used for our load test had a single partition, it was overloading one broker. By upping the partitions to 2, we spread the load more evenly accross the different brokers. Not only did this reduce the pressure on the request handler of the broker (in the graph at 15:15), but, even the Kafka cluster throughput increased, as multiple brokers could now concurrently handle the work of this topic.
We have shown that the aws.kafka.request_handler_avg_idle_percent metric indicates whether a broker is struggling. Therefore, by creating monitors, we can track this metric from each broker and see whether its value drops below 0.2 (20%).
If it drops below this value, we can either (1) update the brokers by adding more memory and CPU or increase the number of brokers in the cluster, or (2) verify that the topic has been partitioned correctly across all brokers.

