
Jan Vermeir 12 Sep, 2017


This blog post is inspired by a great talk from my colleague Ben Fradet about a client project in which the functional programming team at Xebia recently participated. The project involved decommissioning an extensive monolith Scala application into smaller microservices. This summary aims to go through some of the lessons learned on this journey, which has allowed the client to scale and be more resilient than ever. We’ll put the focus on Kubernetes and the Java Virtual Machine (JVM).
Before starting, let’s provide some context and some of the constraints that are relevant here. First, our team actively contributed to all the DevOps lifecycle stages, from the development to the deployment across the different environments, including production. Second, about the monolith restrictions, we had to be on the monolith’s scale regarding the requests per second, which were massive at peak. Moreover, we were constrained by the desire to introduce the least overhead possible, trying to preserve the average latency times. Additionally, as preliminary work, we had to improve the observability and alerting strategies on the monolith to know what the decommissioning plan should be.
The team used the Strangler Fig pattern to decommission the legacy system gradually in new Scala and modern microservices running in Kubernetes.
Every microservice apart from the business domain code and its proper CI/CD pipeline includes the Helm chart (YAML files) with the configuration and needed resources enabling the service to run on the Kubernetes cluster. From now on, we’ll be looking at the resources section, specifically those related to CPU and memory.
Example of service helm chart:
# {prod,stage}_values.yaml
...
resources:
  requests:
    cpu: "1"
    memory: "1500Mi"
  limits:
    memory: "1500Mi"
  serviceConfig:
    ENV_VAR: "value"
...
In the resources section, we specify the memory and CPU requests and limits for the container (in the example, 1500 MB of memory and 1 CPU, respectively):
requests: the minimum amount of resources the container needs to run.limits: maximum amount of resources the container can use.In other words, the example above means that the container will request and be limited to 1500 MB of memory and 1 CPU.
From the software engineering’s point of view, specifying the resources requirements in a Kubernetes deployment has several implications that we need to be aware of:
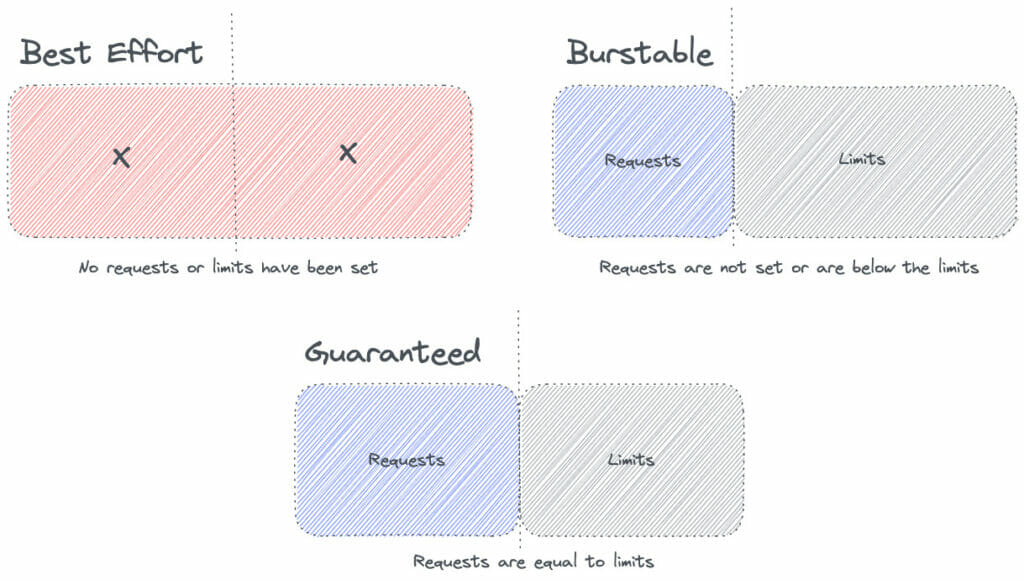
requests parameters are too high, the pods might consume more resources than required, incurring higher costs.In summary, these implications drive what Kubernetes calls Quality of Service (a.k.a QoS). Essentially, the QoS class is used by the Kubernetes scheduler to make decisions about scheduling pods onto nodes. There are three classes: BestEffort, Burstable, and Guaranteed.
A pod is assigned a BestEffort class if neither requests nor limits are set in the pod manifest.
apiVersion: v1
kind: Pod
spec:
  containers:
    - name: foo
      resources:
        limits:
        requests:
In this case, these pods are given the lowest priority for access to the cluster’s resources and may be terminated if other pods require the resources.
The Burstable QoS class is assigned to a pod if requests parameters are set, but the limits section is not defined. Example:
apiVersion: v1
kind: Pod
spec:
  containers:
    - name: foo
      resources:
        requests:
          memory: 700M
          cpu: 500m
These pods can temporarily use more resources than they requested if the resources are available, but the cluster will not guarantee these additional resources. These pods would be next in line to be killed if there are no BestEffort pods and exceed requests.
If both requests and limits are set, and they are equal on the memory and CPU values, then a pod can be placed in the Guaranteed QoS class.
apiVersion: v1
kind: Pod
spec:
  containers:
    - name: foo
      resources:
        limits:
          memory: 1G
          cpu: 500m
        requests:
          memory: 1G
          cpu: 500m
Therefore, the cluster will ensure that these pods have access to the requested resources at all times.
Visually, the different QoS classes look something like this:
In Kubernetes, something to notice is that a pod can have multiple containers, and each can have its CPU and memory resource requests and limits. In this case, the pod’s QoS class will be determined based on the most restrictive resource request or limit of any container. Here’s a table that illustrates the possible combinations of CPU and memory resource requests and limits for a pod with multiple containers:
| CPU Requests | CPU Limits | Memory Requests | Memory Limits | QoS Class |
|---|---|---|---|---|
| Not Specified | Not Specified | Not Specified | Not Specified | Best Effort |
| Specified | Not Specified | Specified | Not Specified | Burstable |
| Specified | Specified | Specified | Not Specified | Burstable |
| Specified | Specified | Specified | Specified | Guaranteed |
Note that, for a container to be Guaranteed, its CPU and memory requests and limits must be specified. The pod will be considered Burstable if only one of the two is specified, and regarded as Best Effort if neither is specified.
Thus, selecting resources in a Kubernetes deployment, it’s crucial to consider each resource’s nature and the desired QoS to ensure that the application has enough resources to run effectively and efficiently.
However, we must consider that memory and CPU are treated differently in the Kubernetes context. For example, memory is regarded as an incompressible resource because it is a finite resource that cannot be compressed or shared between multiple processes. On the other hand, the CPU is considered a compressible resource because it can be shared between various processes, allowing multiple processes to run simultaneously. This fact is crucial to understanding the following sections.
The same concepts of resource requests and limits apply to the JVM running in a container in a Kubernetes cluster. The JVM will consume memory and CPU resources from the container, and these resources can be specified in the same way as any other application running in a container.
Having said that, monitoring the memory usage (remember, it’s an incompressible resource) of the JVM in the container is essential to ensure that it does not exceed the limits specified in the deployment. If the JVM runs out of memory, it may result in the application crashing or other unexpected behavior. To avoid this, it’s essential to set appropriate requests and limits for memory, as well as to monitor the JVM’s memory usage and adjust the resource limits as needed.
java.lang.OutOfMemoryError‘s causes the application to crash if we don’t set an appropriate memory limit for the JVM. As we pointed out above, the memory limit should be set high enough to accommodate the regular operation of the JVM, including the heap size, metaspace, and any other memory usage. We’ll review all these aspects later. But for now, let’s consider the following deployment configuration as an example:
apiVersion: v1
kind: Pod
spec:
containers:
- name: foo
  resources:
    limits:
      memory: "125M"
    requests:
      memory: "100M"
      cpu: "500m"
Also, consider:
foo application.Therefore, the following graph would represent the memory usage in this configuration:
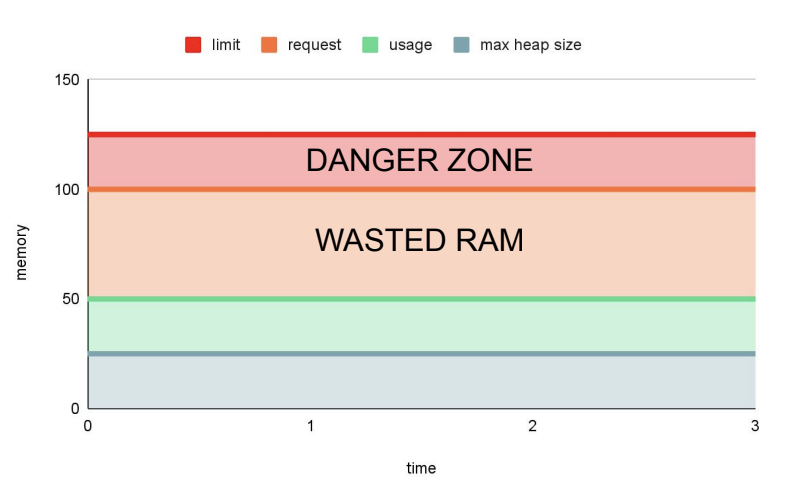
As you can see, there is memory wasting. How could it be improved?
To start, we could modify the default maximum heap size of the JVM by using the -Xmx flag.
apiVersion: v1
kind: Pod
spec:
containers:
- name: foo
  resources:
    limits:
      memory: "125M"
    requests:
      memory: "100M"
      cpu: "500m"
  env:
    name: "JAVA_OPTS"
    value: "-Xmx100M"
With -Xmx100M, we are setting the maximum heap size to 100 MB. Therefore, the JVM will allocate up to 100 MB of memory for the heap. If the heap grows beyond this size, the JVM may trigger a garbage collection cycle to free up unused objects and reduce the heap size. Nevertheless, the JVM may eventually report an OutOfMemoryError, which can cause the application to crash.
The monitoring graph would be something like this:
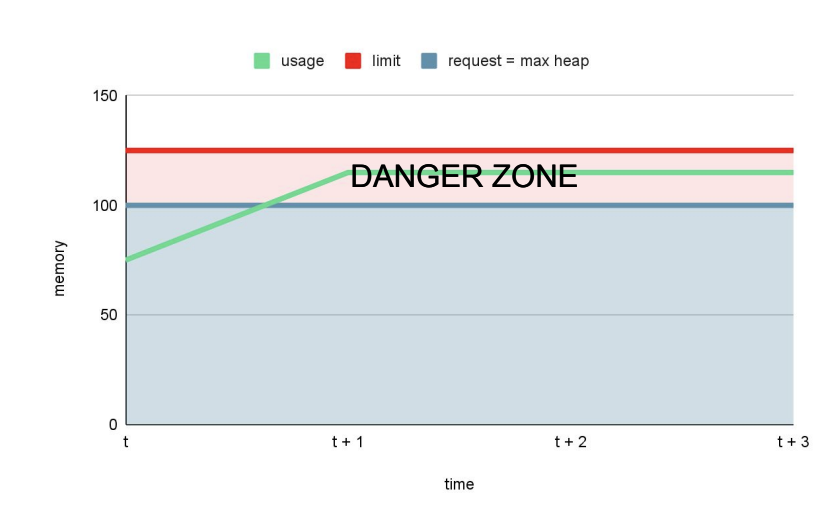
In general, the JVM is often not keen on giving back memory, so the pod could get stuck in the danger zone. The danger zone for an application can be defined as the point where the memory usage increases over time consistently and approaches the maximum available memory limit. In this situation, if the memory usage surpasses the maximum available limit, the application is at risk of experiencing an OutOfMemory (OOM) error and crashing.
This is not good enough, so we can try to align requests and limits, and tweak the heap size.
apiVersion: v1
kind: Pod
spec:
containers:
- name: foo
  resources:
    limits:
      memory: "100M"
    requests:
      memory: "100M"
      cpu: "500m"
  env:
    name: "JAVA_OPTS"
    value: "-Xmx75M"
Which would imply:
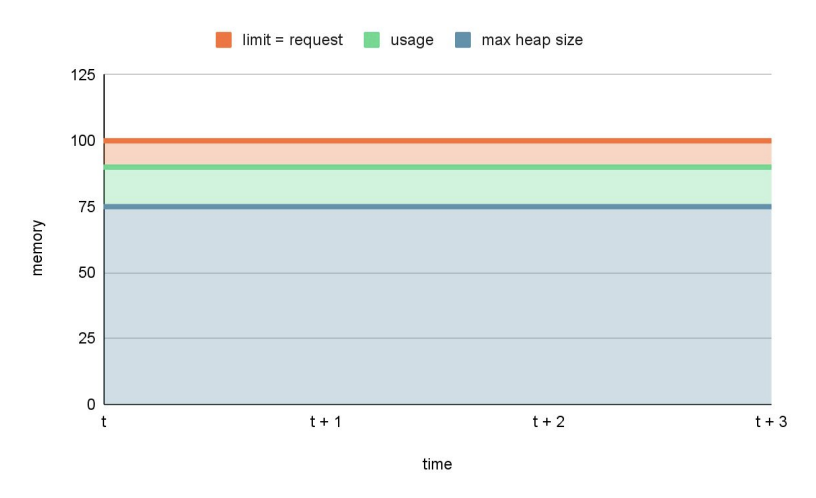
As you can see, there is no danger zone now, meaning there is no risk of getting killed. At the same time, we have a minimal amount of wasted RAM.
This exercise highlighted the importance of setting the maximum heap size appropriately based on the available resources and the memory requirements of the application:
-Xmx to something less than memory requests and limits.requests equal to limits for memory is a good idea in general.Notice that I quoted "helpers." The parameters -XX:InitialRAMPercentage, -XX:MinRAMPercentage, and -XX:MaxRAMPercentage can help to configure the heap size of a JVM application. They assist in controlling the heap size of a JVM application by specifying the percentage of the total available memory that the JVM should use.
By specifying the InitialRAMPercentage, we can set the initial heap size (as a percentage of the available physical memory). At the same time, the MinRAMPercentage and MaxRAMPercentage parameters determine the minimum and maximum heap size that the JVM can grow to, respectively.
This could be handy in an ecosystem with hundreds of microservices, given that these JVM flags can help configure each JVM application’s heap size in a more controlled and scalable manner. Some observations:
-Xmx JVM flag, which sets the maximum heap size, so we can ensure that the JVM heap size is configured optimally for the specific application.However, in a Kubernetes territory, it is advised to use the requests and limits parameters to manage the memory allocation of a pod. For example, -XX:MaxRAMPercentage is a soft limit, and the JVM may consume more memory if needed. As such, using these JVM flags in combination with the requests and limits parameters is a more reliable and recommended approach for managing memory usage in Kubernetes.
requests / limits)?To answer this question, we need to consider several factors outside the heap that can impact the performance and stability of a Scala/Java/Kotlin application in Kubernetes. Some of these factors are:
-Xmx setting. A high setting for -Xmx can cause the non-heap memory to be exhausted, leading to OutOfMemoryError exceptions and application crashes.-XX:MaxMetaspaceSize flag. The rule of thumb here would be to limit the metaspace size to a value 16 times lower than the available memory. So, for example, if the JVM has 4 GB of available memory, -XX:MaxMetaspaceSize=256M would be correct.-Xmx configuration too. For example, if the Pod has 4 GB of available memory and a 1 GB tmpfs mount, a common setting for -Xmx might be -Xmx3G. This ensures that the JVM has enough memory to run correctly, even with the additional memory requirements of the tmpfs mount.-XX:+UseG1GC and -XX:MaxGCPauseMillis JVM flags are related to the garbage collector and can be used to tune its behavior:-XX:+UseG1GC enables the G1 garbage collector, a concurrent and parallel garbage collector designed to minimize GC pauses.-XX:MaxGCPauseMillis sets the maximum GC pause time in milliseconds, the maximum amount of time that the JVM will pause for garbage collection.Therefore, regarding garbage collection, larger heap sizes may result in a longer GC pause time, while a smaller heap size may result in more frequent GC pauses.
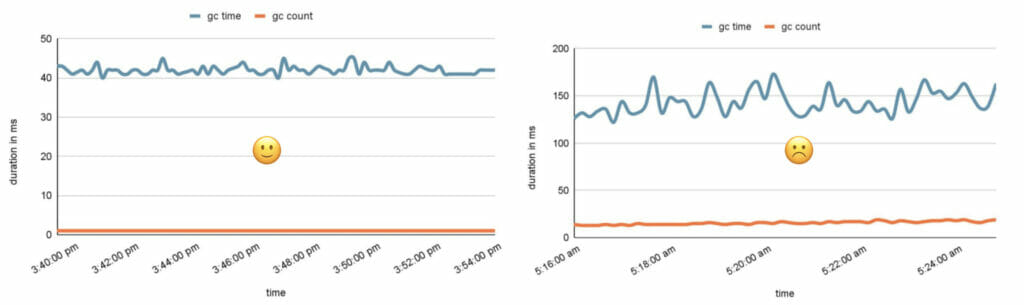
The graphs above show good GC pause times and count on the left. In contrast, on the right, we can see frequent and prolonged GC pause times, which could be a sign of lousy performance if we keep noticing an increase in GC count and GC pause times, indicating that the garbage collector is working more frequently and for more extended periods.
It’s essential to set the maximum heap size appropriately based on the available resources and the application’s memory requirements and to tune the garbage collector flags based on the desired performance characteristics of the JVM. Of course, the optimal settings depend on the application’s specific needs and running environment. But typically, a good rule of thumb would be:
G1.Some of the resources are "poolable," so it might be preferable to have larger pods to minimize overhead. However, these bigger pods where we could run multiple containers do not necessarily reduce memory overhead, given that each JVM will have its heap and metaspace, which will consume memory independently of the other JVMs. On the other hand, containers in the same pod share the underlying host system resources, such as the CPU, network, and file system. So there may be a reduction in overhead in those areas.
It’s also essential to consider the trade-offs associated with having larger pods. For example, larger pods may result in increased competition for resources, decreased resiliency in case of node failures, and increased complexity in terms of resource management and scaling.
Therefore, whether to have bigger pods or smaller, separate pods should be based on careful consideration of the specific requirements and constraints of the application. Also, as mentioned above, monitoring is crucial to understanding the performance and stability of a Scala/Java/Kotlin application in Kubernetes. JMX, Prometheus, or any other monitoring stack should be used to monitor the JVM and application performance.
So far, so good. After exhaustive tuning and all the considerations explained above, we have concluded what the memory settings should be (requests = limits). However, what happens when the pod’s memory usage reaches the limit?
When the memory usage of a pod in Kubernetes reaches the defined limit, the operating system may start to kill processes within the container to free up memory.
In these cases, the pod will be happily getting restarted (3 restarts in the following example):
> kubectl get pods
NAME          READY      STATUS    RESTARTS    AGE
pod-name      1/1        Running   3           11d
> kubectl describe pod ${pod_name}
...
Containers:
service-name:
...
Last State: Terminated
Reason: OOMKilled
Exit Code: 137|143
...
QoS Class: BurstableAnd the container is effectively getting OOMKilled, which is not good at all, as this can result in the termination of the entire container, leading to potential data loss or application downtime. Apart from fixing the OOMKilled issue, having a shutdown hook in place could be useful if cleanup is needed. For example, there is a default shutdown “sequence” for PlayFramework.
Going back to the main issue, OOMKilled could be due to various factors, some of them aforementioned:
Xmx is not suited to the workload, resulting in insufficient heap memory.Xmx settings.OOMKilled event.There are many interesting strategies for identifying the root cause of the OOMK, like checking logs or reviewing the different dashboards and metrics once again. Still, based on our experience, there are a few relevant options:
Flame graphs bring visual representations of the call stack of a program and can be used to identify performance bottlenecks, including memory issues. By analyzing the flame graph of the affected pod, you can see which parts of the code consume the most memory and whether there are any memory leaks.
Some interesting tools:
Profiling tools such as JProfiler or VisualVM can help to identify memory leaks, excessive memory usage, and other performance bottlenecks that could be contributing to the OOMK event.
Using port forwarding, we can get access to applications running in a Kubernetes Cluster:
> kubectl port-forward ${pod_name} 1099:1099Then, using VisualVM: VisualVM -> Add JMX connection -> localhost:1099, you can get the metrics that can help you to debug issues.
Prometheus and Grafana bring a quick and effective way to monitor the JVM’s performance in real-time, allowing to identify and address performance issues before they escalate quickly. Here are a couple of examples:
If you suspect that a memory leak caused the OOMK, you can take a heap dump of the affected pod and analyze it using a tool like the aforementioned JProfiler or VisualVM. To obtain a heap dump in case of an OOMKilled event, you can set the following JVM flags:
-XX:+HeapDumpOnOutOfMemoryError: This flag causes the JVM to generate a heap dump when an OOM event occurs.-XX:HeapDumpPath=: This flag specifies the file path where the heap dump will be written.To get access to the heap dump, you need to mount a volume, for instance:
apiVersion: v1
kind: Pod
spec:
  containers:
    - name: foo
      resources:
        limits:
          memory: "100M"
        requests:
          memory: "100M"
          cpu: "500m"
      volumeMounts:
        - name: heap-dumps
          mountPath: /dumps
  volumes:
    - name: heap-dumps
emptyDir: {}In conclusion, after figuring out the root cause of the OOMK, you can take the necessary steps to resolve it, such as optimizing memory usage, tuning the JVM’s garbage collection settings, or adjusting the memory settings of the affected pod.
That’s great, but a new question applies here: Could we not do this and autoscale on memory?
Autoscaling on memory could be an approach to avoid OOMKilled events in Kubernetes, using the Horizontal Pod Autoscaler (HPA).
Autoscaling is the process of automatically adjusting a pod’s number of replicas based on resource usage. By configuring autoscaling on memory, we can ensure that the number of replicas of a pod increases as its memory usage approaches the limit and decreases as its memory usage decreases. This way, we can avoid OOMKilled events and ensure that the memory usage of the pod stays within acceptable limits.
Let’s see an example of a Helm chart using the HPA resource:
# {prod,stage}_values.yaml

autoscaling:
  cpu: 70
  memory: 75
  minReplicas: 5
  maxReplicas: 24
When the average memory utilization of the pods in the deployment is above the target utilization (75%), the HPA will scale up the number of replicas. However, when the average CPU utilization of the pods is below the target utilization, the HPA will scale down the number of replicas. The same applies to CPU utilization (70%).
This Helm chart will be traduced into the following HPA manifest:
apiVersion: autoscaling/v2beta1
kind: HorizontalPodAutoscaler
spec:
  minReplicas: 5
  maxReplicas: 24
  metrics:
    - type: Resource
      resource:
        name: cpu
        targetAverageUtilization: 70
    - type: Resource
      resource:
        name: memory
targetAverageUtilization: 75Basically, the HPA will maintain the number of replicas between the minimum and maximum values set in minReplicas and maxReplicas.
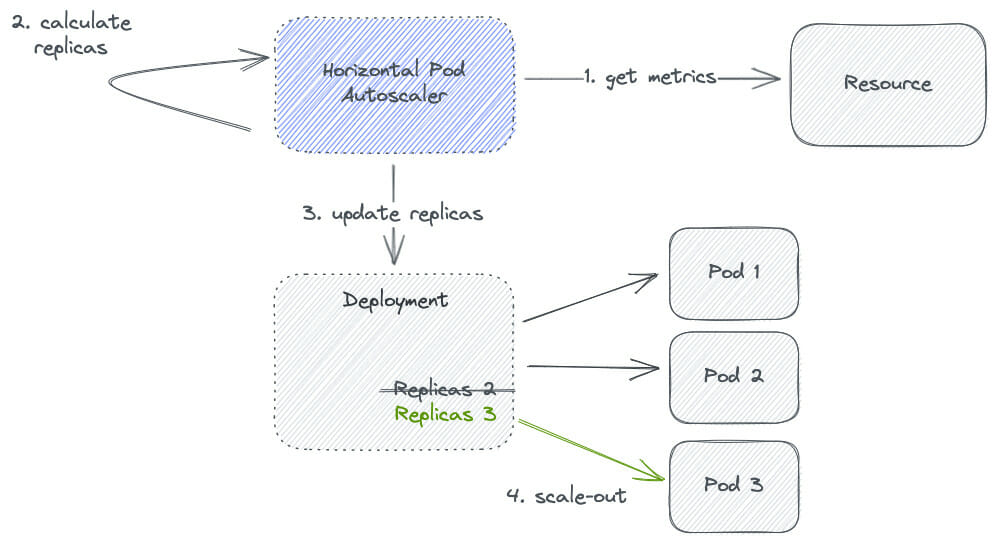
From the diagram, step 2 (calculate replicas), in pseudocode, would be calculated as follows:
desiredReplicas = ceil(
  currentReplicas * (currentMetricValue / desiredMetricValue )
)

currentMetricValue = avg(metric across all replicas)
desiredMetricValue = targetAverageUtilization * metric’s request value

usage rate = currentMetricValue / desiredMetricValue :
  - > 1.1 -> scale up
  - < 0.9 -> scale down
  - -> no changes

minReplicas <= desiredReplicas <= maxReplicasHere is an example of a Kubernetes HPA resource configuration focused on autoscaling based on CPU utilization:
# values.yaml
resources:
  requests:
    cpu: "1"
autoscaling:
  cpu: 80
  minReplicas: 1
  maxReplicas: 4
As you can see in the example above, we are requesting 1 CPU for the pod, targeting an average utilization of this CPU of around 80%, autoscaling between 1 and 4 replicas.
# manifests
spec:
  containers:
    - name: foo
      resources:
        requests:
          cpu: "1"
spec:
  minReplicas: 1
  maxReplicas: 4
  metrics:
    - type: Resource
      resource:
        name: cpu
        targetAverageUtilization: 80
Let’s figure out what would be the desired number of pods, following the algorithm described above:
> kubectl -n ${namespace} get hpa

> kubectl -n ${namespace} describe hpa ${hpa_name}
Metrics:                    ( current / target )
  resource cpu on pods:     90% (900m) / 80%
Min replicas:               1
Max replicas:               4
Deployment pods:            1 current / x desired
From this, we understand that:
targetAverageUtilization) is 80% (0.8).Solving x, the desired number of pods, would mean:
x = ceil(currentReplicas * (currentValue / desiredValue))
x = ceil(1 * (currentValue / desiredValue))
x = ceil(1 * (0.9 / desiredValue))
x = ceil(1 * (0.9 / 0.8))
x = ceil(1 * 1.125)
x = 2
Therefore, the usage rate is 1.125, which is above 1.1, so it’s necessary to scale up to 2 pods. In conclusion, here we have demonstrated how the HPA for CPU works, but how does the HPA work for memory?
# manifests
spec:
  containers:
    - name: foo
      resources:
        limits:
          memory: "1000M"
        requests:
          memory: "1000M"
spec:
  minReplicas: 1
  maxReplicas: 4
  metrics:
    - type: Resource
      resource:
        name: memory
        targetAverageUtilization: 80
Depending on the needs, the memory could make the cluster scale up, following a trend like the following:
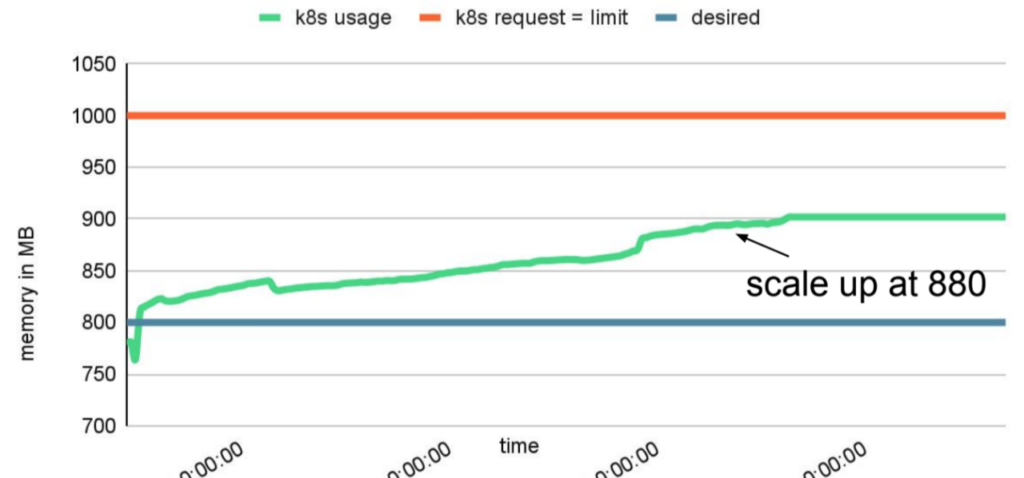
However, the JVM is not keen to give back memory, avoiding any possible scale-down. This is because the JVM tries to keep the memory usage within the heap size defined by the -Xmx JVM flag. When the memory usage approaches the defined maximum heap size, the JVM performs a GC to reclaim unused memory and bring the memory usage down. Yet, GC only sometimes reclaims all unused memory, and some memory may be retained for longer. Why? The JVM avoids frequent GC, which can cause application pauses and affect performance. The retained memory can also be used for future allocations, helping the JVM avoid wasting memory.
Therefore, the JVM may not give back enough memory to allow a scale-down by the HPA, even if the memory usage is below the defined threshold. Nevertheless, with proper tuning and investigation (again, around -Xmx setting and the GC flags), it is possible to find the right balance between memory usage and the ability to scale down.
Autoscaling on memory can provide a dynamic and automated way of ensuring that the memory usage of pods stays within acceptable limits, reducing the need for manual tuning and configuration of memory limits. However, it’s essential to remember that autoscaling has its own resource and computational overhead and that the scale-down process may not trigger because of previously defined reasons. Further investigation would also be required.
In conclusion, during this journey, we have learned that deploying Scala microservices in a Kubernetes cluster involves careful consideration of the JVM’s memory requirements. Autoscaling based solely on memory usage is not recommended, as the JVM’s behavior towards releasing memory can make it difficult to determine when to scale accurately. Instead, trial and error, investigative work, and monitoring metrics are crucial in finding the optimal settings for requests and limits and fine-tuning these over time. The Horizontal Pod Autoscaler (HPA) can be an effective tool for scaling replicas in response to changes in resource usage, as long as it is used in conjunction with the appropriate metrics and fine-tuned over time. Additionally, it’s essential to understand the role of the non-heap memory, metaspace, and garbage collector, which affects the overall memory usage of the JVM, and to be able to identify and diagnose OOMKilled issues.
Furthermore, the Kubernetes Quality of Service (QoS) class provides another dimension of control over the resources available to the JVM. It can be used to ensure that more critical pods receive the necessary resources while lower-priority pods are limited accordingly. By combining effective resource management practices and Kubernetes tools, we can build scalable and resilient systems better equipped to handle the demands of running JVM-based applications in a containerized environment.

