Three Common Incident Response Process Examples

What makes an engineering team? Communication, collaboration, process, order, and common goals. Otherwise, they would just be a bunch of engineers. The same is true of their tools. Connectivity and process turn a bunch of tools into a DevOps toolchain. If you need a DevOp toolchain, you can use it to easily build an incident response process.
A toolchain is a series of integrations between different tools that are part of your infrastructure or work environment. Toolchains pass information between tools, saving the time it would take people to get up off their butts and hunt down information themselves. By establishing processes for certain common scenarios, you can automate some situations by establishing triggers that tell tools when they should take certain actions. For instance, latency may reach an unacceptable level or errors may become too frequent.
In this article, we’ll look at three common incident response process example based on toolchains. We could have this page scroll forever with different toolchains, but we picked three incident management scenarios that occur after activity in the CI/CD pipeline:
- Self-healing (or auto-remediation)
- Rollback after a failed deployment
- Fix forward after a failed deployment
Self-healing (or auto-remediation)
A self-healing system can receive monitoring information from the production environment and apply a remediation fix automatically.
Some common tools in the incident response toolchain include:
- Ansible (or another configuration management tool)
- Github (or another software development hosting tool)
- Jenkins (or another automation server)
- Jira Service Desk (or another service desk)
For the toolchain to automate remediation, an application performance monitoring (APM) tool needs to be included in the toolchain too. APM provides the first line of defense by correlating the time and circumstances of service degradation with other activities. The goal is to intelligently identify the root cause of incidents.
For example, Dynatrace is a popular APM tool that can easily be integrated with xMatters through the use of Flow Designer. Dynatrace is built to understand how dependencies impact other areas across your infrastructure. Should an issue arise, Dynatrace’s monitoring uses AI to automatically relate different sources of information to identify the root cause. AI also keeps in mind other services—however unrelated—that could also be impacted by downtime—or by the fix.

Depending on the type of issue, xMatters launches workflows across your systems to start the automated self-healing process.
The integration between xMatters and Ansible is also a crucial piece in a self-healing system, as it checks if a remediation has been fired already. If it has, then xMatters reaches out to Github to gather the details of the last commit. Then xMatters checks in with Jenkins to get the last deployment details. Armed with crucial details, xMatters notifies the right people of what happened. Of course, the point of auto-remediation is to fix the issue before it can affect customers.
What’s powerful here is that the xMatters integration platform connects to Dynatrace, Jira, Github, Jenkins, and Ansible so the people who are trying to resolve some messy situations can access the information they need. And they see the most salient information first, so they can quickly assess the situation and take action if necessary.
Rollback after a blue-green or canary deployment
When dealing with a failure scenario, the simplest solution and often the most effective is to execute your rollback strategy.
Some common tools in the incident response toolchain include:
- Ansible (or another configuration management tool)
- Jira Service Desk (or another service desk)
- Slack (or another messaging tool)
The two types of deployments that we’ll briefly discuss for rolling back a change are canary or blue-green deployments.
A canary deployment goes to a fraction of users, like an A/B test. A thousand things can go wrong. Suppose the test environment is different from the production environment. Or it has less user traffic than production. Or there are unrelated integrations or upgrades that have unanticipated effects on the services in production. One common fix is to roll back to the previous version until a fix can be applied.
A blue-green deployment is based on having two identical production environments, blue and green. When blue is live, green is not; and when green is live, blue is not. You test your new release in the blue development environment, which is not live, and then push the blue environment live and pull the green environment down.
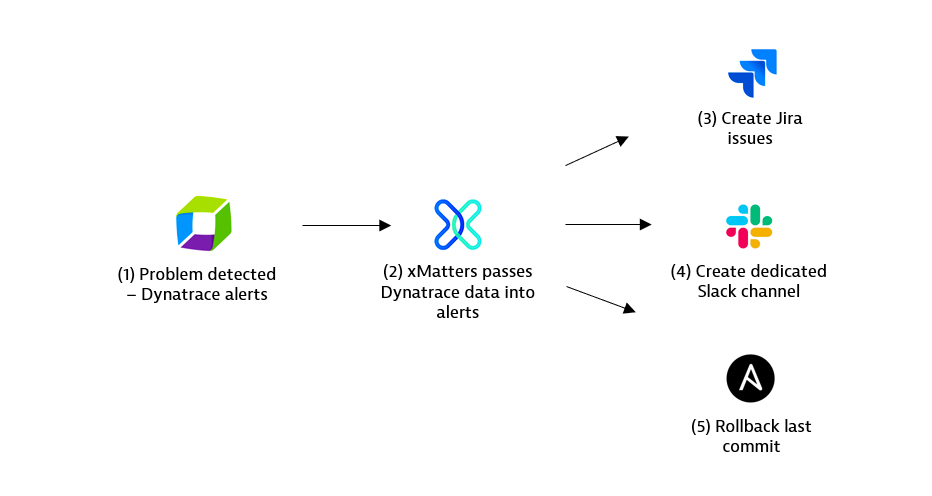
In the example above, xMatters uses its Slack integration to post to a channel to acknowledge the issue. It executes a runbook through Ansible and creates a Jira ticket.
Finally, xMatters initiates a pre-configured Major Incident Management process. Every company runs its business differently and has a different method for resolving incidents. Depending on your line of business and the precise service in question, you may be able to wait to fix a problem until morning, or you may have to declare an emergency and wake someone up.
Each organization will have a different process. For this example, xMatters opens a new channel, specific to this issue, and creates a notification for the network operations center. The incident manager can extend the toolchain and create a message on the public-facing Statuspage from Slack for transparency.
Later, when the incident point person closes the incident, xMatters will close the Jira ticket, archive the Slack channel, and preserve a record of all the activity in the system of record, either Jira or the monitoring tool.
Fix forward after a failed deployment
Fix forward represents a different philosophy than the rollback. Instead of rolling back to the last version, some organizations choose to fix the issue in production and deploy again. Companies that deploy multiple times per hour might fix in production and just wait for the next scheduled deployment, depending on urgency.
Some common tools in the incident response toolchain include:
- Jira Service Desk (or another service desk)
- Dynatrace (or another monitoring tool)
- Slack (or another messaging tool)
- Ansible (or another configuration management tool)
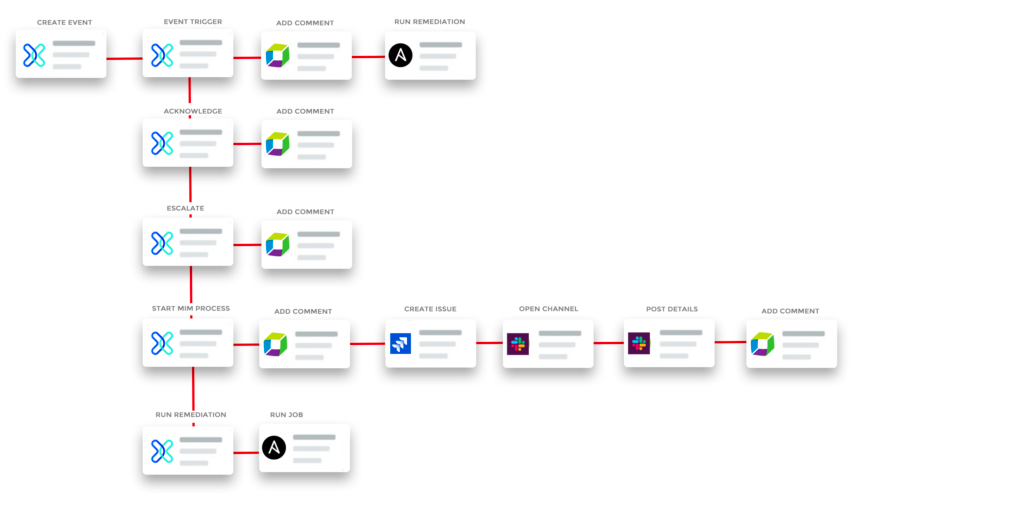
In the example above, Dynatrace detects a problem and fires into xMatters with an HTTP call. Then more details are received about the topology, including the service’s dependent services. If the severity is anything but high, then xMatters creates a Jira issue for the morning.
A high severity creates a new issue, and the event status trigger adds a comment to the Dynatrace problem. The recipients of the xMatters event get several response options, two of which are to post a comment back to the Dynatrace problem.
The Start MIM response triggers the Start Major Incident Management process to create a new Jira Service Desk issue and a Slack channel. It adds relevant details to the Slack channel then updates the Dynatrace problem with the Jira issue and Slack channel links. A final response option is to run the associated remediation job through Ansible.
It’s classic DevOps: Try something. See if it works. If it didn’t work, try something else.
To learn more about xMatters and how you can use the platform to automate incident response, create powerful toolchains and collaborate dynamically across the organization, request a demo today!

