
In the manufacturing industry’s competitive landscape, excelling in the digital era involves more than quality products; it’s also about leveraging your data and using it for data analytics, online analytical processing. Learn how AMOT, a top manufacturing company, turned vast raw financial data into actionable business insights with the help of our Power BI Developers.
Intelligent Business Decisions with Real-Time Data by Power BI
At Sunflower Lab, we don’t just provide standard solutions. We specialize in understanding the core of every challenge and creating a custom business intelligence strategy to fit unique needs. By thoroughly examining AMOT’s business processes and data complexities, we gained a deep understanding of our client’s real requirements – resulting in a dynamic Power BI dashboard powered by strong Data Analysis Expressions (DAX).
The result by Power BI experts? A well-designed, user-friendly dashboard that visually shows AMOT’s financial status and enhances team collaboration. It’s not just about having data; it’s about having purposeful, analyzed data ready for action. Know more about what Power BI experts bring to your company
With specific dashboards for Revenue & Finance, Inventory & Backlog, and Orders & Booking, AMOT’s team can now understand their operational standing and make important decisions swiftly to stay ahead in the market.
Power Up Your Business Intelligence with Power BI
Read How Power BI Solution Was Implemented for AMOT To Drive Business Intelligence
Deciphering AMOT's Hurdles with DAX Powered Dashboards
The approach was purpose-driven and client-focused. We didn’t just create dynamic dashboards; we provided AMOT with a valuable tool that is forecasting ability. Now, the AMOT team not only understands their current position but also has the capability to anticipate future trends and adapt their strategies proactively with the help of a senior Power BI developer and BI tools.
Into Pain-Points of AMOT
- AMOT realized the importance of gaining proper financial insights to have a clearer understanding of the business’s progress. It was crucial for them to have real-time updated figures without the need to allocate resources specifically for this task. By implementing a streamlined financial Power BI reports system that automatically updated data, AMOT was able to make informed decisions promptly and efficiently via meaningful insights
- AMOT encountered challenges with data integration, consolidation, requiring considerable time and effort to achieve a holistic overview. Consequently, this hindered seamless team collaboration and impeded effective information sharing within the organization.
- Being a prominent manufacturer renowned for its quality products, faced the challenge of efficiently handling diverse orders across a broad spectrum of products. The intricate process of managing orders demands careful attention to detail and effective coordination to ensure customer satisfaction and operational excellence.
Solving with Power BI Capabilities
AMOT recognized the need for a more effective approach in handling the extensive raw data from various sources. The team aimed to stay informed about data like inventory, backlog, revenue, etc., but struggled to envision a model that could consolidate and keep everyone updated on this data in real-time. During the ideation phase, our Power BI development company collaborated with the client to understand their challenges and goals.
Our Power BI developers delved into the root problems faced and identified the specific data visualization requirements to enhance business intelligence. Subsequently, our team proposed a dynamic dashboard model with a forecasting feature, empowering AMOT to monitor real-time data and track trends for informed decision-making based on automatically updated data.
What is the difference between static and dynamic dashboard?
The distinction between static and dynamic dashboards captures the core of how modern data visualization tech has evolved. A static dashboard is like a fixed report showing past data from data sources as it was when created, not updating automatically with new data. It’s a snapshot offering insights at one moment but lacks flexibility to adapt to new info or track trends.
On the other hand, a dynamic dashboard is an interactive tool updating in real-time as new business data comes in. It allows users to delve into metrics, apply filters, and interact to gain insights. Dynamic dashboards reflect the current state continuously, crucial for informed decisions in a fast-paced setting. They not only show data in real-time but also support exploration and discovery, helping businesses adapt swiftly and stay competitive.
Hitting The Spot: How Our Solution Impacted AMOT

Through a PowerBI dynamic dashboard, raw data from various operational systems is centralized and transformed into actionable Business Intelligence insights. By simply glancing at the intuitive dashboard interface, users can easily access and interpret key metrics such as bookings, pipeline status, revenue trends, backlog analysis, and real-time inventory insights, all tailored to specific business requirements.
The AMOT team effectively leveraged this consolidated, in-depth analysis of real-time data and business intelligence tools, fostering a collaborative environment that encouraged cross-functional teamwork and data-driven decision-making processes. This facilitated not only quicker but also more accurate decision-making processes that were instrumental in driving operational efficiencies and strategic business growth.
Architects of Success: Role of Power BI Experts
Power BI experts, also referred to as Power BI developers or analysts, have a key role in companies. They connect data with insights using Microsoft’s Power BI platform, turning raw data into useful information with interactive dashboards and reports. With the expertise of Microsoft business intelligence stack and even SQL server integration services, they use their essential skills to turn data into custom visuals. Below are main Power BI developer roles & responsibilities:
- Data Transformation: Data professionals gather data from various sources, clean and organize it meticulously, and build data models to suit business needs.
- Data Analysis and Visualization: They analyze data carefully to identify trends, patterns, and anomalies. Then, they create visually appealing dashboards, develop custom charts and reports to communicate these findings effectively to stakeholders.
- Communication and Collaboration: Professionals skilled in Power BI excel in collaboration. They work closely with different departments in the organization to understand their specific requirements and ensure the reports and dashboards they develop address relevant questions.
Power BI experts play a crucial role in connecting technical experts with non-technical decision-makers. Through their expertise, they transform complex data sets into actionable insights, enabling businesses to make well-informed decisions and effectively reach their objectives. By bridging the gap between data analysis and strategic decision-making, Power BI experts empower organizations to leverage data-driven solutions for sustainable growth and success.
Get Smart Data Visualization With Manufacturing Dashboards
The integration of data with manufacturing is not only essential but also highly beneficial. Data analytics breathes life into raw data, painting a vivid picture of efficiency, quality, and potential. In today’s dynamic and competitive landscape, manufacturers must consistently refine their processes to maintain a competitive edge. This is where Power BI manufacturing dashboards prove invaluable, providing real-time insights into every phase of the manufacturing process.
Utilizing the Microsoft Power BI Dashboards service empowers manufacturers to craft dynamic dashboards tailored to meet their unique needs. This platform facilitates KPI measurement, production line monitoring, and quality control data analysis, offering a personalized view for quick decision-making through actionable insights.
The custom-made dashboards from Power BI dashboard development services aid decision-makers in identifying obstacles and pinpointing areas for enhancement, fostering a culture of continual improvement. The following presents a comprehensive overview of the extensive benefits provided by Power BI dashboards in the manufacturing sector. Read Now
Diving into the Realm of Power BI Solution
Power BI empowers manufacturers to make data-driven decisions across various aspects of their operations. Production planning, inventory management, and supply chain optimization become more informed with insights gleaned from Power BI. Inefficiencies become apparent, allowing for adjustments and cost reductions.
What We Delivered to AMOT?
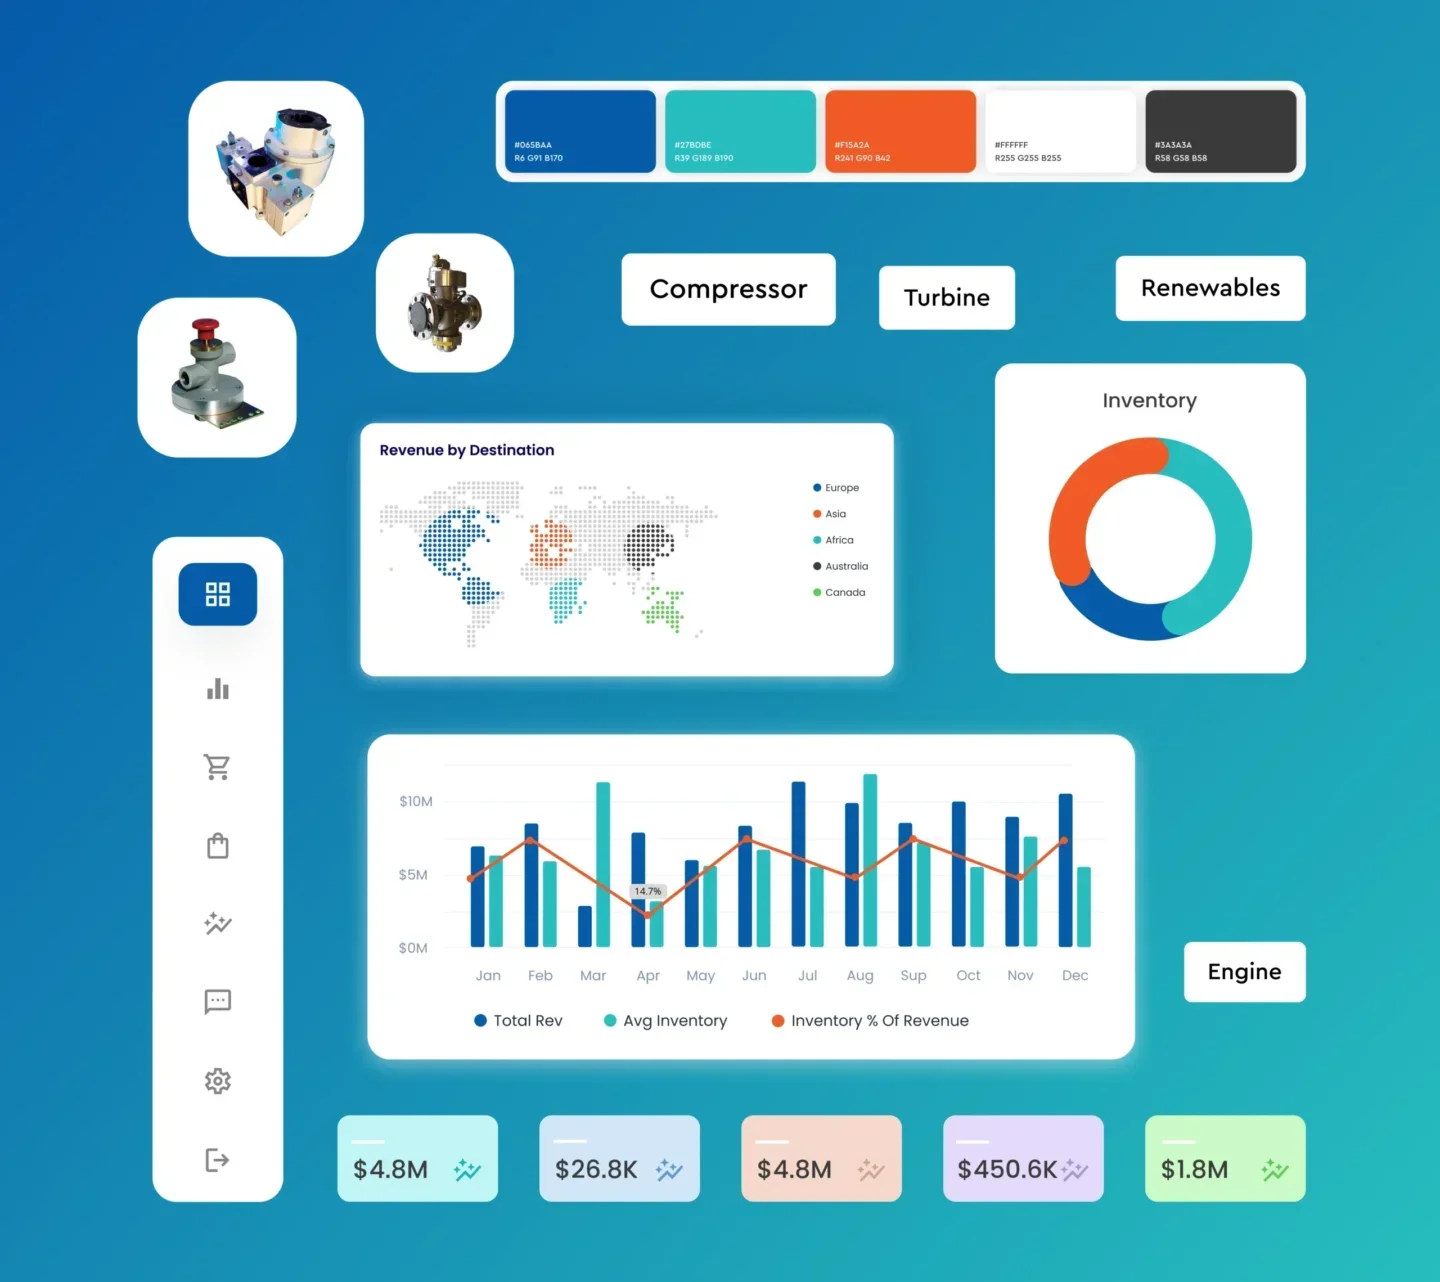
Revenue & Finance Dashboard
Presenting a visualization of a company’s financial health based on real-time data demonstrates a breakdown of revenue, profitability metrics, KPIs, and more. These dynamic dashboards are tailored to the company’s specifications. Given AMOT’s international clientele, extensive data processing is crucial. Offering stakeholders and decision-makers a comprehensive overview simplifies informed decision-making processes.
Inventory & Backlog Dashboard
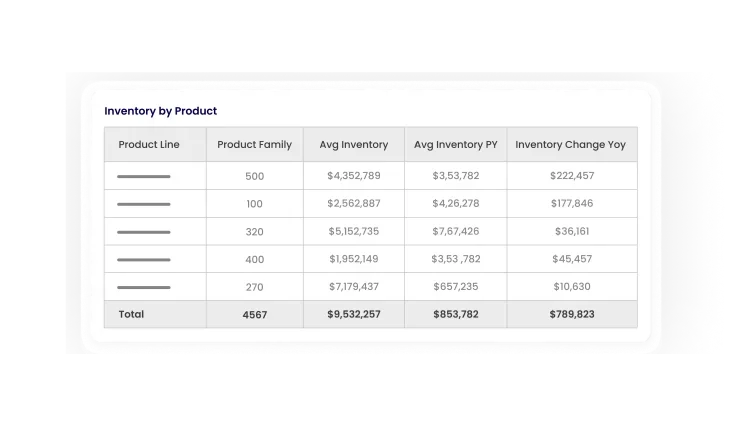
AMOT is a renowned company specializing in the manufacturing of high-quality industrial valves used in various industries worldwide. With a dedicated focus on precision engineering, we understand the importance of real-time inventory monitoring and backlog management to streamline operations and enhance efficiency. In response to this need, our team has put forth a comprehensive proposal for the integration of a dynamic dashboard model. This innovative approach leverages advanced real-time data forecasting techniques to provide actionable insights and ensure optimal performance across all operational aspects.
Orders & Booking Dashboard
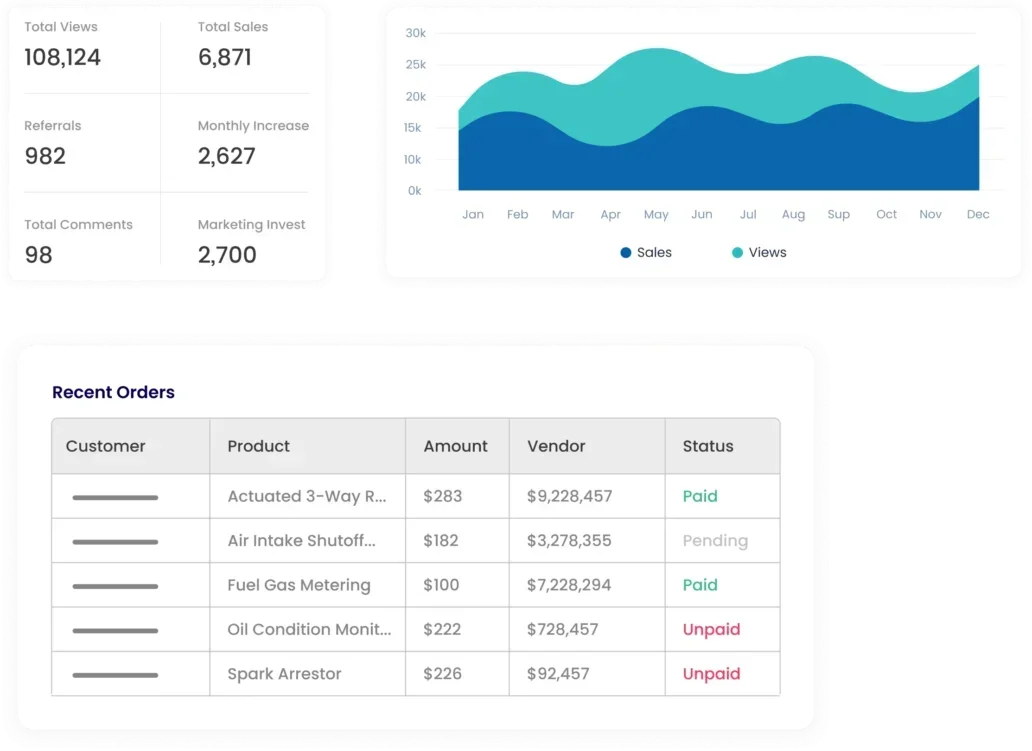
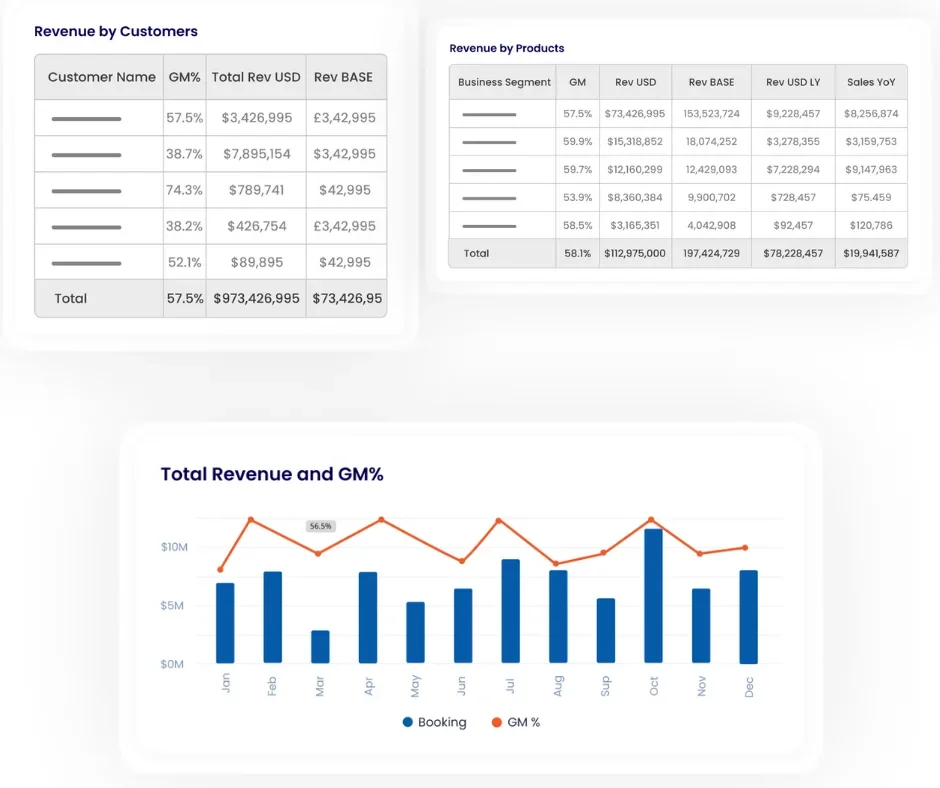
Given that AMOT is a leading global manufacturer with operations spanning various continents, keeping a close tab on sales performance, customer order trends, and booking status is paramount for the company’s success. Understanding the significance of this data, Sunflower Lab dedicated efforts to crafting a sophisticated dynamic dashboard that seamlessly updates in real-time, providing invaluable insights into the Complex web of sales data for informed decision-making.
Beyond Dashboards: Power BI DAX Reports
By utilizing DAX functions in Power BI, complex calculations and data manipulations can be effortlessly executed. Our dedicated team took the necessary steps to guarantee the feasibility of dynamic queries and time intelligence within the system. Thanks to the implementation of DAX, a more real-time element has been seamlessly integrated into the dashboards, ensuring they remain consistently updated to provide users with the most current information available.
What does a Power BI developer do?
A successful Power BI developer has many roles and responsibilities, they are crucial to analyze data, translating complex data into insights that guide business strategies, data transformation and data modeling. They use Microsoft Power BI to create BI solutions, ensuring data accuracy, interactive reports and building tailored dashboards for businesses.
These Power BI development experts not only analyze and model data effectively but also optimize data processes and security for meaningful insights. Their skills enable organizations to make quick data-driven decisions, enhancing transparency and efficiency. Have more queries? ask our Power BI developer
Impact of Power BI in Business Revenue: Above & Beyond
Data-Driven Sales and Marketing: Power BI enables you to analyze customer data and sales trends. Identify profitable demographics, popular products, and adjust marketing campaigns for better results. This targeted approach can boost conversion rates and sales.
Improved Customer Retention: Happy customers come back. Power BI helps you analyze customer behavior to spot potential churn risks. Use this insight to create loyalty programs and address their concerns. Stronger relationships mean steady revenue.
Optimized Pricing Strategies: Set the right prices with Power BI analysis on competitor pricing, customer behavior, and production costs. Find the sweet spot that maximizes profits while keeping margins healthy.
Informed Product Development: Stop guessing what customers want. Use Power BI to analyze preferences and market gaps. Develop new products that appeal to your audience for increased sales and competitiveness.
Cost Reduction and Efficiency Gains: Streamline operations with Power BI insights. Identify and eliminate waste or inefficiencies in production, resources, and inventory. Cut costs and enhance profitability. Read How Power BI Reduces Cost for Enterprise
Running the Numbers of Success
In a Microsoft case study, Jabil’s transformation with Power BI boosted revenue and efficiency. Before Power BI, Jabil struggled with real-time data insights, hindering quick decisions. With Power BI, Jabil streamlined data analysis, saw productivity soar, and monitored global production metrics live for efficiency gains. Costs dropped, revenue surged within a year, all due to Power BI’s impact detailed in Microsoft’s case study on Jabil. This success story showcases Power BI’s power to revolutionize manufacturing and drive growth. Explore full story here
According to a Deloitte report, a prominent provider of industry analytics and advisory services, manufacturing companies that used Power BI saw a notable revenue increase. The report states that businesses integrating Power BI observed an average revenue growth of 15% in the first year. With Power BI’s analytics, these firms could identify inefficiencies, improve production, and make data-driven decisions that directly impacted financial performance. This data highlights the benefits of advanced data visualization tools and demonstrates Power BI’s potential to revolutionize operations and boost financial gains. (Source: Deloitte Analysis, “Impact of Power BI on Manufacturing Sector”)
Conclusion
The implementation of Power BI solutions has brought real-time financial insights to the forefront, empowering AMOT to navigate through inventory complexities with ease. The dashboards offer a comprehensive view of key metrics like international bookings, revenue, and sales performance, all continuously updated. This accessibility and clarity have been instrumental in fostering team collaboration and enhancing operational efficiency.
Furthermore, the utilization of Data Analysis Expressions (DAX) has added a new layer of time intelligence to the dashboards, transforming them into predictive tools. With the forecasting feature, AMOT can not only grasp its current status but also anticipate future trends, setting a new standard for business intelligence tools.
Reflecting on AMOT’s journey, it’s evident that the digital transformation driven by Power BI and expertise of Power BI development company was more than just a technological advancement. It was about empowering the company to swiftly make well-informed, precise business decisions. AMOT’s success story underscores the potential of Power BI solutions in driving business intelligence, demonstrating that with the right tools, companies can indeed lead the pack in today’s data-driven world. Need Power BI for your organization? Contact Us Today
Drive Success with Our Tech Expertise
Unlock the potential of your business with our range of tech solutions. From RPA to data analytics and AI/ML services, we offer tailored expertise to drive success. Explore innovation, optimize efficiency, and shape the future of your business. Connect with us today and take the first step towards transformative growth.
You might also like
Stay ahead in tech with Sunflower Lab’s curated blogs, sorted by technology type. From AI to Digital Products, explore cutting-edge developments in our insightful, categorized collection. Dive in and stay informed about the ever-evolving digital landscape with Sunflower Lab.