The modern business world has abundant data, yet interpreting its hidden stories goes beyond analytics. It calls for robust visualization tools, data science and BI tools that not only show data but reveal clear patterns and insights to you through data analytics. Power BI shines as a guide, brightening the way to comprehend customer behavior like never before.
Learn Your Customers with Business Intelligence
In the world of ongoing customer interactions, understanding your customer’s behavior patterns is crucial for a successful business strategy. Power BI developer services is all about making informed decisions grounded in reality, not assumptions. For executives guiding strategic direction, Power BI goes beyond analytics, providing a clear view of the customer experience and highlighting needs, desires, and preferences throughout the business landscape.
Power BI is a set of business analytics tools created by Microsoft to assist businesses in consolidating, analyzing, and visualizing data effectively. It acts as a narrative tool for raw numbers, providing data governance, accountability, and dynamic insights into customer behavior. Contact a leading Power BI development company to know more about Power BI capabilities.
The Power BI Developer benefits from being familiar with the Microsoft Business Intelligence stack, encompassing Power Pivot, SSRS, SSIS, and SSAS. Given widespread use of Microsoft services, a knowledgeable Power BI Developer is valuable to any company.
What is the consumer analysis?
Consumer analysis involves examining and understanding customer data to grasp their behavior, preferences, and needs. This helps businesses tailor products, marketing, and services to meet specific audience demands.
By using tools like Power BI for data analytics, companies turn raw data into actionable insights for better decisions in product development, marketing, and customer service. Consumer analysis predicts and meets customer demands, fostering loyalty and a competitive edge. Thus Power BI development for any organization becomes an essnetial factor in the current market environment.
Unveiling Customer Behavior: Embark on a Visual Journey with Power BI

In today’s competitive marketplace, consulting and hiring a Power BI expert and knowing your customers is essential, not just a perk. Understanding customer behavior is crucial for growth, improving marketing efforts, and building brand loyalty. Yet, executives face the hurdle of turning loads of customer data into practical insights.
Traditionally, understanding customer behavior involved dealing with endless spreadsheets and reports, a time-consuming and often frustrating process. But with Power BI, everything changes. Power BI is a powerful business intelligence tool that helps you clearly visualize customer behavior patterns. Imagine turning complex data sets into easy-to-understand dashboards and charts that reveal hidden trends and customer preferences through data analytics instantly. Using various Power BI developer roles, executives can quickly understand why customers act the way they do, making informed decisions that drive real business results.
Understanding Purchasing Power
Understanding your customers’ buying patterns is like decoding a secret message, the key to driving growth and profits across various industries. Power BI capabilities include decoding tool, turning detailed purchase data into clear visuals that reveal valuable insights.
Data Analytics for Trends
- Line Charts: Line charts are great for displaying purchasing trends over time. You can monitor sales on a monthly, quarterly, or yearly basis to spot seasonal buying patterns. For instance, if a line chart reveals a surge in sports equipment sales in the second quarter, it could suggest the need to tweak marketing strategies to leverage pre-season trends.
- Stacked Line Charts: Improve trend analysis by utilizing stacked line charts to visualize shifts in customer preferences across various product categories on a single chart. For instance, observe electronics sales increasing while apparel sales decline. This visual representation of raw data aids in detecting changes, enabling adjustments in marketing strategies or product offerings.
Customer Segementation with Power BI
Power BI’s true strength lies in its ability to segment customer data effectively. By analyzing purchases from different perspectives, unique customer segments with varied buying habits can be uncovered.
- Customer Demographics Overview: Segregate purchases via Power BI development and data analysis of customer demographics like age, gender, income, or location. This aids in identifying valuable customer segments and tailoring products/services accordingly. For example, a visual representation illustrating the frequency of purchases across different age groups might reveal that customers aged 35-45 shop more frequently. As a result, targeted promotions or loyalty programs tailored to their preferences can be directed towards this group.
- Customer Type: Analyzing purchasing behavior with Power BI experts using loyalty programs or customer categories (new vs. returning). Imagine a bar chart comparing the average purchase value between new and returning customers. This helps in shaping targeted marketing strategies. For instance, if the chart shows that returning customers have a significantly higher average purchase value, you can concentrate on enhancing customer loyalty through personalized suggestions or exclusive deals.
Prioritize Key Customer Segements
- Scatter Plots: Scatter plots are crucial for identifying customer segments with high purchase value on one axis and purchase frequency on the other. With Power BI developers, get a scatter plot showing big circles in the top right corner, representing a smaller customer group with both significant purchase value and frequency – your most valuable customers. This allows for targeted campaigns or loyalty programs to be created for this particular segment.
- Churn Risk Analysis: Using Power BI is crucial to identify customers at risk of stopping purchases. By examining their purchase history (how often and recently they buy) and displaying the data clearly with charts, you can discover valuable insights. For example, a line chart showing the average purchase value of customers close to churn could help predict possible defections. Noticing a drop in purchase value or frequency allows for proactive steps like targeted campaigns or personalized offers to re-engage these customers.
Analyze Customer Engagement Data
In today’s digital landscape, customer engagement expands across various touchpoints like websites, apps, social media, and email campaigns. Each touchpoint presents an opportunity to connect, understand preferences, and strengthen brand loyalty. Business Intelligence by Power BI serves as your engagement gauge, offering vital metrics from these touchpoints to provide insightful perspectives on customer interactions.
Measuring Customer Engagement
- Session Duration: This metric measures the average time users spend on your website or app. An increase in session duration shows increased user interest, while a decrease suggests a need to improve content or user experience. Transform this raw data into insights with Power BI experts.
- Click-Through Rates (CTRs): Assess CTRs from different touchpoints with Power BI such as email campaigns or social media ads. A high CTR shows your content resonates with the audience, while a low CTR might mean tweaks are needed in your messaging or call-to-action tactics.
- Social Media Interactions: Monitor and showcase visual metrics with BI tools like likes, comments, and shares on your social media platforms provides key insights into brand sentiment and the impact of your social media strategies.
Engagement Track via Line Graphs & Scatter Plots
- Line Graphs: Line graphs in Power BI are great for visualizing engagement metrics such as session duration over different timeframes (weekly, monthly). A steady rise in session duration could indicate effective content updates, whereas a sudden drop might signal the need to check for technical issues.
- Scatter Plots: Power BI developers use scatter plots to identify highly engaged customer segments by analyzing multiple metrics. Imagine a scatter plot with session duration on one axis and social media interactions on the other. Users in the top right quadrant represent highly engaged customers who spend significant time on your website/app and actively participate on social media. Think about customizing offers or providing early access to new products for these “brand advocates.”
Improving Where it Matters with a Successful Power BI developer
- Addressing Low Click-Through Rates in Email Campaigns: In BI tools, If a line graph shows a steady drop in CTRs for email campaigns, it’s time to analyze email content, subject lines, or sending times to find out what’s impacting engagement.
- Limited Social Media Reach: With Power BI, visualize a bar chart showing your social media followers on various platforms. If one platform has significantly fewer followers, analyze your content strategy for that platform and tailor it to attract a wider audience.
Customer Mapping
Customer behavior differs based on location, influenced by factors such as local culture, demographics, and even weather patterns. Understanding these geographical preferences through online analytical processing and Power BI reports is vital for businesses looking to customize their offerings and marketing strategies to connect with local audiences.
The Importance of Location-Based Insights
Visualizing sales data on maps with Power BI clearly shows the concentration of your customers. This geographic insight can uncover.
- Regional Sales Trends: With Power BI developers, you can pinpoint areas with high customer density, businesses can strategically focus their marketing efforts in these regions, maximizing impact and increasing customer engagement. This targeted approach allows for more efficient resource allocation and a deeper understanding of local market dynamics.
- Untapped Markets: Explore regions with lower customer saturation levels, indicating new potential for business growth and market expansion. Uncover hidden opportunities with business intelligence which are ready for exploration and utilization to penetrate markets strategically and increase market share.
Visualizing Sales Data on Maps
Power BI efficiently turns complex sales data into easy-to-understand maps based on geography. With business intelligence tools you could analyze data within a map of your country, colored by region to show sales volume. Darker colors mean more customers, lighter shades less. This visual tool helps quickly grasp regional sales trends, identifying areas for targeted marketing efforts.
Simplifying Demographics Within the Map
Power BI capabilities and strength lies in its ability to add extra data sets to your map visuals, allowing you to explore customer groups in different areas. Improve your maps using demographic information such as age, income, or household size for customized marketing messages to specific customer groups in regions.
For example, a map showing areas with high sports gear sales combined with data modeling on a large number of young adults can help target social media campaigns promoting athletic wear.
Discovering Local Trends and Emerging Opportunities
- Regional Preferences: With Power BI, for example you can create a map showing gardening supplies sales. Consider adding a layer displaying average regional temperatures to explore a possible link between warmer climates and higher sales. This insight can help in making decisions regarding product suggestions or targeted marketing strategies influenced by regional weather patterns.
- New Market Opportunities: If a map’s data visualization shows low sales in an area, looking at demographic data integration might reveal a cluster of potential customers. This allows for exploration of untapped markets and targeted outreach initiatives.
Why Data Visualization is Vital for Executive Decisions?
Picture a CEO or CTO surrounded by spreadsheets and detailed reports. Extracting useful insights from this data overload can be time-consuming and frustrating. That’s where data visualization by a Power BI expert or senior Power BI developer steps in as a significant game-changer.
- Valuable Tool for Busy Executives: CEOs and CTOs juggle numerous tasks, roles and responsibilities, leaving them little time for in-depth analysis of complex data tables. Data visualizations like interactive reports from BI tools help them quickly understand intricate information.
- Visuals Are More Powerful Than Numbers: The human brain processes visuals faster and more effectively than text. Charts, graphs, and maps from Power BI can quickly convey trends, patterns, and data relationships that may be hard to grasp from numbers alone.
What Power BI Brings to an Executive's Table?
- Interactive Dashboards: Create interactive dashboards for executives to explore specific areas of interest for deeper insights. Imagine a dashboard showing sales trends overall, with the ability to click on a region for more detailed customer demographics in that area.
- Customizable Charts: Power BI offers various ways to develop custom charts for tailored visualizations. You can customize the visualization to match the specific data story you want to tell. For example, a line chart can show sales trends over time, while a pie chart is ideal for displaying customer segment distribution by product category.
- Clear Labeling and Annotations: Make sure your visuals are easy to understand by using clear labels and brief annotations. With Power BI, you can add context and highlight important insights directly on the visualizations, reducing the need for long written reports.
Using visual storytelling with Power BI helps you turn intricate data into a compelling story that connects with busy executives. This approach lets them quickly make informed decisions to boost business growth.
Power Up Your Business Intelligence with Power BI
Turn complexity into clarity with our user-friendly Power BI solutions.
What are the 3 stages of customer analytics?
The path of customer analytics involves three key stages, each crucial in leveraging data for strategic decisions and business growth. Power BI experts handle crucial data which is used for data visualizations.
- Data Collection: Customer analytics relies on gathering essential customer data from different data sources. This data preparation stage involves carefully collecting information, such as transaction histories, website interactions, social media engagements, and customer service logs for meaningful insights. The aim is to build a comprehensive data repository that provides a complete view of the customer through BI tools like Power BI
- Data Analysis: Businesses move to the analysis phase once they have a strong dataset from data sources. In this stage, tools like Power BI are used to delve into the data, finding patterns, trends, and insights. Understanding customer behavior, preferences, and areas for improvement is crucial here. By using data models, statistical models and predictive analytics, companies gain actionable insights to guide strategic decisions.
- Action and Optimization: In the final phase, insights from data analysis are turned into actionable steps. This may involve creating targeted marketing campaigns, refining products, or enhancing customer service strategies. This stage focuses on continuous improvement by evaluating implemented strategies, learning from them, and adjusting future actions based on data feedback. This iterative process helps businesses remain agile, responsive to customer needs, and competitive.
Beyond Charts & Graphs: Business Impact of Customer Behavior Analysis
The true value of Power BI data visualizations goes beyond making nice charts; it’s about turning customer behavior insights into practical business decisions. Learn how Power BI development company helps you use data for real results.
By using Power BI dashboards to analyze customer behavior patterns, businesses can gain meaningful insights for success in different operational areas and strategic decisions through informed decision-making.
AMOT, a manufacturing company, dealt with the task of managing a large volume of raw data concerning financial areas like international bookings, revenue, inventory, backlog, and pipeline. To tackle this, they partnered with our Power BI developers to develop a Power BI dynamic dashboard solution enhanced by DAX. Read the full case study

Marketing
Identify high-value customer segments and tailor marketing campaigns to meet their specific needs and preferences to boost customer satisfaction. For example, use Power BI to discover that young adults in a certain area are more likely to purchase fitness trackers. This insight can steer focused social media campaigns promoting fitness trackers and activewear. Know more about Power BI marketing dashboards.
Product Development
Analyzing customer purchase history to spot trends in product preferences is vital for guiding the development of new products or improving existing ones to align better with customer needs. For instance, Power BI could reveal a drop in sales for a particular product category. Examining customer feedback on the platform might point out missing features or decreasing product quality, allowing you to boost your product offerings.
Customer Service
BI tools detect customer segments at risk of leaving and create proactive plans to keep them. Power BI developers can find customers who haven’t made purchases. This allows for launching focused email campaigns with custom discounts or loyalty rewards, possibly reconnecting with important customers.
Winding Up
So as we have seen how Power BI acts as a key tool for businesses, unlocking valuable customer data insights. By visualizing behavior patterns, executives can predict market trends and customer actions. It goes beyond just gaining a competitive edge; it’s about achieving deep customer understanding that drives market leadership through Power BI developers.
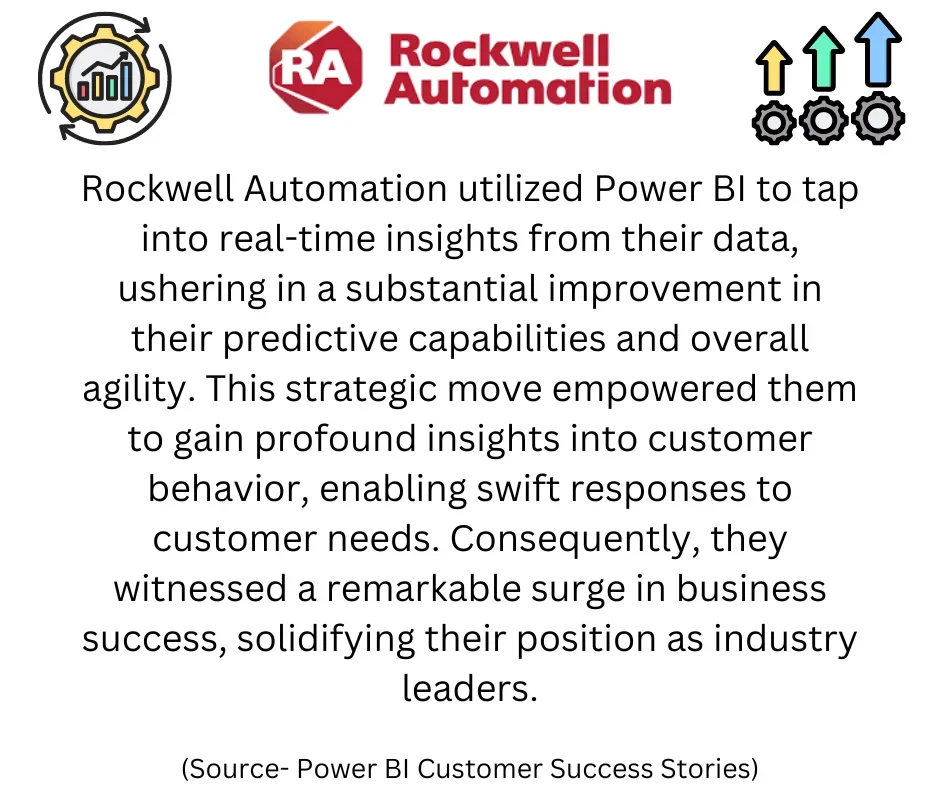
In Power BI, you have more than just a tool; it’s a strategic partner that helps you understand your customers’ needs, challenges, and goals deeply. Move your business towards success in a customer-focused era. With Sunflower Lab, embrace Power BI to see your customer analysis not just improve, but thrive.
Check out our Power BI development company and start a conversation about your journey to data-driven customer analysis today. Contact Us Today
Drive Success with Our Tech Expertise
Unlock the potential of your business with our range of tech solutions. From RPA to data analytics and AI/ML services, we offer tailored expertise to drive success. Explore innovation, optimize efficiency, and shape the future of your business. Connect with us today and take the first step towards transformative growth.
You might also like
Stay ahead in tech with Sunflower Lab’s curated blogs, sorted by technology type. From AI to Digital Products, explore cutting-edge developments in our insightful, categorized collection. Dive in and stay informed about the ever-evolving digital landscape with Sunflower Lab.