

HFC Network
Hourly Data Consumption of Popular Video Conferencing Applications

Building on our prior work, this investigation explores the hourly data consumption of popular video conferencing applications: Google Meet, GoToMeeting, Microsoft Teams and Zoom. As video conference applications have become an integral part of our daily lives, we wanted to not only better understand the bandwidth usage as previously explored, but also the total data consumption of these applications. This investigation provides a first step in better understanding that latter dimension. To avoid any appearance of endorsement of a particular conferencing application, we have not labeled the figures below with the specific apps under test. In short, we observed that a single user on a video conferencing application consumed roughly one gigabyte per hour, which compares to about three gigabytes per hour when streaming an HD movie or other video. However, we did observe substantial variance in video conferencing app hourly data consumption based on the specific app and end-user device.
Key Components of the Testing Environment
Much like our prior work on bandwidth usage, the test setup used typical settings and looked at both upstream and downstream data consumption from laptops connected to a cable broadband internet service. We used the same network equipment from November and our more recent blog post in February. This includes the same cable equipment as the previous blogs — the same DOCSIS 3.0 Technicolor TC8305c gateway, supporting eight downstream channels and four upstream channels, and the same CommScope E6000 cable modem termination system (CMTS). The cable network was configured to provide 50 Mbps downstream and five Mbps upstream broadband service, overprovisioned by 25 percent.
The data gathering scenario:
- 10 people, each on their individual laptops, participated in the conference under test
- One person on the broadband connection under test, using either a lower-cost or a higher-cost laptop. The other nine participants were not using the broadband connection under test.
- For the laptop under test, the participant used the video conferencing application for the laptop’s operating system, rather than using the video conferencing application through the web browser.
- Total data consumption was recorded for the laptop using the broadband connection under test.
For all 10 participants, cameras and microphones were on. Conference applications were set to "gallery mode" with thumbnails of each person filling the screen, no slides were presented and the video conference sessions just included people talking.
The laptop under test used a wired connection to the cable modem to ensure that no variables outside the control of the service provider would impact broadband performance. Most notably, by using a wired connection, we removed the variable of Wi-Fi performance from our test setup. During data collection, the conference app was the only app open on the laptop under test.
Video conferencing sessions were set up and data consumption was measured over time. We collected 10 minutes of data for each conferencing session under test to calculate the total consumption for one hour. The charts below show the data consumed for each of the 10 minutes of the conference session. During the conference there was movement and discussion to keep the video and audio streams active throughout the period of data collection.
For each test scenario, only one laptop was connected at a time to the broadband connection under test. Our goal was to measure the data consumption of one conferencing user on the broadband connection. The other conference participants were on the internet; they were not in the lab. Once again, we used TShark (a popular, widely used network protocol analyzer) to capture and measure the data.
For the laptop under test, we chose two that have quite different capabilities. The first was a low-cost laptop with an 11-inch screen, like the ones students are often provided by school districts for at-home learning. The second was a higher-cost laptop with a 15-inch screen, like what we often see in an enterprise environment. Note the two laptops not only have quite different hardware components (e.g., CPU, graphics processors, memory, cameras, screens), but also have different operating systems. Once again, to avoid any appearance of endorsement, we are not identifying the specific laptops used.
Analysis
Table 1 shows hourly bandwidth consumption (combining both upstream and downstream) for the laptop under test, normalized to Gigabytes per hour. The table provides the data consumption for the low-cost and higher-cost laptops in each scenario with the four conferencing applications.
Table 1: Video Conferencing App Hourly Bandwidth Consumption in Gigabytes for Each User (Gigabytes/hour)

The following figures show the data consumption, in Megabytes, for each minute of the 10-minute data collection for each of the permutations of our testing.
A few notes on the charts:
- There was only one client behind the cable modem.
- Each bar represents one minute of data consumption.
- Each bar shows total consumption and includes both the upstream and downstream, and both audio and video, added together.
- App A is blue in each chart; App B is green; App C orange; and App D is purple.
- These charts show real-time consumption measured in Megabytes per hour to illustrate consumption over time.
Figure 1 shows the data consumed when using the lower-cost laptop in the 10-person meetings.
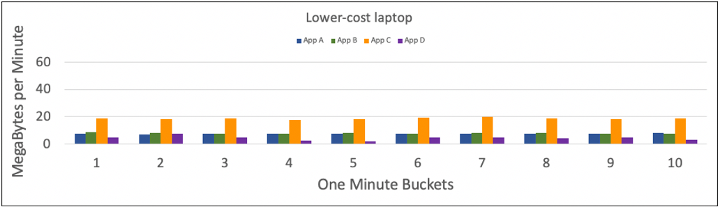
Figure 2 shows data consumed each minute for each of the four apps when using the higher-cost laptop was in the 10-person meetings.
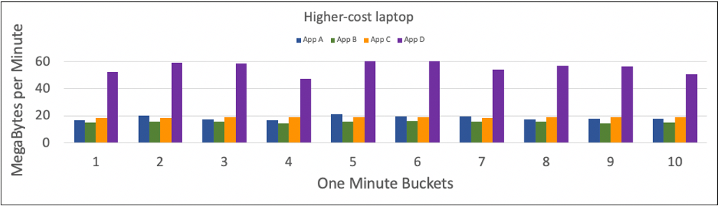
Figure 3 shows the data consumed each minute using App A and compares the two laptops used for data collection. For each minute, the bar to the left is the lower-cost laptop and the bar to the right is the higher-cost laptop.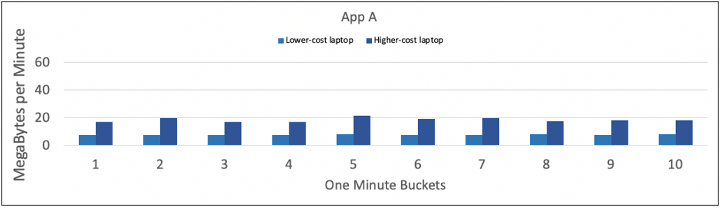
Figure 4 shows the data consumed each minute using App B and compares the two laptops. The bar to the left is the lower-cost laptop and the bar to the right is the higher-cost laptop.
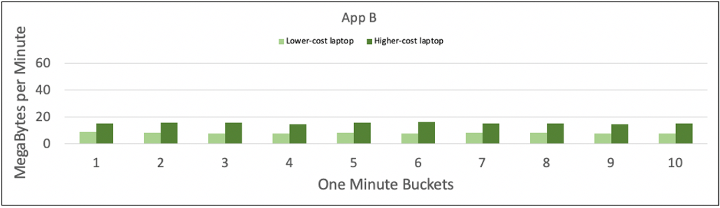
Figure 5 shows the data consumed each minute using App C and compares the two laptops. The bar to the left is the lower-cost laptop and the bar to the right is the higher-cost laptop.
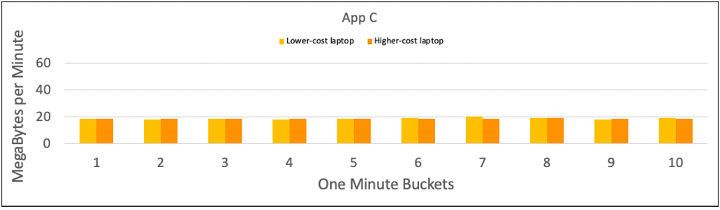
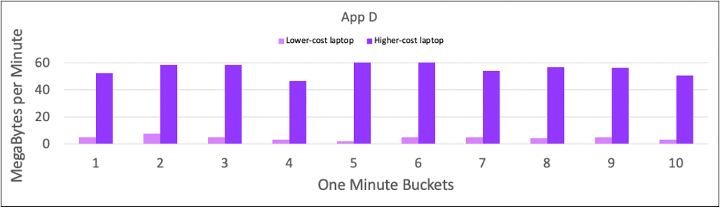
Figure 6 shows the data consumed each minute using App D and compares the two laptops. The bar to the left is the lower-cost laptop and the bar to the right is the higher-cost laptop.
Key Observations
A. Data Consumption Varies: The first takeaway is that different apps consume different amounts of bandwidth, as shown in Table 1, from 0.5 GBytes per hour up to 3.4 GBytes per hour, for video conferences using the different laptops, the same broadband connections, the same general setup (e.g., gallery view), the same people doing the same things on camera, etc.
-
- For a given app on a given laptop, data consumption was consistent over the 10-minute collection time.
- App D using the higher-cost laptop consumed the most bandwidth.
- With App D on the lower-cost laptop, there was video quality degradation. We confirmed the broadband connection was operating as expected and was not the cause of the video degradation. Rather, it appeared that the combination of the hardware and operating system of the lower-cost laptop was unable to meet the resource requirements of App D.
- App B consistently consumed less bandwidth regardless of scenario.
B. Comparing Laptops: In Table 1, the two columns of data show the differences between the lower-cost and higher-cost laptops for the data collections. On the lower-cost laptop, Apps A, B and C consume about the same amount of data on an hourly basis.
C. Comparing Laptops: The second column of data show that all apps on the higher-cost laptop consumed more bandwidth than the lower-cost laptop. This difference implies that when using the actual conferencing app (not a web browser), processing power available in the laptop may be a determining factor in consumption.
D. Comparing Apps: App C was the most consistent in data consumption regardless of the laptop used. The other conference applications noticeably consumed more on the higher-cost laptop.
In summary, we observed a more than 7X variation in the data consumption of video conferencing with a very limited exploration of just two variables – laptop and video conferencing application. Notably, however, when data consumption was at its highest, it was of the same magnitude as the data consumption of an HD video stream.
This is an area ripe for further research and study, both to more comprehensively explore these variables (e.g., other device types, larger meetings) and to explore other variables that may meaningfully influence data consumption.