

HFC Network
Bandwidth Usage of Popular Video Conferencing Applications on a 50/10 Mbps Service Tier

As we enter the new year, consumers, workplaces, and schools continue to rely on video conference applications. We previously studied Bandwidth Usage of Popular Video Conferencing Applications in November 2020 and February 2021. In May 2021, we studied Hourly Data Consumption of Popular Video Conferencing Applications. Today, we share a study of bandwidth usage on a 50Mbps/10Mbps Service Tier by popular video conferencing applications and how they perform with the addition of background traffic in the upstream.
This blog is a snapshot of the conference applications' bandwidth usage in December 2021.
The current testing used a 50 Mbps downstream and 10 Mbps upstream service tier, which doubles the upstream speed from the previous work with a 50/5 Mbps tier. With the faster upstream tier, this effort looks at both
- Bandwidth consumed for 10 concurrent conference sessions, and
- The behavior of 10 concurrent conference sessions in the presence of additional upstream traffic, specifically an upstream 5 Mbps UDP (user datagram protocol) flow.
Apple FaceTime, Google Meet, and Zoom were examined. When possible, we tested the available desktop version of each video conference application. To avoid any appearance of endorsement of a particular conferencing application, we do not label the figures below with the specific application under test. As described below, in the presence of the 5 Mbps UDP flow in the upstream the three applications behave similarly and without any negative impact to the video-conferencing application.
In addition to the video conferencing streams, we add a 5 Mbps UDP stream of upstream traffic in the background to illustrate the capability of a 10 Mbps upstream tier. Besides video conferencing applications, other popular activities that drive upstream usage are online gaming, Wi-Fi connected cameras, and file uploads. The additional 5 Mbps stream is meant to capture a wide range of common use cases. For example, concurrent use of one to two online gaming sessions (100 to 500 Kbps each), three to four Wi-Fi connected cameras (500 Kbps to 1 Mbps each), and a file upload of 2 Mbps (900 megabytes over an hour) would all fit within this 5 Mbps upstream budget. As we show below, even with this 5 Mbps traffic and 10 concurrent sessions of the video conferencing applications, there is still upstream bandwidth available for additional activity by a subscriber with a 50 Mbps/10 Mbps service tier.
The lab setup was modified from our previous testing. The ten laptops used during this testing were different than the previous blogs; this group of laptops consisted of five MacOS and five Windows 10 operating systems. The laptops were standard consumer grade laptops without any upgrades such as those commonly used by gamers.
What did not change is the same DOCSIS 3.0 Technicolor TC8305c gateway and same CommScope E6000 cable modem termination system (CMTS) from the previous testing were used during this testing. Additionally, like the previous testing, all the laptops used wired Ethernet connections through a switch to the gateway to ensure no variables outside the control of the broadband provider would impact the speeds delivered (e.g., all the variables associated with Wi-Fi performance). Throughout testing, we ensured there was active movement in view of each laptop’s camera to simulate real-world use cases more fully.
As in the previous blogs, this research does not consider the potential external factors that can affect Internet performance in a real home -- from the use of Wi-Fi, to building materials, to Wi-Fi interference, to the age and condition of the user’s connected devices -- but it does provide a helpful illustration of the baseline capabilities of a 50/10 Mbps broadband service.
As before, the broadband speeds were over-provisioned. For this testing, the 50/10 broadband service was over-provisioned by 25%, a typical cable operator configuration for this service tier.
To establish a baseline, we began by repeating the data collections from the three previous efforts and were able to confirm the results. In the seven months since our last testing, many of the application developers issued updates to the applications, thus we compared the current observations with past observations looking for consistency instead of identical results.
Conferencing Application A
Figure 1 shows total access network usage for the 10 concurrent sessions over 350 seconds while using App A. The blue line is the total downstream usage, and the orange line is total upstream usage. Note that even with a 10 Mbps upstream tier, the total upstream usage stays around 2.5 Mbps. The downstream usage stays, on average, around 18 Mbps, which leaves roughly 32 Mbps of downstream headroom for other services, such as streaming video, that can use the broadband connection at the same time.
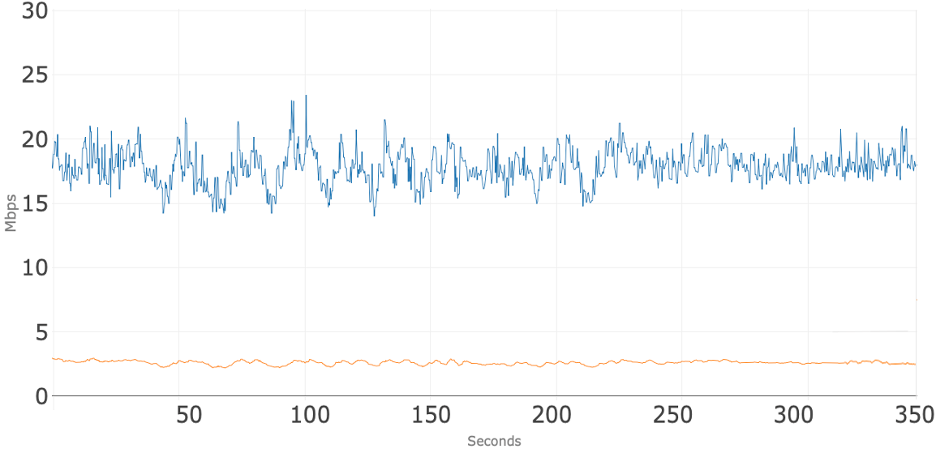
Figure 2 shows total access network usage for the 10 concurrent sessions and the addition of 5 Mbps of upstream traffic over 350 seconds while using App A. The blue line is the total downstream usage, and the orange line is total upstream usage. Note that before the upstream 5 Mbps was applied the total upstream usage was around 2.5 Mbps. At about 60 seconds, the additional 5 Mbps UDP stream was added to the upstream which causes the total to increase to about 7.5 Mbps. As shown in Figure 3, the addition of 5 Mbps of traffic causes no noticeable impact on the upstream conference flows. At about 320 seconds that 5 Mbps stream is removed, and the upstream usage goes immediately back to where it was before that stream was applied. During the entire test the downstream usage stays, on average, around 18 Mbps even when the additional upstream bandwidth is consumed.
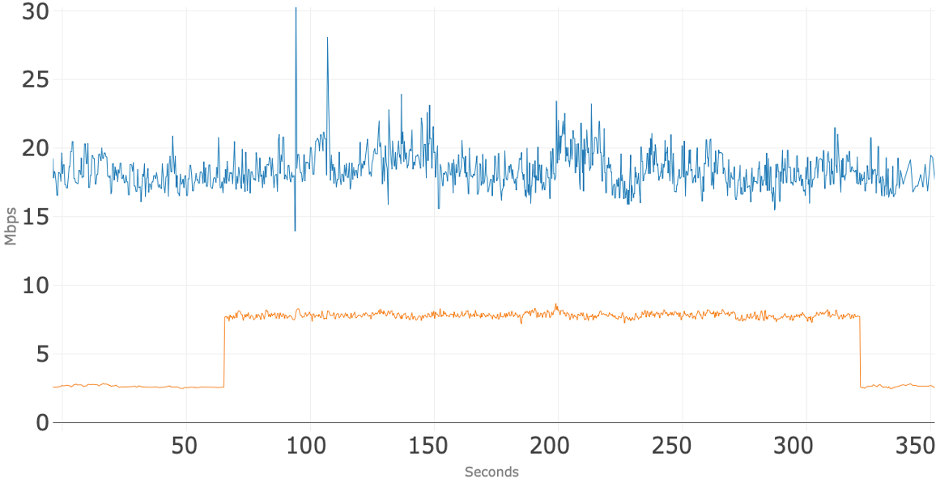
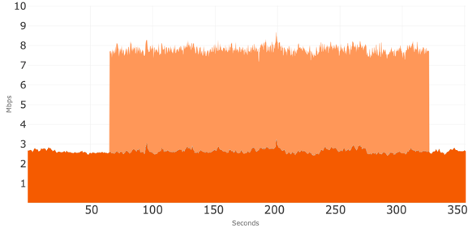
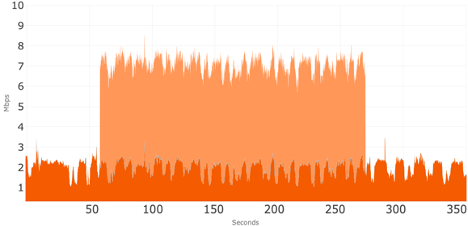
Figure 3 shows just upstream usage where the upstream traffic for the 10 concurrent sessions of App A is shown with dark orange, and the additional 5 Mbps of upstream traffic is shown in light orange. This view emphasizes that the additional 5 Mbps of upstream traffic does not appear to have an impact on the upstream bandwidth usage of the 10 concurrent video sessions of App A.
Conferencing Application B
Figure 4 shows total access network usage for the 10 concurrent sessions over 350 seconds while using App B. The blue line is the total downstream usage, and the orange line is total upstream usage. Note that even with a 10 Mbps upstream tier, the total upstream usage stays under 2.5 Mbps. The downstream usage stays, on average, around 13 Mbps, which leaves roughly 37 Mbps of downstream headroom for other services.
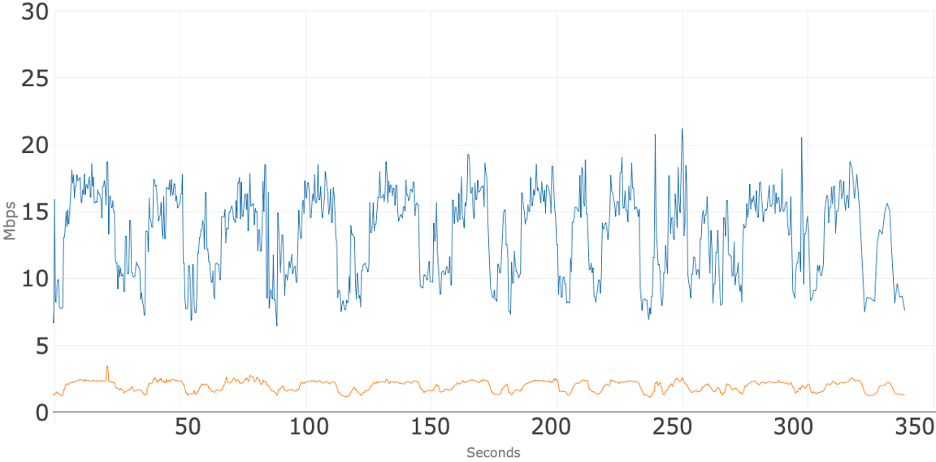
Figure 5 shows total access network usage for the 10 concurrent sessions and the addition of 5 Mbps of upstream traffic over 350 seconds while using App B. The blue line is the total downstream usage, and the orange line is total upstream usage. Note that before the upstream 5 Mbps was applied the total upstream usage was around 2.5 Mbps. At about 60 seconds, an additional 5 Mbps stream was added to the upstream which causes the total to increase to about 7 Mbps. As shown in Figure 6, the addition of the 5 Mbps of traffic causes no noticeable impact on the upstream conference flows. At about 270 seconds that 5 Mbps stream is removed, and the upstream usage goes immediately to where it was before that stream was applied. During the test the downstream usage stays, on average, around 13 Mbps even when the additional upstream bandwidth is consumed.
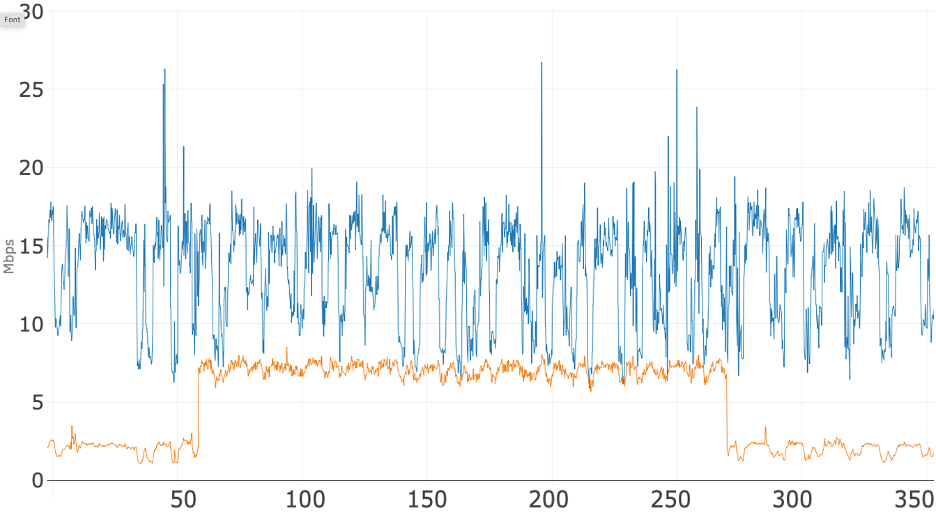
Figure 6 shows just upstream usage where the upstream traffic for the 10 concurrent sessions of App B is shown with dark orange, and the additional 5 Mbps of upstream traffic is shown in light orange. This view demonstrates that the additional 5 Mbps of upstream traffic does not appear to have an impact on data usage of the 10 concurrent video sessions of App B.
Conferencing Application C
Figure 7 shows total access network usage for the 10 concurrent sessions over 350 seconds while using App C. The blue line is the total downstream usage, and the orange line is total upstream usage. Note that even with a 10 Mbps upstream tier, the total upstream usage stays around 4 Mbps. The downstream usage stays, on average, around 10 Mbps, which leaves roughly 40 Mbps of downstream headroom for other services.
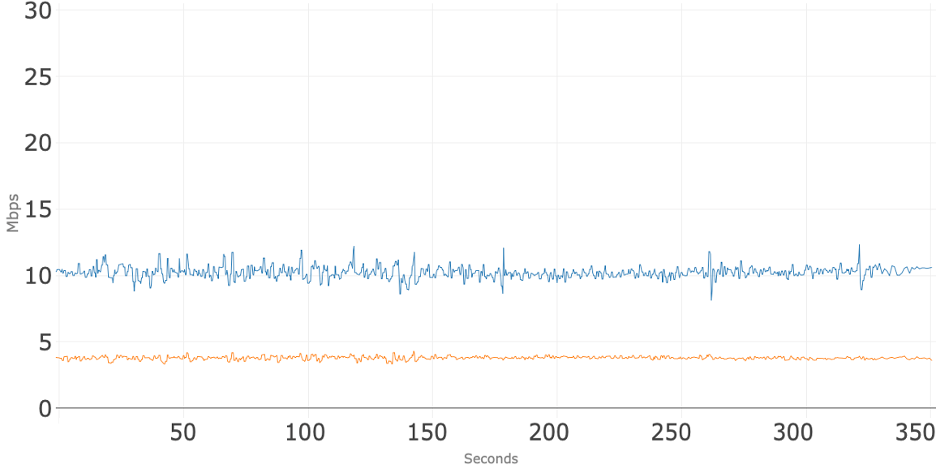
Figure 8 shows total access network usage for the 10 concurrent sessions and the addition of 5 Mbps of upstream traffic over 350 seconds while using App C. The blue line is the total downstream usage, and the orange line is total upstream usage. Note that before the upstream 5 Mbps was applied the total upstream usage was around 4 Mbps. At about 70 seconds, an additional 5 Mbps stream was added to the upstream which causes the total to increase to about 9 Mbps. As shown in Figure 9, the addition of the 5 Mbps of traffic causes no noticeable impact on the upstream conference flows. At about 260 seconds that 5 Mbps stream is removed, and the upstream usage goes immediately back to where it was before that stream was applied. During the entire test, the downstream usage stays, on average, around 10 Mbps even when the additional upstream bandwidth is consumed.
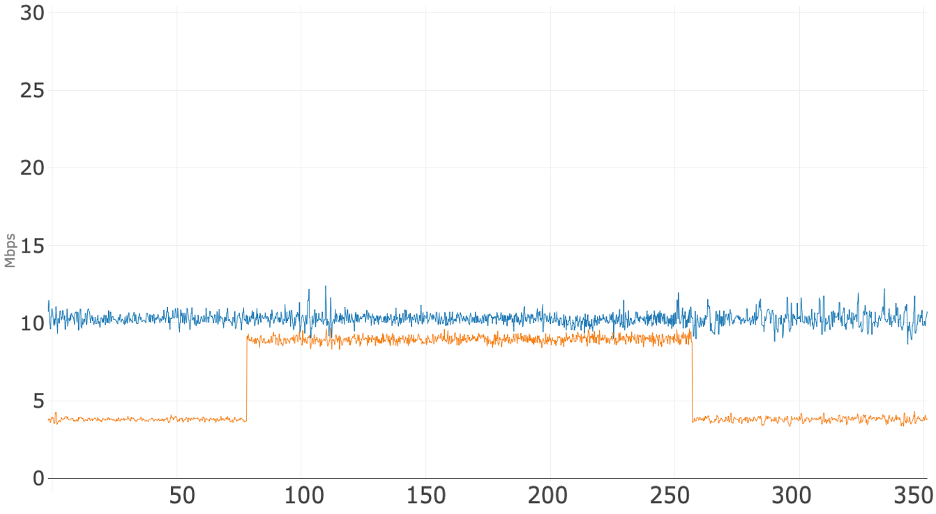
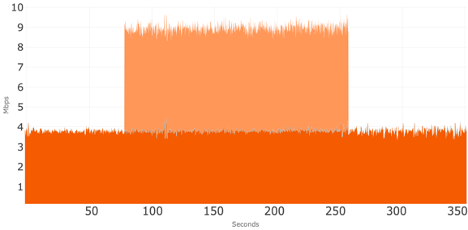
Figure 9 shows just upstream usage where the upstream traffic for the 10 concurrent sessions of App C is shown with dark orange, and the additional 5 Mbps of upstream traffic is shown in light orange. This view demonstrates that the additional 5 Mbps of upstream traffic does not appear to have an impact on the data usage of the 10 concurrent video sessions of App C.
Summary
This investigation looked at three popular video conferencing applications over an upstream tier of 10 Mbps and a downstream tier of 50 Mbps.
The three applications exhibited similar behavior of using under 4 Mbps of upstream during 10 concurrent conference sessions. When an additional 5 Mbps of upstream traffic was added, these three conference apps took it in stride; there were no noticeable changes to either the upstream or downstream consumption of the 10 concurrent conference sessions and no negative impact to the quality of the video conferencing sessions.
The successful testing of 10 concurrent video sessions plus 5 Mbps of additional background traffic illustrates the capability of a 50/10 service tier to support the broadband needs of telework, remote education, telehealth, and other use cases that rely heavily on video conferencing applications. The testing also illustrates that a 50/10 service tier can readily support a household with multiple users engaging on video conference platforms as well as support other simultaneous uses.