Power Pivot for Excel Tutorial: Top Use Cases and Examples
With the arrival and growing ubiquity of big data, Excel, as a data-mining and processing tool has been pushed to its limits—reflected in its dated 1,048,576 row hard limit and the application’s processing speed slowing to a crawl. As of 2010, Microsoft released a Power Pivot function that transformed the scope and usefulness of Excel where the extraction, combination, and analysis of large datasets are concerned.
Using live cases, Finance Expert Ellen Su explores in detail how to master Power Pivot and explores its hidden advantages as a big data tool.

Executive Summary
What Is Power Pivot?
- Introduced to Excel 2010 and 2013 as an add-on, but now native to the application, Power Pivot is part of Microsoft's business intelligence stack capable of (but not limited to) big data analytics work without specialty infrastructure or software.
- According to Microsoft, "Power Pivot enables you to import millions of rows of data from multiple data sources into a single Excel workbook, create relationships between heterogeneous data, create calculated columns and measures using formulas, build PivotTables and PivotCharts, and further analyze the data so that you can make timely business decisions without requiring IT assistance."
- Power Pivot was created in direct response to the big data demands of contemporary business intelligence needs, which prior generations of Excel—given their 1,048,576 row limit or processing speed shortcomings—struggled to cope with.
- Power Pivot is expressed by Microsoft using DAX (Data Analysis Expressions), which is a collection of functions, operators, and constants usable in a formula or expression to calculate/return one or more values.
What Are the Benefits to Power Pivot vs. Basic Excel?
- Power Pivot lets you import and manipulate hundreds of millions of rows of data whereas Excel has a hard constraint of just over a million rows.
- Power Pivot allows you to import data from multiple sources into one single source workbook without having to create multiple source sheets and deal with potential version control and transferability issues.
- Power Pivot lets you manipulate the imported data, analyze it, and draw conclusions without slowing down your computer system, as is typical of Basic Excel.
- Power Pivot lets you visualize and manipulate your big datasets with PivotCharts and Power BI, where basic Excel lacks these capabilities.
How Can a Finance Expert or Excel Consultant Help Your Business?
- By working alongside you as a thought partner to design, structure, build, and deliver a range of financial models, budgets, and big-data analyses/projects, all en route to decisions around captive projects, mergers and acquisitions, or strategic investments.
- By creating customized models unique to your business, using Power Pivot and other specialty excel functions.
- By also creating prefabricated, go-to templates that can be adapted uniquely by almost anyone across your organization, for almost any purpose, using Power Pivot and other specialty Excel functions.
- By training individuals or groups within your organization on everything from the basics of excel, modeling and analysis to advanced quantitative methods using Power Pivot, Power Pivot tables, Power Pivot charts, and PowerQuery.
- By actualizing each of these and more, alongside the design, creation, and delivery of a polished and professional PowerPoint presentation, ahead of strategic decisions.
Download the data set here to follow along with the tutorial.
The Emperor’s New Clothes: Excel Power Pivot Tutorial
Across the various fields and sub-sub-fields that span finance, financial analysis, financial markets, and financial investing, Microsoft Excel is king. With the arrival and exponential growth of big data, however, driven by decades of data aggregation and accumulation, the advent of cheap cloud storage and the rise of the internet of things—i.e., eCommerce, social media, and the interconnectedness of devices—Excel’s legacy functionality and capabilities have been pushed to their limits.
More specifically, older-generation Excel’s infrastructure and processing limitations such as its row-limit of 1,048,576 rows, or inevitable processing slow-down where large data sets, data tables and interconnected spreadsheets are concerned, reduced its usability as a effective big data tool. In 2010 however, Microsoft added a new dimension to Excel, called Power Pivot. Power Pivot offered next-generation business intelligence and business analytics functionality to Excel in its ability to extract, combine, and analyze almost limitless datasets without processing speed impairment. Despite its release eight years ago, however, most financial analysts still do not know how to use Excel Power Pivot, and many do not know it even exists.
In this article, I will show you how to use Power Pivot basics to overcome common Excel issues and take a look at additional key advantages of the software using some examples. This Power Pivot tutorial is meant to serve as a guide for what you can achieve with this tool, and at the end, it will explore some sample use-cases where Power Pivot often proves invaluable.
What Is Power Pivot and Why Is It Useful?
Power Pivot is a feature of Microsoft Excel that was introduced as an add-in to Excel 2010 and 2013, and is now a native feature for Excel 2016 and 365. As Microsoft explains, Power Pivot for Excel “enables you to import millions of rows of data from multiple data sources into a single Excel workbook, create relationships between heterogeneous data, create calculated columns and measures using formulas, build PivotTables and PivotCharts, and then further analyze the data so that you can make timely business decisions without requiring IT assistance.”
The primary expression language that Microsoft uses in Power Pivot is DAX (Data Analysis Expressions), although others can be used in specific situations. Again, as Microsoft explains, “DAX is a collection of functions, operators, and constants that can be used in a formula, or expression, to calculate and return one or more values. Stated more simply, DAX helps you create new information from data already in your model.” Fortunately for those already familiar with Excel, DAX formulas will look familiar, since many of the formulas have a similar syntax (e.g., SUM, AVERAGE, TRUNC).
For clarity, the key benefits of using Power Pivot vs. basic Excel can be summarized as the following:
- It lets you import and manipulate hundreds of millions of rows of data where Excel has a hard constraint of just over a million rows.
- It allows you to import data from multiple sources into one single source workbook without having to create multiple source sheets that suffer from version control and transferability issues.
- It lets you manipulate the imported data, analyze it, and draw conclusions without slowing down your computer to a snail’s pace.
- It lets you visualize the data with PivotCharts and Power BI.
In the following sections, I’ll run through each of the above and show you how Power Pivot for Excel can be helpful.
How to Use Power Pivot
1) Importing Large Datasets
As previously alluded to, one of the major limitations of Excel pertains to working with extremely large datasets. Fortunately for us, Excel can now load well over the one-million row limit directly into Power Pivot.
To demonstrate this, I generated a sample dataset of two years’ worth of sales for a sporting goods retailer with nine different product categories and four regions. The resulting dataset is two million rows.
Using the Data tab on the ribbon, I created a New Query from the CSV file (see Creating a New Query below). This functionality used to be called PowerQuery, but as of Excel 2016 and 365, was more tightly integrated into the Data tab of Excel.
From a blank workbook in Excel to loading all two million rows into Power Pivot, it took about one minute! Notice that I was able to perform some light data formatting by promoting the first row to become the column names. Over the past few years, the Power Query functionality has vastly improved from an Excel add-in to a tightly integrated part of the Data tab on the toolbar. Power Query can pivot, flatten, cleanse, and shape your data through its suite of options and its own language, M.
2) Importing Data from Multiple Sources
One of the other key benefits of Power Pivot for Excel is the ability to easily import data from multiple sources. Previously, many of us created multiple worksheets for our various data sources. Often, this process involved writing VBA code and copy/pasting from these disparate sources. Fortunately for us, though, Power Pivot allows you to import data from different data sources directly into Excel without having to run into the issues mentioned above.
Using the Query function in Exhibit 1, we can pull from any of the following sources:
- Microsoft Azure
- SQL Server
- Teradata
- Salesforce
- JSON files
- Excel workbooks
- …and many more
Further, multiple data sources can be combined either in the Query function or in the Power Pivot window to integrate data. For example, you can pull production-cost data from an Excel workbook and actual sales results from SQL server through the Query into Power Pivot. From there, you can combine the two datasets by matching production-batch numbers to produce per-unit gross margins.
3) Working with Large Datasets
Another key advantage of Power Pivot in Excel is the ability to manipulate and work with large datasets to draw relevant conclusions and analysis. I’ll run through a few common examples below to give you a sense of the power of the tool.
Measures
Excel junkies will no doubt agree that PivotTables are both one of the most useful, and at the same time, one of the most frustrating tasks we perform. Frustrating particularly when it comes to working with larger data sets. Fortunately, Power Pivot for Excel allows us to easily and quickly create PivotTables when working with larger sets of data.
In the image below, entitled Creating Measures, notice how the Power Pivot window is separated into two panes. The top pane has the data, and the bottom pane houses the measures. A measure is a calculation that is performed across the entire dataset. I have entered a measure by typing in the highlighted cell.
Total Sales:=SUM('Accounting Data'[Amount])
This creates a new measure that sums across the Amount column. Similarly, I can type another measure in the cell below
Average Sales:=AVERAGE('Accounting Data'[Amount])

From there, watch how quickly it is to create a familiar PivotTable on a large dataset.
Dimension Tables
As financial analysts using Excel, we become adept at using convoluted formulas to bend the technology to our will. We master VLOOKUP, SUMIF, and even the dreaded INDEX(MATCH()). However, by using Power Pivot, we can throw much of that out the window.
To demonstrate this functionality, I created a small reference table in which I assigned each Category to a Type. By choosing “Add to Data Model,” this table is loaded into Power Pivot (see Adding a User-created Table to a Power Pivot Model above).
I also created a date table to use with our dataset (see Creating a Date Table below). Power Pivot for Excel makes it easy to create a date table quickly in order to consolidate by months, quarters, and days of the week. The user can also create a more custom date table to analyze by weeks, fiscal years, or any organization-specific groupings.
Calculated Columns
Besides measures, there is another type of calculation: calculated columns. Excel users will be comfortable writing these formulas, as they are very similar to writing formulas in data tables. I have created a new calculated column below (see Creating a Calculated Column below) which sorts the Accounting Data table by Amount. Sales below $50 are labeled “Small,” and all others are labeled “Large.” Doesn’t the formula feel intuitive?
Relationships
We can then create a relationship between the Accounting Data table’s Category field and the Category table’s Category field using the Diagram View. Additionally, we can define a relationship between the Accounting Data table’s Sales Date field and the Calendar table’s Date field.
Now, without any SUMIF or VLOOKUP functions needed, we can create a PivotTable that calculated Total Sales by year, and type, with a slicer for Transaction Size.
Or, we can create a chart of Average Sales for each day of the week using the new Calendar table.
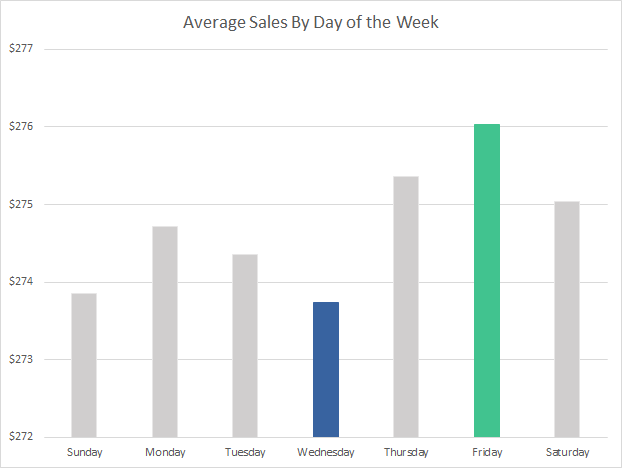
While this chart looks simple, it is impressive that it took less than ten seconds to create a consolidation over two million rows of data, without adding a new column to the sales data.
While being able to perform all these consolidated reporting scenarios, we can always still drill down into the individual line items. We retain our highly granular data.
Advanced Functions
So far, most of the analysis I have shown are relatively straightforward calculations. Now, I want to demonstrate the some of the more advanced capabilities of this platform.
Time Intelligence
Often, when we examine financial results, we want to compare it to a comparable timeframe from the previous year. Power Pivot has some built-in time intelligence functions.
Same Period Last Year Sales:=CALCULATE([Total Sales],SAMEPERIODLASTYEAR('Calendar'[Date]))

YOY Sales Growth:=if(not(ISBLANK([Same Period Last Year Sales])),([Total Sales]/[Same Period Last Year Sales])-1,BLANK())
For example, adding just two measures above to the Accounting Data table in Power Pivot enables me to produce the following PivotTable in a few clicks.

Mismatched Granularities
As a financial analyst, one problem I often have to solve is that of mismatched granularities. In our example, the actual sales data is shown to the category level, but let’s prepare a budget that is only on a seasonal level. To further this mismatch, we will prepare a quarterly budget, even through the sales data is daily.

With Power Pivot for Excel, this inconsistency is easily solved. By creating two additional reference tables, or dimension tables in database nomenclature, we can now create the appropriate relationships to analyze our actual sales against the budgeted amounts.
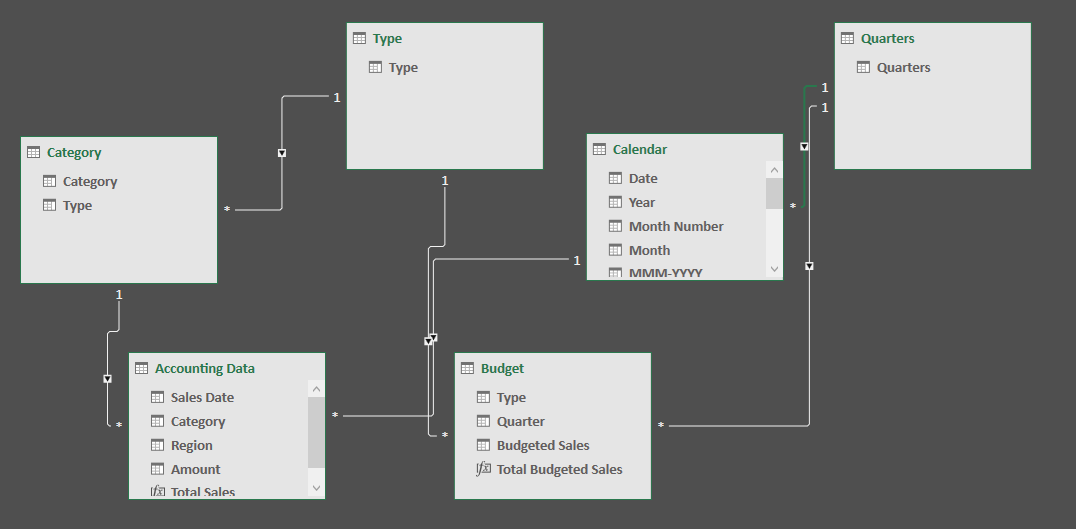
In Excel, the following PivotTable comes together quickly.

Further, we can define new measures that calculate the variance between actual sales and budgeted sales as below:
Actual-to-Budget Variance:=DIVIDE([Total Sales],[Total Budgeted Sales])-1
Using this measure, we can show the variance on a PivotTable.

Percent of Total
Finally, let’s examine sales in a particular category as a percent of all sales (e.g., category contribution to overall sales), and sales in a particular category as a percent of all sales of the same type (e.g., category contribution to seasonal-type sales). I created the two measures below:
Total Sales as Percent of All Sales:=[Total Sales]/CALCULATE([Total Sales],ALL('Accounting Data'))
Total Sales as Percent of Type:=[Total Sales]/CALCULATE([Total Sales],ALL('Accounting Data'[Category]))
Those measures can now be deployed in a new PivotTable:
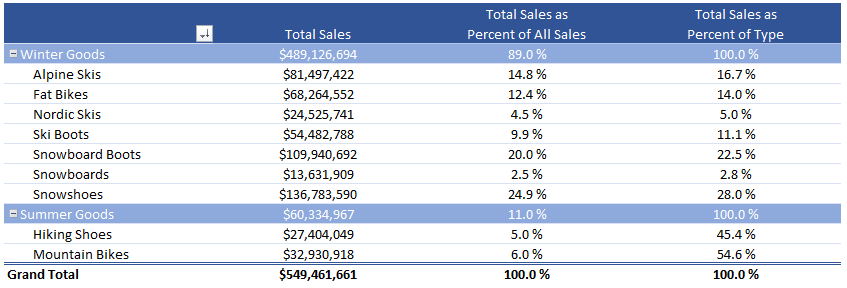
Notice how the calculations are performed at both the category and seasonal type level. I love how quickly and effortlessly these calculations are performed on such a large dataset. These are just a few examples of the elegance and sheer computational power of Power Pivot.
Compression
Another benefit is that file sizes shrink. The original file size was 91MB, and now it is under 4MB. That is a compression of 96% of the original file.

How does this happen? Power Pivot uses the xVelocity engine to compress the data. In simple terms, the data is stored in columns rather than rows. This storage method allows the computer to compress duplicate values. In our example dataset, there are only four regions that are repeated over all two million rows. Power Pivot for Excel can more efficiently store this data. The result is that for data that have many repeating values, it costs much less to store this data.
One thing to note is that I used whole-dollar amounts in this sample dataset. If I had included two decimal points to reflect cents, the compression effect would lessen to a still-impressive 80% of the original file size.
SSAS Tabular
Power Pivot models can also be scalable to the entire enterprise. Let’s say you build a Power Pivot model that starts gaining many users in the organization, or the data grows to ten million rows, or both. At this point, you may not want thirty different users refreshing the model or making changes. The model can be seamlessly converted into SSAS Tabular. All the tables and relationships are retained, but now you can control the refresh frequency, assign roles (e.g., read-only, read and process) to various users, and deploy only a small Excel front-end which links into the Tabular model. The result is that your users could then access the deployed Tabular model with a small workbook, but not have access to the formulas and measures.
4) Data Visualization and Analysis
CUBE Formulas
One of the constant requests of my clients is that I create reporting that conforms to a strictly defined layout. I have clients that request specific column widths, RGB color codes, and pre-defined font names and sizes. Consider the following dashboard:

How do we populate the sales numbers without generating PivotTables if all of our sales are housed with Power Pivot for Excel? Using CUBE formulas! We can write CUBE formulas within any Excel cell and it will perform the calculation using the Power Pivot model we have already constructed.
For example, the following formula is typed in the cell under “2016 Total Sales:”
=CUBEVALUE("ThisWorkbookDataModel","[Measures].[Total Sales]","[Calendar].[Year].[2016]")
The first part of the formula, highlighted in yellow, refers to the name of the Power Pivot model. In general, it is usually ThisWorkbookDataModel for newer versions of Power Pivot for Excel. The portion in green defines that we want to use the measure Total Sales. The part in blue instructs Excel to filter for only rows that have a Sales Date with a year equal to 2016.
Behind the scenes, Power Pivot has constructed an Online Analytical Processing (OLAP) cube with the data, calculated columns, and measures. This design allows the Excel user to then access the data by fetching directly with the CUBE functions. Using CUBE formulas, I have been able to construct full financial statements that conform to predefined layouts. This capability is one of the highlights of using Power Pivot for Excel for financial analysis.
Power BI
Another advantage of Power Pivot for Excel is that you can quickly take any Power Pivot workbook you build and quickly convert it into a Power BI model. By importing the Excel workbook directly into the Power BI Desktop app or Power BI Online, you can analyze, visualize, and share your data with anyone in your organization. Essentially, Power BI is Power Pivot, PowerQuery, and SharePoint all rolled into one. Below, I have created a dashboard by importing the previous Power Pivot for Excel workbook into the Power BI desktop application. Notice how interactive the interface is:
One great thing about Power BI is the Natural Language Q&A. To demonstrate, I uploaded the Power BI model onto my online Power BI account. From the website, I can ask questions and Power BI constructs the appropriate analysis as I type:
This type of query ability enables the user to ask questions of the data model and interact with the data in an easier way than in Excel.
Another benefit of Power BI is that the developers at Microsoft are constantly releasing updates to it. New features, many user-requested, are pushed out monthly. Best of all, it is a seamless transition from Power Pivot for Excel. So, the time you invested learning the DAX formulas can be deployed in Power BI! For the analyst who needs to share his analysis to many users on varying devices, Power BI may be worth exploring.
Best Practices
Once you get started, there are a few best practices that you should follow.
The first is to thoughtfully decide what to import in the first place. Will you ever use the salesperson’s home address? Do I need to know my customer’s email address in the context of this workbook? If the goal is to aggregate the data into a dashboard, then some of the data that is available will not be necessary for those calculations. Spending time curating the data coming in will greatly alleviate issues and memory-usage later when your dataset expands.
Another best practice is to remember that Power Pivot is not Excel. In Excel, we are accustomed to creating calculations by constantly expanding our worksheets to the right. Power Pivot for Excel most efficiently processes the data if we limit this desire for manifest destiny. Instead of continuously creating calculated columns to the right of your data, learn to write measures in the bottom pane. This habit will ensure smaller file sizes and quicker computations.
Finally, I would suggest using plain-English names for measures. This one took me a long time to adopt. I spent the first few years making up names like SumExpPctTotal, but once other people began to use the same workbooks, I had a lot of explaining to do. Now, when I start a new workbook, I use measure names like Expense Line Item as Percent of Total Expenses. While the name is longer, it is much easier for someone else to use.
Real-World Use Cases
In this article I have presented only a handful of the ways in which Power Pivot for Excel allows you to take an important step beyond plain-vanilla Excel. I thought it would be useful to highlight some real-world use cases in which I’ve found Power Pivot for Excel is extremely useful.
Here are some:
- Analyze performance of a large portfolio of assets over varying time ranges: Since Power Pivot for Excel allows us to define measures that compare a time-period with a previous one, we can quickly have quarter-over-quarter, year-over-year, and month-over-month performance all on a rolling basis by writing only a few measures.
- Summarize accounting data using customized aggregation levels: By identifying each general-ledger line item by name, category, and financial statement, reports can quickly be created that include the appropriate line items.
- Chains can identify same-store sales: Using a table that maps when stores come online, financial results can be compared on a same-store basis.
- Pinpoint over- and under-performers in sales: PivotTables can be created that highlight the top five SKUs and bottom five SKUs by sales, gross margins, production timeframes, etc.
- Retailers can define calendar tables that use a 4-4-5 configuration: Using a custom date table, a retailer can assign each day to a specific 4-4-5 month easily, then daily sales results can be rolled into the corresponding month.
From Clunky Spreadsheets to Modern Workbooks
As financial analysts, we are required to perform complex calculations on ever-expanding datasets. Since Excel is already the default analytical tool, the Power Pivot learning curve is easy, and many of the functions mirror Excel’s native functions.
With the use of CUBE functions, Power Pivot for Excel seamlessly blends into your existing Excel workbooks. The computational efficiency gain cannot be overlooked. Assuming a 20% faster processing speed, which is conservative, the financial analyst that spends six hours a day within Excel can save 300 hours a year!
Additionally, we can now analyze datasets that are much larger than we could previously with our traditional Excel. With models designed efficiently, we can easily have 10x the amount of data that we previously were allowed in traditional Excel, while maintaining quick analytical agility. With the ability to convert the models from Power Pivot to SSAS Tabular, the amount of data that can be processed is 100–1,000 times what we can achieve in Excel.
Power Pivot for Excel’s ability to perform lightning-fast calculations on large amounts of data and still retain the ability to dive into the details can transform financial analysis from clunky spreadsheets to modern workbooks.
If you’re interested in trying Power Pivot for Excel out, below are some useful materials to get you started.
Useful References and Guides
Collie, R., & Singh, A. (2016). Power Pivot and Power BI: The Excel user’s guide to DAX, Power Query, Power BI & Power Pivot in Excel 2010-2016. United States: Holy Macro! Books.
Ferrari, A., & Russo, M. (2015). The definitive guide to DAX: Business intelligence with Microsoft Excel, SQL Server Analysis Services, and Power BI. United States: Microsoft Press, USA.
Further Reading on the Toptal Blog:
Understanding the basics
What is a Power Pivot table?
When you’re looking at Power Pivot vs. Pivot tables, Power Pivot is an Excel feature that enables the import, manipulation, and analysis of big data without loss of speed/functionality. Power Pivot tables are pivot tables that that allow the user to mix data from different tables, affording them powerful filter chaining when working on multiple tables.
How do I create a Power Pivot table?
First, import your dataset into your Power Pivot workbook. Next, in the Power Pivot window on the Power Pivot Home tab, click PivotTable. Next, select “New Worksheet” (Excel will add an empty PivotTable). Then, select the empty PivotTable and follow the instructions detailed there.
How do I create a Power Pivot chart?
First, import your dataset into your Power Pivot workbook. Next create a Power Pivot table. Then, on the Power Pivot tab, click the arrow below PivotTable and select PivotChart. Select “Existing Worksheet” and click “OK.” Excel will add an empty PivotChart to the same worksheet. Follow the instructions there.
Ellen Su
Park City, UT, United States
Member since September 20, 2016
About the author
Ellen’s extensive experience in fixed income trading and portfolio management make her an unparalleled expert in analytics and modeling.
Expertise
PREVIOUSLY AT
