What Is a Telemetry Pipeline?
By Mike Terhar | Last modified on June 1, 2023In a simple deployment, an application will emit spans, metrics, and logs which will be sent to api.honeycomb.io and show up in charts. This works for small projects and organizations that do not control outbound access from their servers. If your organization has more components, network rules, or requires tail-based sampling, you’ll need to create a telemetry pipeline.
Telemetry pipelines have many benefits:
- Offload configurations from applications
- Reduce network traffic with batching
- Add context to spans from nodes and clusters
- Redaction and attribute filters
- Tail-based sampling
OpenTelemetry flexibility
OpenTelemetry exposes a set of incredibly flexible options for where to send data. With the same code, you can send directly to Honeycomb, to another OpenTelemetry backend like Jaeger, or to both. For more flexibility and power, send to an OpenTelemetry Collector.
As soon as you add the Collector, you’re into telemetry pipeline territory! Keep reading for options, tradeoffs, and best practices.
Best practices for telemetry pipelines
With an infinite number of ways to serially connect these together, we want to provide some pointers to achieve the optimal setup.
The best practice for security purposes is to use a Gateway Collector so production systems don’t need to communicate externally.
The best practice for data volume management is to use a tail-based sampler.
The overriding best practice, however, is to have as few stops along the way as possible. Each one adds latency and a risk of an outage if that node in the graph fails. Choose the minimal topology that meets all of your needs.
Telemetry pipeline topologies
Thanks to OpenTelemetry’s Receiver/Exporter pattern, there is a nearly unlimited number of shapes that a telemetry pipeline can take. We’re going to step through a subset of some commonly-seen topologies and explain the benefits and drawbacks at each stage. We've ordered these from simplest to most complex.
Simple and direct
The most basic connection is where an application sends its trace data directly to Honeycomb.
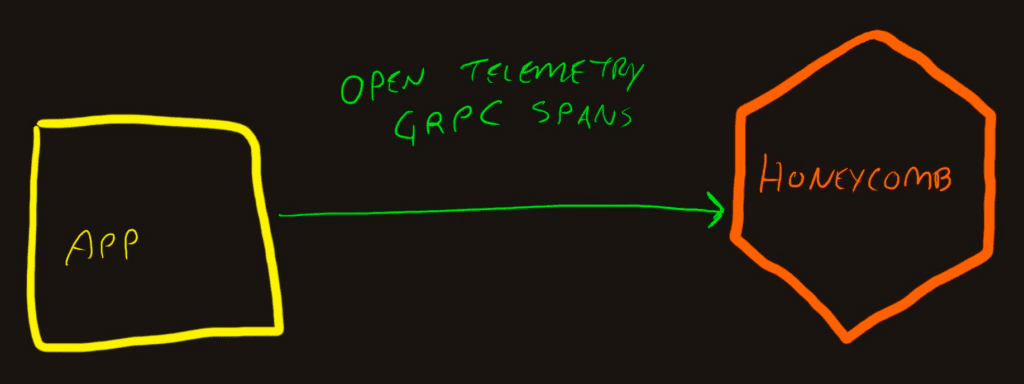
To get this configuration, all you need to do is configure the application to emit spans and use the api.honeycomb.io as the OpenTelemetry endpoint.
Benefits
- Simplicity
- Low overhead
Drawbacks
- All context needs to be available within the application
- Direct access to the internet from production
- Single service isn’t ideal
The problem is that traces become valuable when they span system boundaries and show how the interconnections and dependencies are working.
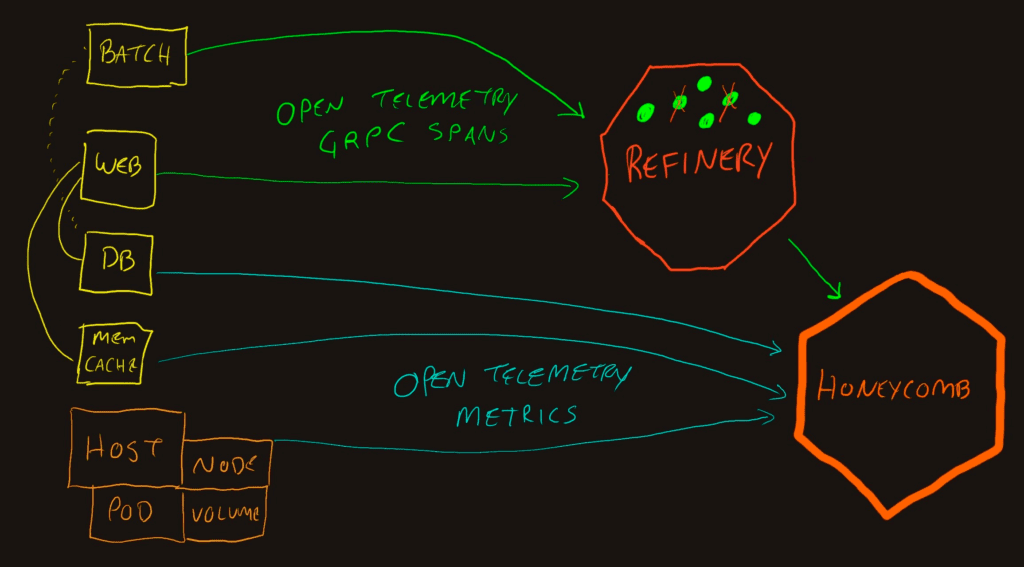
Multiple services emitting data
Expanding the “App” side into the components shows that different components will send data.
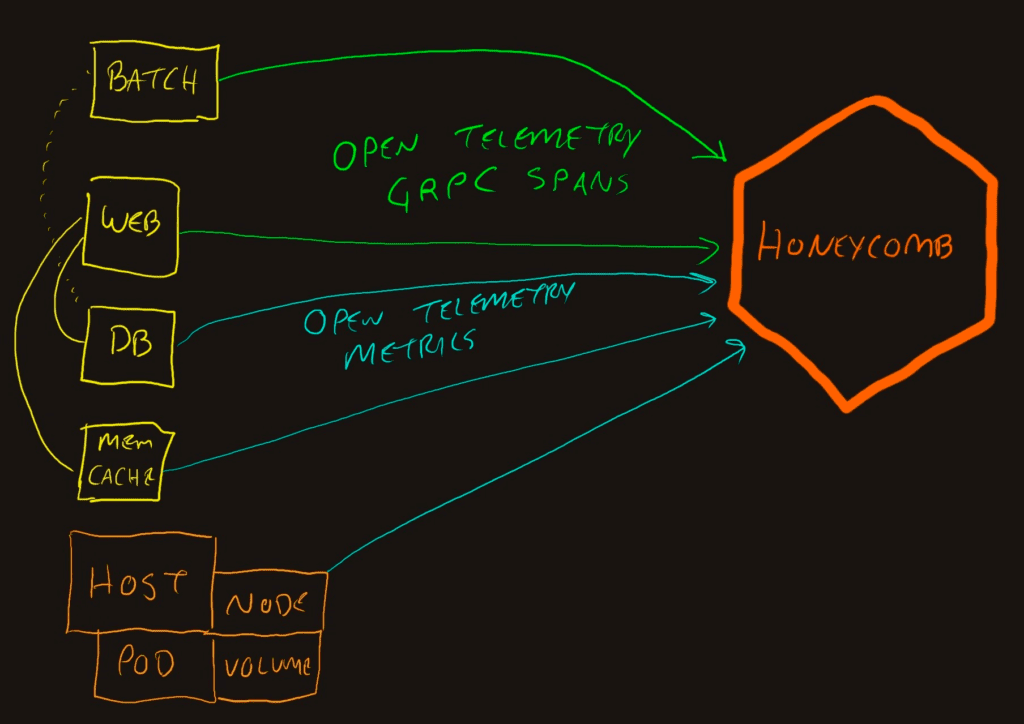
This also adds the blue lines, which denote metrics data. The metrics are periodically emitted from applications that don’t contribute to traces, such as a database. They also come from the underlying infrastructure such as pod, node, and cluster information in Kubernetes.
We can configure them to export the OpenTelemetry signals directly to Honeycomb. This assumes that your servers and application containers can reach out directly to the internet from their cloud or datacenter networks. However, that’s not always true, especially in larger systems.
Benefits
- Service boundary transitions are measured
- Infrastructure issues can correlate with trace performance
- Still fairly simple and low overhead
Drawbacks
- A lot of service configurations to coordinate (e.g., API key rotations)
- Direct internet access from production app and infrastructure
At this point, we achieve the maximum quality in terms of Honeycomb user experience. The below listed topologies are designed to work around network egress rules and operate more efficiently or economically.
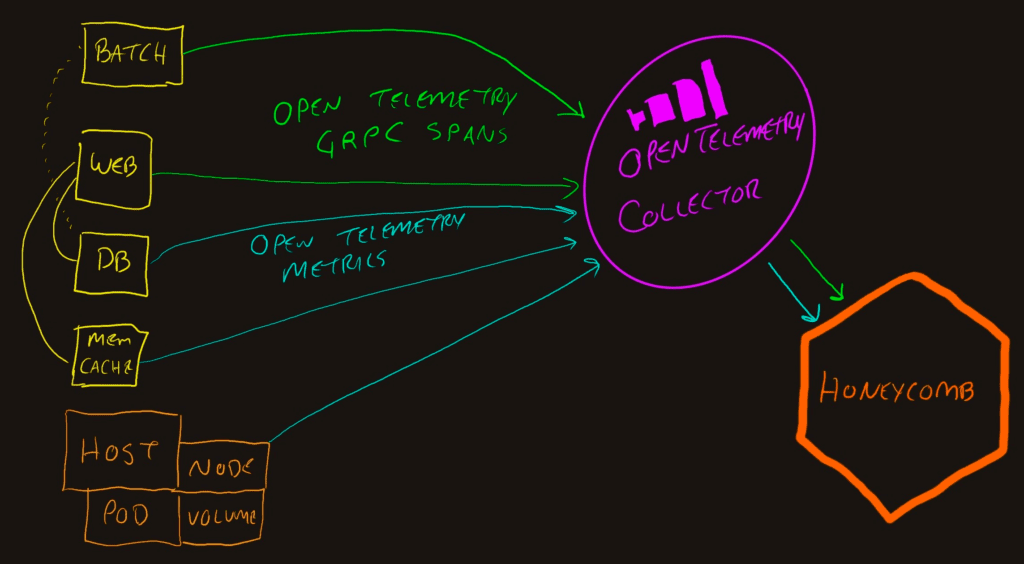
OpenTelemetry Collector
The addition of an OpenTelemetry Collector to the pipeline opens up new opportunities. Most importantly, it centralizes the telemetry connections to allow a single egress point from the network to Honeycomb which makes security teams much happier.
Additionally, the OpenTelemetry collector can do stuff to the data that is passing through it. The “do stuff” part of the Collector is called “processors.”
There are unlimited things that can be done with processors, since there is an API that allows anybody to create new processors and compile them into their Collectors. Default processors include some for stability and efficiency, like Batch and Memory Limiter. Commonly used processors include adding or removing attributes, transforming data, and routing based attributes.
How the data is received, processed, and exported is flexibly configured by creating pipelines in the configuration.
Due to the flexibility of deployment, the next three subsections talk about each deployment location. For consistency sake, I use the Kubernetes terminology—but these are just containers and can apply to other orchestration systems.
OpenTelemetry Collector as a Gateway
This is the as-drawn deployment pattern where all the apps and hosts send traffic to a single Collector.
Benefits
- Collector can add attributes related to cloud/host/network
- Less application configuration
- Centralized telemetry configuration
- Offload telemetry quickly to reduce CPU and memory impact of telemetry
- Single point of egress to Honeycomb
- Filtering and data-loss-prevention chokepoint for better compliance
Drawbacks
- Must host additional service
- Single point of failure for all telemetry
- Sampling in the Collector is new (increased risk)
The Collector has sampling capabilities but as of this date, there are significant limitations and drawbacks to using this capability. If you’re reading this in the future, check the docs for the samplers before deciding whether to use it or not.
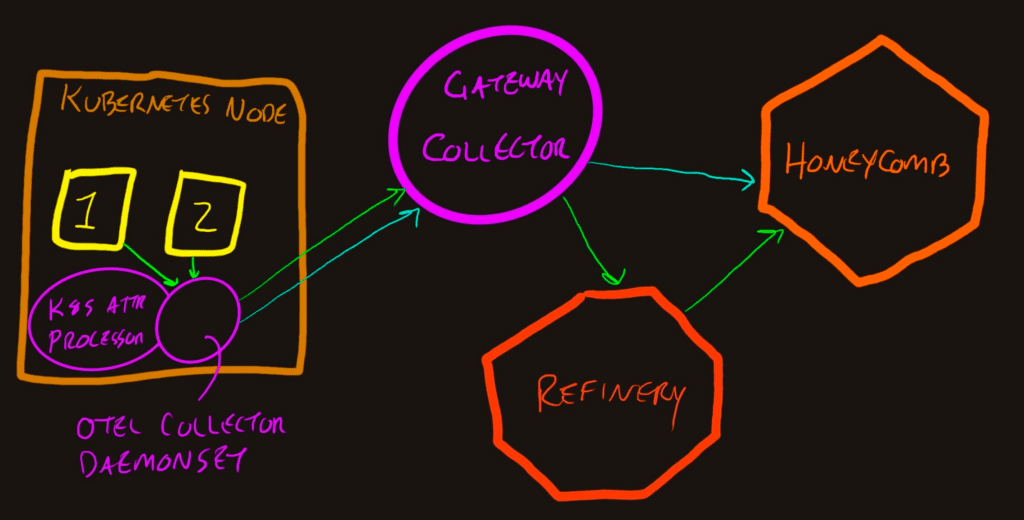
OpenTelemetry Collector as a DaemonSet
In Kubernetes, a DaemonSet is a container that runs on every node in the cluster. These are commonly used for virtual network, service mesh, storage controllers, and other infrastructure-layer containers. The Collector can run this way, and creates a nice centralization point for all of the other pods within a node to send their spans and metrics.
Benefits
- Each application is configured to export to a localhost-type Collector
- The Kubernetes Attribute Processor can add helpful context to each span
- Batches efficiently bundle multiple containers’ traffic to send across the network
- The Collector itself can emit metrics about the node’s health, including container and volume information
- The Collectors are centrally managed by the DaemonSet spec or OpenTelemetry Operator
Drawbacks
- Since the node has a physical boundary, the Collector could contribute to a “noisy neighbor” situation
OpenTelemetry Collector as a sidecar container
In Kubernetes, pods can have sidecars (other containers that run in the same boundary) built into the pod specification or injected by an Operator. The biggest drawback of this pattern is that the pod needs to live within a single node. This means that a sidecar can’t help with load shedding and may turn into a “noisy neighbor” for the application that it’s supposed to help.
Benefits
- Less configuration in the application
- The OpenTelemetry Kubernetes Operator can manage a lot of sidecar injections consistently
Drawbacks
- Sidecars run within the same node as the application containers
- They add memory and compute overhead
- A DaemonSet Collector would have more additional context than the sidecar and should be preferred
Sampling with Refinery
Tail-based sampling allows intelligent decisions to be made about whether a trace is valuable, and keep or drop it as a whole. This is difficult for trace spans because they are emitted asynchronously. Any span later, lower, or higher in the tree could be an error or have exceptionally long duration.
To address this, Honeycomb created a Sampling Proxy called Refinery which is open source, hosted on GitHub. We created it before OpenTelemetry existed, so the maturity of the tool means it can handle a lot of traffic and has been run with production loads by many companies for years.
There’s a lot of flexibility in deploying Refinery and how it handles data. The octagon above can represent a single instance or massive cluster of Refinery nodes. The important parts for this context (plumbing telemetry from various sources to Honeycomb) is that it receives GRPC or HTTP OTel-flavored data and emits Honeycomb-flavored data. This means it needs to be the last step on the pipeline. Upstream of it is always Honeycomb (or a proxy server).
In the diagram, you can see it inhabiting the same placement as the Collector. Apps deliver OpenTelemetry trace data to Refinery, and Refinery buffers the spans for a bit. After a decision is made as to keeping or dropping a trace, the spans for that trace are delivered or deleted. Metric signals do not get sampled this way, so they need to be sent directly to Honeycomb.
Benefits
- Reduce Honeycomb cost
- Reduce network egress cost
- Reduce network egress load
- Single point of egress for trace data
Drawbacks
- Multiple points of egress if metrics data is sent
- Cost to host Refinery
- Cost to manage Refinery cluster (keep an eye on resources during traffic spikes)
- Ongoing maintenance of sampling rules as applications and telemetry change over time
- Apps need to contain the telemetry configurations to split traces from spans
You’ll notice that there isn’t a lot of overlap in the benefits of running a Collector and running Refinery. We may need to chain them together to optimize the telemetry pipeline. Before we talk about that, let’s take a detour to see what burdens we’re adding to realize these capabilities.
More nodes, more problems
If you add Refinery to your telemetry pipeline, you’re taking on the burden of administering it. The benefits of reducing the amount of data sent out of your network and processed by Honeycomb should offset this. There’s an exchange of (cost to run cluster + time to keep health) / (cloud and honeycomb costs) to see if it’s worth doing.
As you add Collectors to your telemetry pipeline, be sure they add unique value that wouldn’t be possible elsewhere.
With that fresh warning, let’s take a look at the benefits of a more robust pipeline.
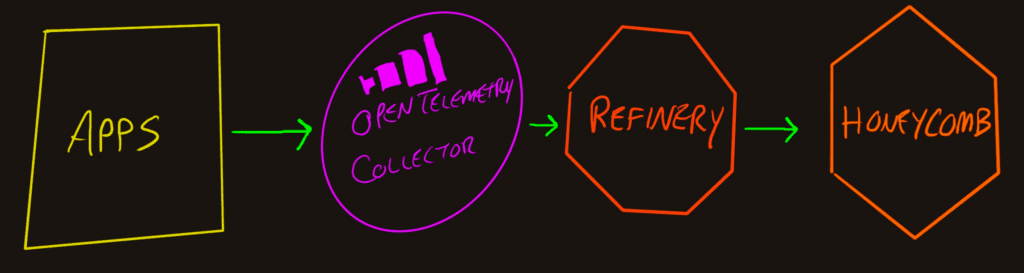
Collector to Refinery
When you want access to the benefits of both the Collector and Refinery, this configuration is where you’ll likely end up.
You’ll see there are two sets of purple, since the OpenTelemetry Collector can run as a Kubernetes DaemonSet and also as a Gateway. This pattern allows each layer in the infrastructure to decorate spans with the relevant context.
You’ll notice the metrics data in the diagram goes directly to Honeycomb from the Gateway Collector. Refinery can only handle trace data (spans, span links, and span events).
Benefits
- Two network egress points
- Increase contextualization with the Kubernetes attributes processor
- Gateway Collector can also add datacenter, network segment, or cloud attributes
- Gateway Collector can function as data loss, attribute filter, etc.
- Refinery can sample the trace data intelligently to retain trace integrity, delays, and errors
- Apps get to offload the telemetry quickly
- Collectors can manage a lot of the telemetry configuration
Drawbacks
- It’s a lot of stuff to run
- More points of failure and configuration mistakes
- Refinery needs to be scoped to the entirety of a trace
The last drawback above (about trace scope) is about ensuring that all systems that participate in a trace deliver their spans to the same Refinery instance. More in this in the next section.
Multicloud or hybrid datacenter/cloud topology
A Refinery cluster ensures this by using Trace ID keyspace shards to keep the traces local to a specific node. If you’re running multicloud or hybrid datacenter/cloud, there may be times when a service in one place communicates with a service in another place. If you try to run multiple Refinery clusters to sample data before it leaves the cloud or datacenter, traces will be incoherent. How do we solve this?
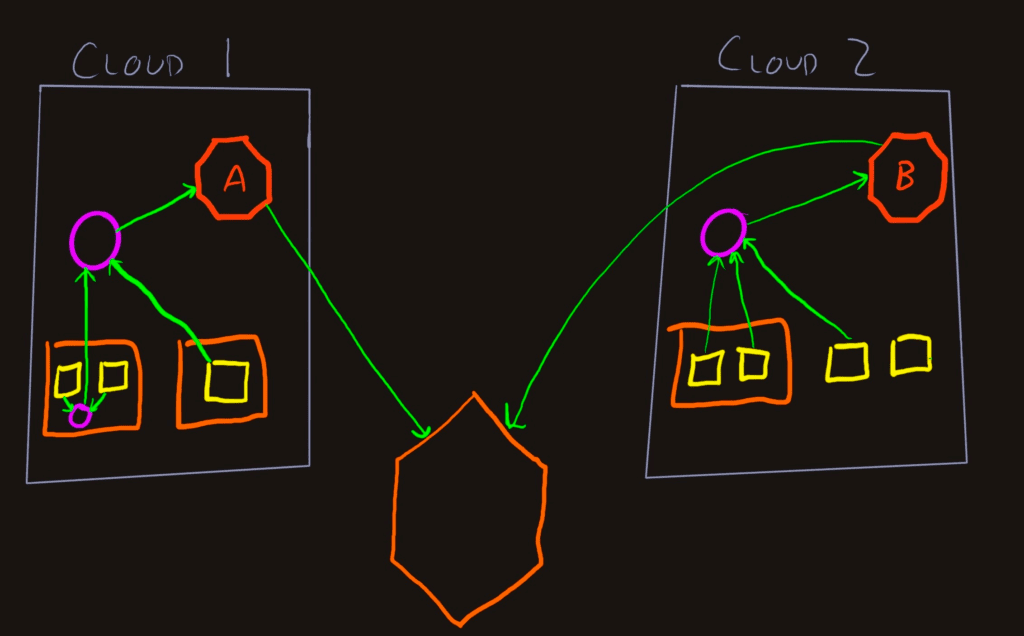
In this diagram, the shapes have been simplified a bit, but we have two cloud networks (or regions or providers) that emit telemetry to Honeycomb. In this case, everything is okay because the services (yellow squares) in Cloud 1 are not talking to any services in Cloud 2. Refinery A gets all the spans for each traces in that datacenter, samples, and delivers to Honeycomb. Same goes for Cloud 2 through Refinery B.
What if that rightmost app in Cloud 2 is called by Cloud 1 apps for some requests?
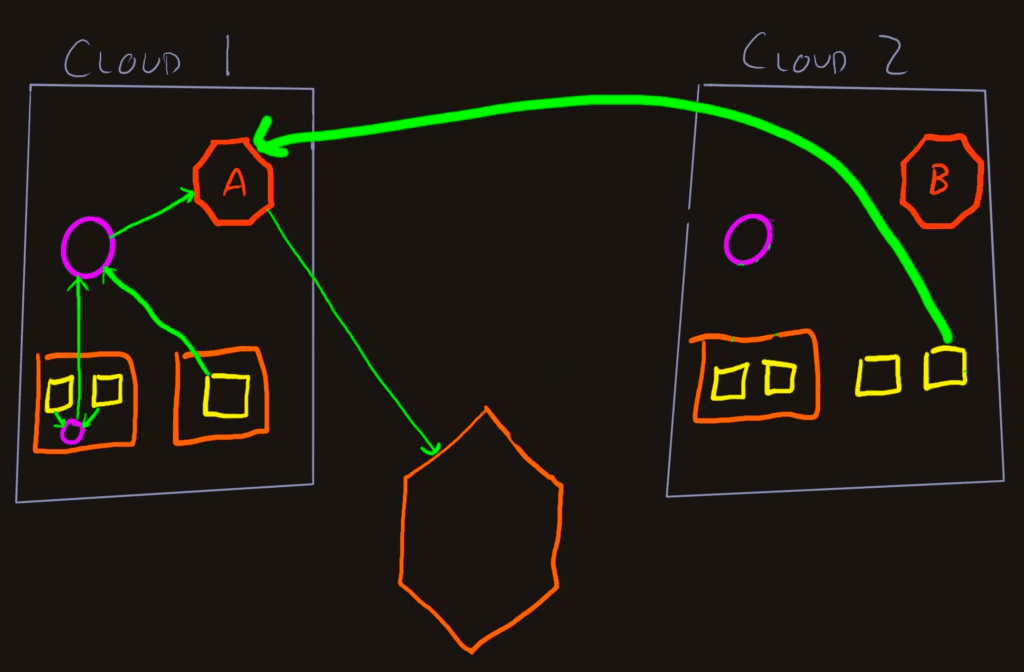
The simplest way to keep the traces coherent is to send the telemetry from that Cloud 2 service directly to the Refinery A cluster. If the Gateway Collector in Cloud 2 adds useful context, create a separate Pipeline and Exporter in the same Collector that delivers the spans (plus extra attributes) to Refinery A. There will be some cross-cloud traffic, but not as much, as if everything from all the apps traversed the cloud barrier.
Benefits
- Reduce cloud bill with less cross-zone/egress network traffic
- Maintain trace coherence
- Preserve cost savings of running Refinery
- Imbue spans with helpful context
- Control delivery of telemetry data at a few central points
- Take advantage of Lambdas and other cloud-specific offerings that can be tough to inspect
Drawbacks
- It’s even more stuff to set up and keep running
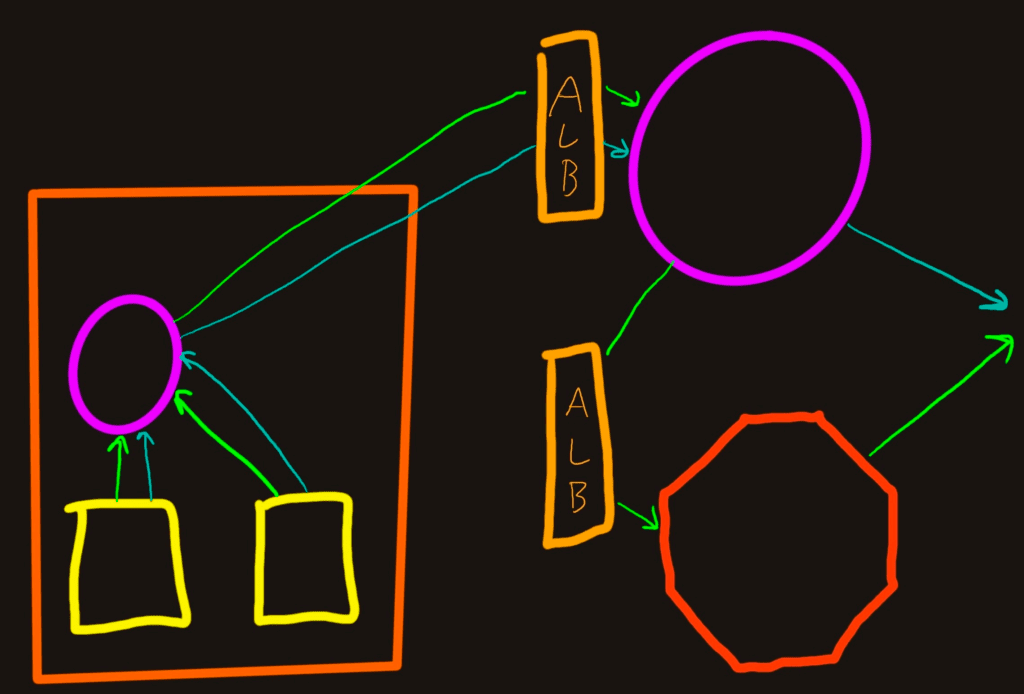
Add load balancers everywhere
The last increment we’ll cover is the case where you run everything in Kubernetes in a cloud so all of the ingresses that allow traffic into the Collectors and Refinery clusters are behind load balancers. We use Amazon’s Application Load Balancer (ALB), but it's similar with other load balancing technology.
Benefits
- ALBs ensure services are healthy and fail over as needed
- A lot easier to run TLS protected endpoints
Drawbacks
- ALBs can detach from Target Groups, which makes troubleshooting difficult
- TLS-protected endpoints add a bit of complexity to the Collector configurations
- Refinery is still going to pass traffic based on the Trace ID shards, so it won’t reduce peer network traffic. ALBs can’t make a routing decision based on TraceIDs (yet)
Conclusion
As you can see from the variety of approaches above, there should be a pattern that will work well for your team and your organization.
The overall recommendation is to keep it as simple as you can since your time is valuable. You should evaluate any increment of increased complexity to determine if the additional value is justified. We want you to avoid bad experiences caused by over-engineered telemetry pipelines. We also want you to confidently increase the complexity where beneficial.
If you have another pattern that you want to see explored, please join us in our Pollinators Slack for the discussion. And as always, sign up for Honeycomb today.
Related Posts
Understanding OpenTelemetry’s Browser Instrumentation
Recently, Honeycomb released a Web Instrumentation package built around the OpenTelemetry browser JS packages. In this post, I’ll go over what the OpenTelemetry auto-instrumentation package...
Introducing Honeycomb for Frontend Observability: Get the Data You Need for Actionable Customer Experience Improvements
Honeycomb for Frontend Observability gives frontend developers the ability to quickly identify opportunities for optimization within their web app. This starts with better OpenTelemetry instrumentation,...
Introducing Relational Fields
Expanded fields allow you to more easily find interesting traces and learn about the spans within them, saving time for debugging and enabling more curiosity...