

Cloudera DataFlow for the Public Cloud (CDF-PC) is a complete self-service streaming data capture and movement platform based on Apache NiFi. It allows developers to interactively design data flows in a drag and drop designer, which can be deployed as continuously running, auto-scaling flow deployments or event-driven serverless functions. CDF-PC comes with a monitoring dashboard out of the box for data flow health and performance monitoring. Key performance indicators (KPIs) and associated alerts help customers monitor what matters for their use cases.
Many organizations have invested in central monitoring and observability tools such as Prometheus and Grafana and are looking for ways to integrate key data flow metrics into their existing architecture.
In this blog we will dive into how CDF-PC’s support for NiFi reporting tasks can be used to monitor key metrics in Prometheus and Grafana.
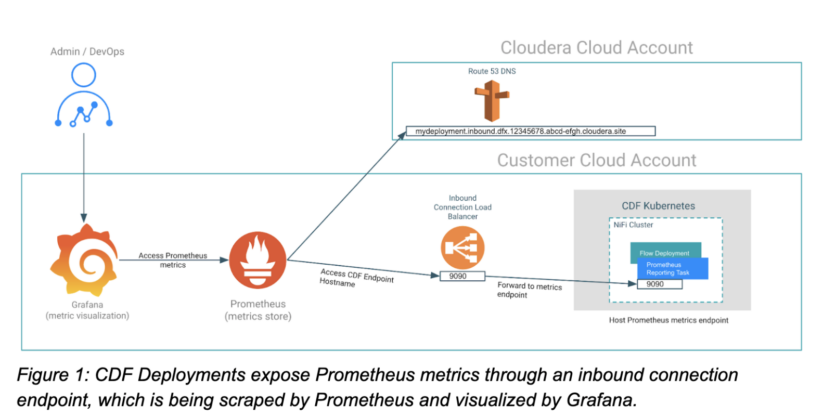
Target architecture: connecting the pieces
The key to insightful Grafana dashboards is having access to relevant application metrics. In our case, these are NiFi metrics of our flow deployment. We therefore need to be able to expose NiFi metrics for Prometheus so it can scrape them before we can build dashboards in Grafana. CDF-PC’s support for Prometheus reporting tasks and inbound connections allows Prometheus to scrape metrics in real time. Once the metrics are in Prometheus, querying it and building dashboards on top of it in Grafana is straightforward. So let’s take a closer look at how we get from having metrics in our flow deployment to a fully featured Grafana dashboard by implementing the target architecture shown in Figure 1 below.
Configuring a CDF deployment to be scraped by Prometheus
Starting with CDF-PC 2.6.1, you can now programmatically create NiFi reporting tasks to make relevant metrics available to various third party monitoring systems. The Prometheus reporting task that we’ll use for this example creates an HTTP(S) metrics endpoint that can be scraped by Prometheus agents or servers. To use this reporting task in a CDF-PC deployment, we have to complete the following steps:
- Ensure that the HTTP(s) metrics endpoint is reachable from Prometheus by configuring an inbound connections endpoint when creating the deployment.
- Create and configure the Prometheus reporting task using the CDP CLI after successful deployment creation.
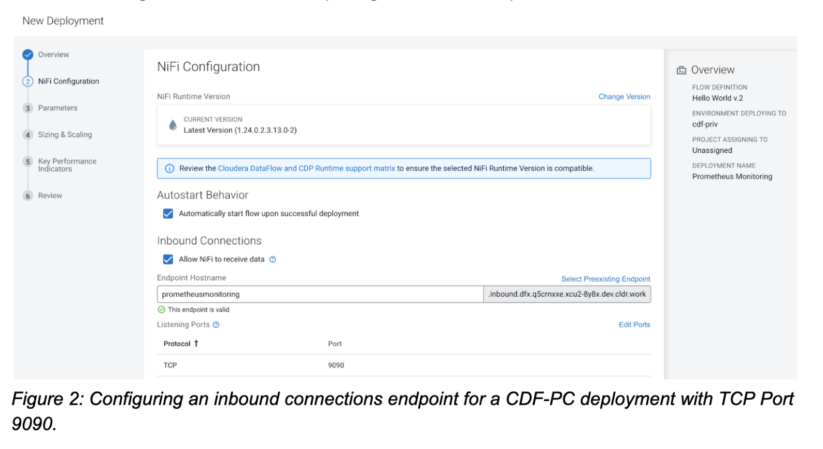
Creating a deployment with an inbound connections endpoint
When creating a deployment, CDF-PC gives you the option to allow NiFi to receive data by configuring an inbound connections endpoint. When the option is checked, CDF-PC will suggest an endpoint hostname that you can customize as needed.
The inbound connections endpoint gives external applications the ability to send data to a deployment, or in our case, connect to a deployment to scrape its metrics. In addition to the endpoint hostname we also have to provide at least one port that we want to expose. In our case we’re using Port 9090 and are exposing it with the TCP protocol.
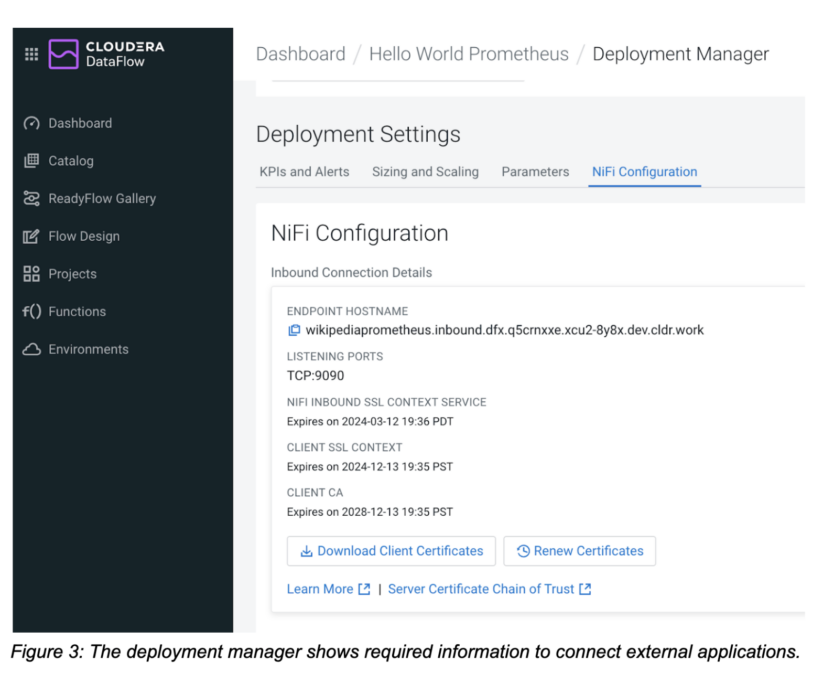
After you have created your deployment with an inbound connection endpoint, navigate to the NiFi configuration tab in the deployment manager where you will see all relevant information to connect external applications to the deployment. Now that the deployment has been created, we can move on to the next step—creating the reporting task.
Creating and configuring the NiFi Prometheus reporting task
We can now use the CDP CLI to create and configure the Prometheus reporting task. Download and configure the CDP CLI. Make sure that you are running at least version 0.9.101 by running cdp –version.
The command we’re going to use is the cdp dfworkload create-reporting-task command. It requires the deployment CRN, environment CRN and a JSON definition of the reporting task that we want to create. Copy the deployment CRN from the deployment manager, get the environment CRN for the associated CDP environment, and start constructing the command.
cdp dfworkload create-reporting-task --deployment-crn crn:cdp:df:us-west-1:9d74eee4-1cad-45d7-b645-7ccf9edbb73d:deployment:eb2717f3-1bdf-4150-bd33-5b15d715bc7d/5cdc4d43-2991-4d4c-99fc-c400cd15853d --environment-crn crn:cdp:environments:us-west-1:9d74eee4-1cad-45d7-b645-7ccf9edbb73d:environment:bf58748f-7ef4-477a-9c63-448b51e5c98f
The missing piece is providing the information about which reporting task we want to create. All supported reporting tasks can be passed in using their configuration JSON file. Here’s the JSON configuration for our Prometheus reporting task. It consists of a Prometheus-specific properties section followed by generic reporting task configuration properties such as whether the reporting task should be started, how frequently it should run, and how it should be scheduled.
{

    "name": "PrometheusReportingTask",

    "type": "org.apache.nifi.reporting.prometheus.PrometheusReportingTask",

    "properties": {

      "prometheus-reporting-task-metrics-endpoint-port": "9090",

      "prometheus-reporting-task-metrics-strategy": "All Components",

      "prometheus-reporting-task-instance-id": "${hostname(true)}",

      "prometheus-reporting-task-client-auth": "No Authentication",

      "prometheus-reporting-task-metrics-send-jvm": "false"

    },

    "propertyDescriptors": {},

    "scheduledState": "RUNNING",

    "schedulingPeriod": "60 sec",

    "schedulingStrategy": "TIMER_DRIVEN",

    "componentType": "REPORTING_TASK"

  }
| Configuration Property | Description |
| prometheus-reporting-task-metrics-endpoint-port | The port that this reporting task will use to expose metrics. This port must match the port you specified earlier when configuring the inbound connection endpoint. |
| prometheus-reporting-task-metrics-strategy | Defines granularity on which to report metrics. Supported values are “All Components,” “Root Process Group,” and “All Process Groups.” Use this to limit metrics as needed. |
| prometheus-reporting-task-instance-id | The ID that will be sent alongside the metrics. You can use this property to identify your deployments in Prometheus. |
| prometheus-reporting-task-client-auth | Does the endpoint require authentication? Supported values are “No Authentication,” “Want Authentication,” or “Need Authentication”. |
| prometheus-reporting-task-metrics-send-jvm | Defines whether JVM metrics are also exposed. Supported values are “true” and “false.” |
Table 1: Prometheus configuration properties of the NiFi Prometheus reporting task.
You can either pass the JSON file as a parameter to the CLI command or reference a file. Let’s assume we’re saving the above JSON content in a file called prometheus_reporting_task.json.
Now we can construct our final CLI command that will create the desired reporting task:
cdp dfworkload create-reporting-task --deployment-crn crn:cdp:df:us-west-1:9d74eee4-1cad-45d7-b645-7ccf9edbb73d:deployment:eb2717f3-1bdf-4150-bd33-5b15d715bc7d/5cdc4d43-2991-4d4c-99fc-c400cd15853d --environment-crn crn:cdp:environments:us-west-1:9d74eee4-1cad-45d7-b645-7ccf9edbb73d:environment:bf58748f-7ef4-477a-9c63-448b51e5c98f --file-path prometheus_reporting_task.json
After executing the command, you should get a response back that contains the reporting task CRN:

{

    "crn": "crn:cdp:df:us-west-1:9d74eee4-1cad-45d7-b645-7ccf9edbb73d:reportingTask:eb2717f3-1bdf-4150-bd33-5b15d715bc7d/66a746af-018c-1000-0000-00005212b3ea"

}
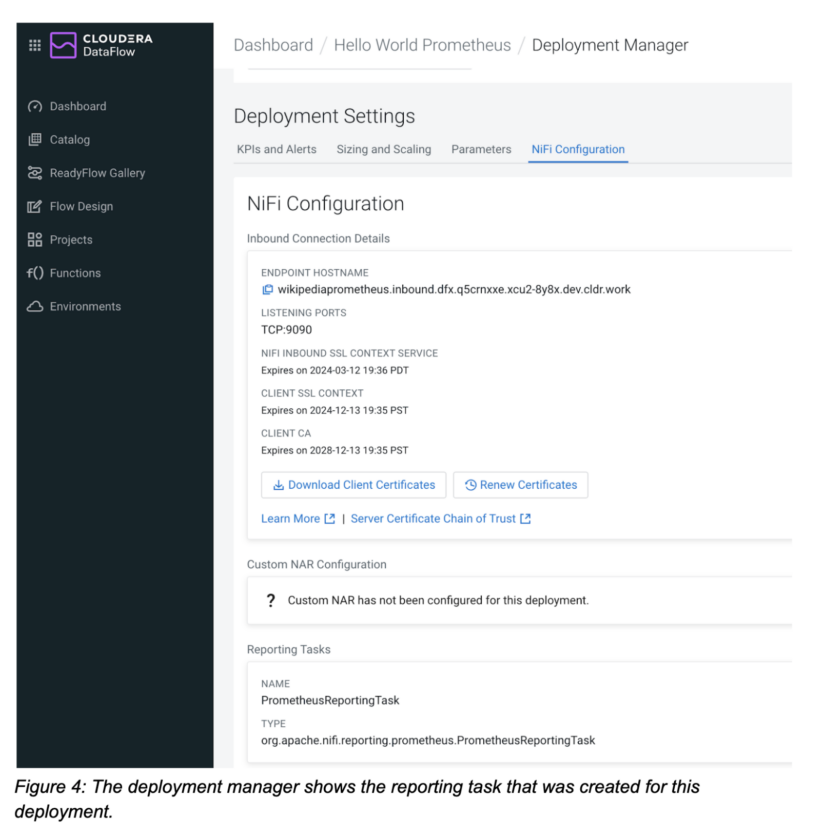
To confirm that the reporting task was created, navigate to the NiFi configuration tab in the deployment manager and verify that the reporting task section reflects the reporting tasks you created using the CLI.
Now that our flow deployment and reporting task have been created, we can move on to the next step and configure the Prometheus server to scrape this deployment.
Configuring Prometheus to monitor a CDF deployment
To define a new scraping target for Prometheus, we need to edit the Prometheus configuration file. Open the prometheus.yaml file to add the CDF deployment as a target.
Create a new job, e.g. with CDF deployment as its name. Next, copy the endpoint hostname of your CDF deployment from the deployment manager and add it as a new target.
scrape_configs:
  # The job name is added as a label `job=<job_name>` to any timeseries scraped from this config.

  - job_name: "CDF Deployment"

    # metrics_path defaults to '/metrics'

    # scheme defaults to 'http'.

    static_configs:

      - targets: ["wikipediaprometheus.inbound.dfx.q5crnxxe.xcu2-8y8x.dev.cldr.work:9090"]
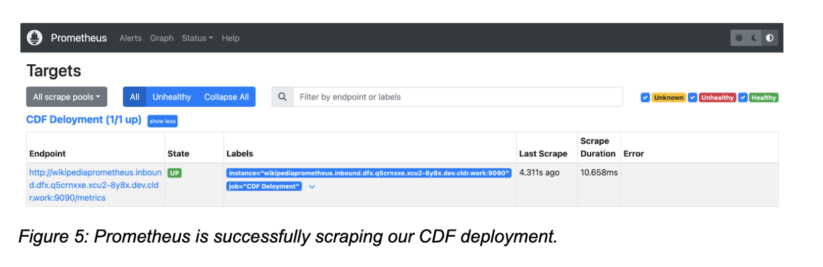
Apply the configuration changes and navigate to the Prometheus web console to confirm that our CDF deployment is being scraped. Go to the Status→Targets and verify that your CDF Deployment is “Up.”
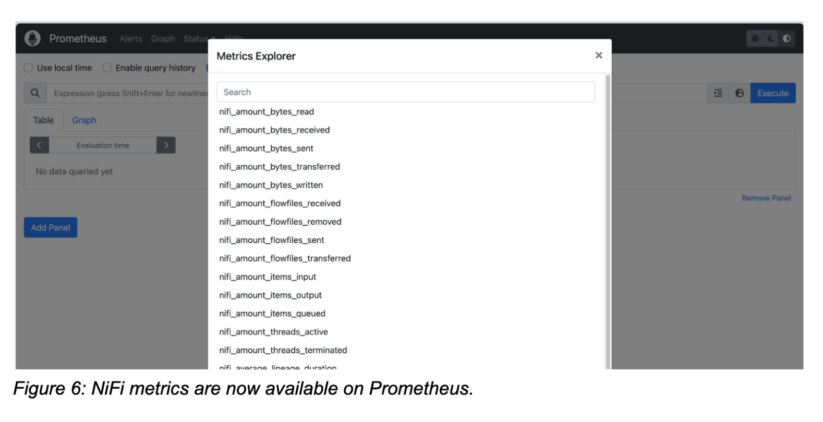
Once Prometheus has started scraping, you can explore all NiFi metrics in the metrics explorer and start building your Prometheus queries.
Sample Grafana dashboard
Grafana is a popular choice for visualizing Prometheus metrics, and it makes it easy to monitor key NiFi metrics of our deployment.
Create a Prometheus connection to make all metrics and queries available in Grafana.
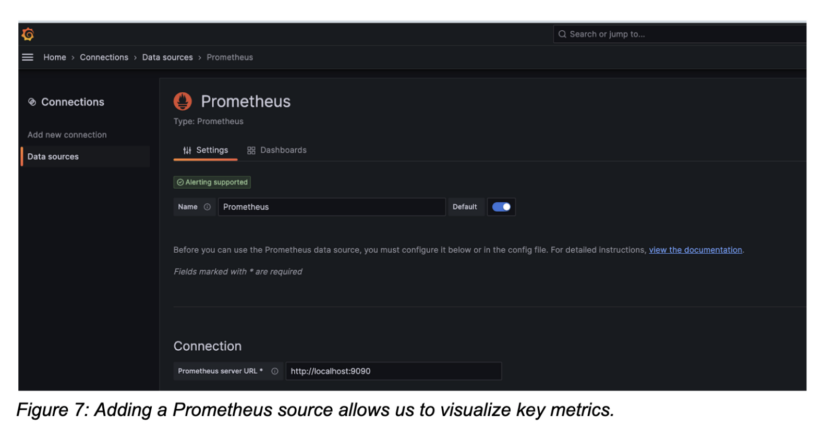
Now that Grafana is connected to Prometheus, you can create a new dashboard and add visualizations.
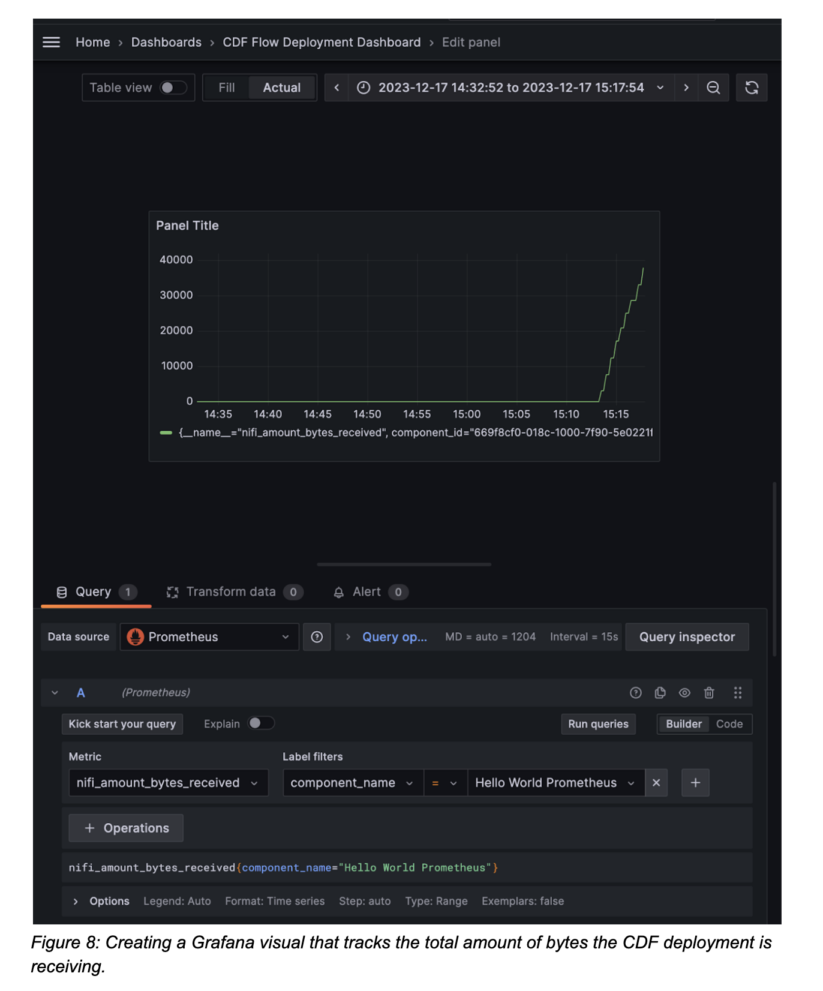
Let’s say we want to create a graph that represents the data that this deployment has received from external sources. Select “add visualization” on your dashboard and make sure your Prometheus connection is selected as the data source.
Select the nifi_amount_bytes_received metric. Use the label filters to narrow down the component in the flow. By using component_name and “Hello World Prometheus,” we’re monitoring the bytes received aggregated by the entire process group and therefore the flow. Alternatively you can monitor all components if no filter is defined or monitor individual processors too.
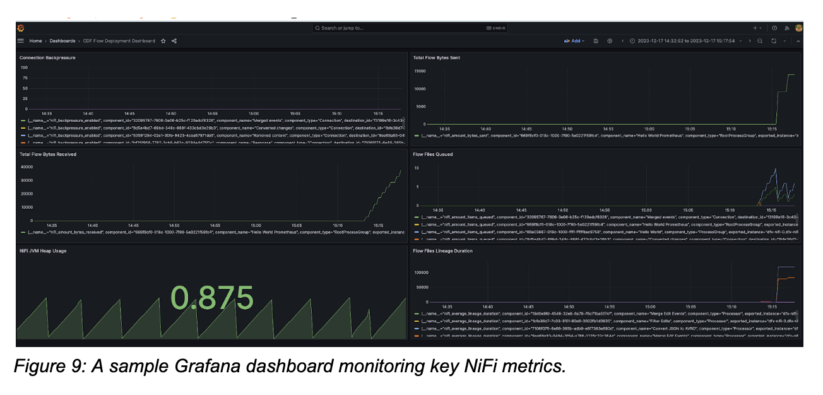
With all NiFi metrics being available in Grafana, we can now build a full dashboard tracking all relevant metrics. In the example below we’re monitoring total bytes received/sent, the number of flow files queued in all components, the average lineage duration and the current NiFi JVM heap usage which help us understand how our flows are doing.
 Conclusion
The NiFi Prometheus reporting task, together with CDF inbound connections makes it easy to monitor key metrics in Prometheus and create Grafana dashboards. With the recently added create-reporting-task CDF CLI command, customers can now automate setting up Prometheus monitoring for every new deployment as part of their standard CI/CD pipeline.
Try out CDF-PC using the public five day trial and check out the Prometheus monitoring demo video below for a step-by-step tutorial.
Editor's Choice

