How to Trial Honeycomb and OpenTelemetry
By Kyle Moonwright | Last modified on June 23, 2023Insightful proof-of-concepts with a tool can be difficult to undertake due to the demands on valuable resources: time, energy, and people. With a task as grand as observability, how could one truly test if Honeycomb and OpenTelemetry are right for their organization and meet their requirements?
For this thought experiment, here’s a comprehensive description of the ideal product evaluation over the course of four weeks, given unlimited resources.
Timeline
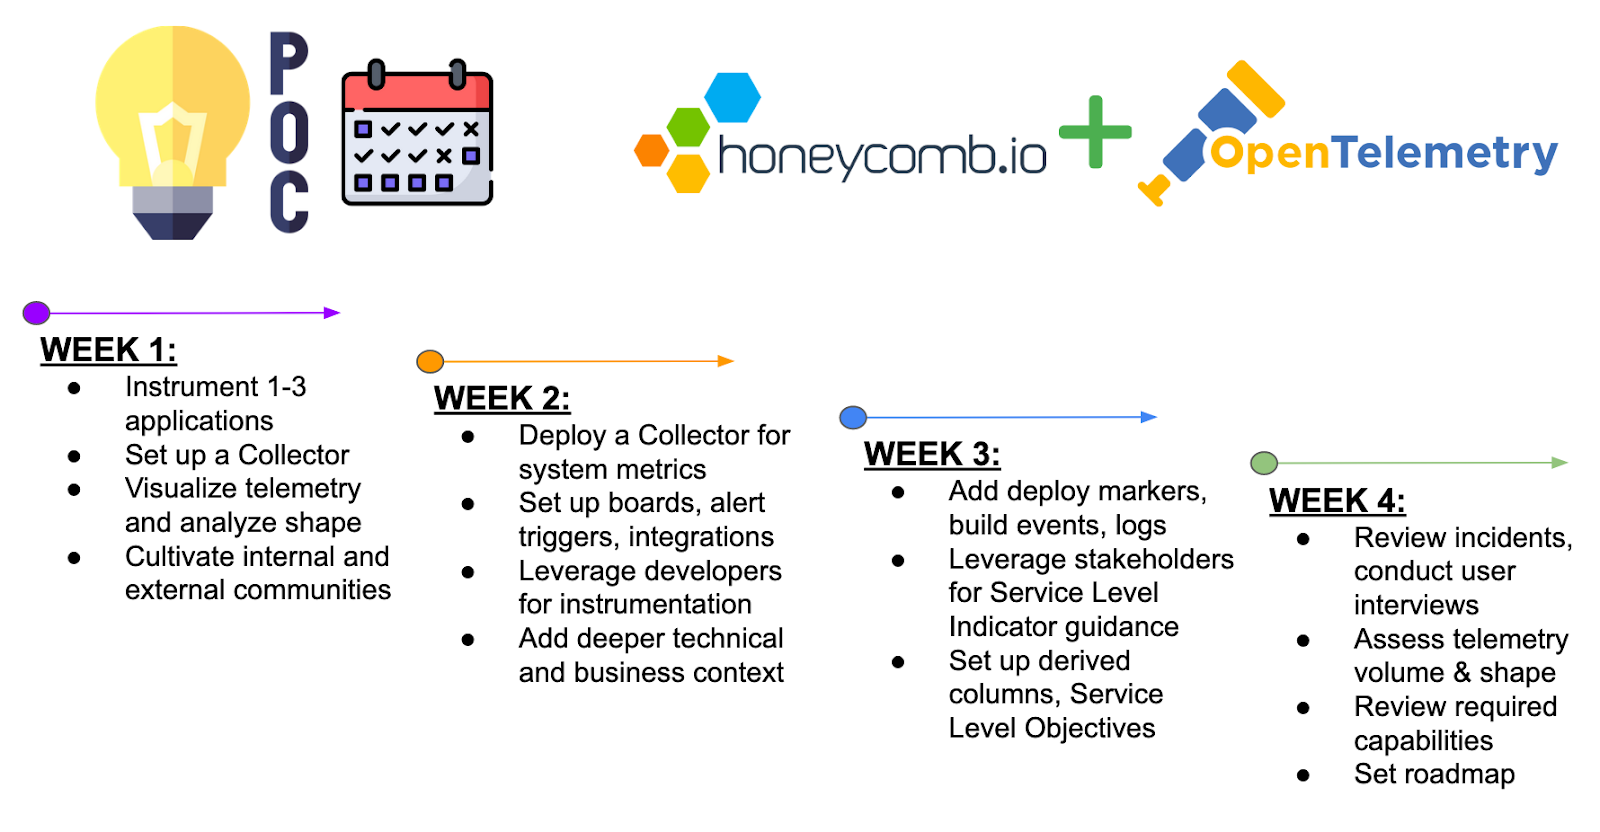
For your convenience, here’s the timeline broken down by week in all its TL;DR glory. If you’re interested in the full nitty-gritty version, scroll on down!
Getting Started
OpenTelemetry is an open source project that provides standardized instrumentation to collect telemetry from applications and infrastructure. Honeycomb is a powerful observability tool that empowers observers to ask complex questions with application-specific context, by ingesting highly-dimensionality and highly-cardinality structured events, to equalize telemetry events, and maximize discovering potential unknown-unknowns. Before we get started, sign up for Honeycomb for an account ready to accept telemetry.
Week One
Instrumentation
Select one to three applications or services for observability and implement instrumentation. Any particularly painful or critically important services are good candidates. OpenTelemetry currently provides auto-instrumentation for several languages without the need for code changes, to quickly produce traces across the most common libraries. For Kubernetes environments, OpenTelemetry provides custom Operators for auto-instrumentation and configuration management at the deployment level.
Auto-instrumentation provides fast value and delivers a sense for the shape of your telemetry, but for deeper application-specific context and services written in other languages, we’ll need manual instrumentation. Remember to grab a Honeycomb API Key to send telemetry, which will be scoped to an environment and dataset, and schematically configured to OpenTelemetry’s specification.
OpenTelemetry Collector
Next, set up an OpenTelemetry Collector, a flexible component we’ll deploy to ingest telemetry in various formats from multiple sources, process data by adding/redacting attributes, and export telemetry to multiple destinations. Configure the instrumentation to send traces to the Collector to export to Honeycomb using the OTLP exporter. Run the Collector using one of our sample configurations and update your endpoints accordingly.
Explore Honeycomb
Once data is flowing, exercise a scientific approach to your production environment with a simple debugging loop. Explore the Home screen and click on any visualizations to jump into the Query Builder, the foundation of Honeycomb, to ask iterative questions of all kinds. We also recently released Query Assistant, which helps engineers ask questions about their systems in plain English.
Use BubbleUp to differentiate subgroups in system behavior, which can distinguish patterns of events in any Heatmap or Group By query. Drill into attributes of significance and stack visualizations to discover patterns in the data. Honeycomb tracks all the queries you run, making it easy to go back in time and reuse queries if necessary. Interact with visualizations to examine a trace in our waterfall view. Note inconsistencies or gaps that could be an opportunity for instrumenting additional spans—or any relevant high-cardinality data to supercharge future investigations.
Build on internal and external communities
It is vital to build internal communities of engineers by encouraging observability engineering of their code in a production environment. The goal is to foster a culture of observability, where engineers take collective ownership of system reliability. This approach promotes proactive identification and resolution of issues, enhances system understanding, and drives continuous improvement in code quality, performance, and customer satisfaction.
Share visualizations with teammates that unfurl with Slack, review incidents with permalinks, and explore the team’s questions in the Team History to scale seasoned engineers. Leverage your external communities, whether on Honeycomb’s Slack community Pollinators, or OpenTelemetry's communities.
Week Two
Enhance the collector
Enhance the Collector by configuring a secondary pipeline to collect system metrics. For Kubernetes, you can deploy the Collector as a Daemonset and add the k8sattributesprocessor to add infrastructure-level dimensions as span attributes. Remember to send infrastructure metrics to their own Honeycomb dataset for scoping and query across the entire environment for environment-wide investigations.
Set up boards, alert triggers, and integrations
Any query can be saved to a board for convenience. Set up your own or draw from these templates, which you can implement using the API via Terraform. Infrastructure queries should be saved and set to your default metrics board, to quickly coincide visualizations with the Metrics tab. Queries can also set alert triggers based on defined thresholds, but practice meaningful alerting to avoid alert fatigue and perpetuating a reactive incident response. Configure notification integrations with your existing communications tools like PagerDuty, Slack, email, or custom webhooks.
Leverage developers and stakeholders
Leverage internal engineers for the instrumented services and relevant stakeholders to successfully target instrumentation efforts. Those who possess intimate knowledge of system behaviors can identify potential bottlenecks. This collaborative approach engages developers with the production environment and strengthens the organization's ability to facilitate faster issue resolution.
Review instrumentation
Address notable gaps in technical or business-oriented context as candidates for additional application instrumentation (or sample noisy libraries). Begin manually instrumenting the important details aligned to user experiences with new spans, especially span attributes. Honeycomb supports structured events with high dimensionality and high cardinality, so pack events with as much context as possible. Fortunately, OpenTelemetry standardizes context propagation across all language SDKs, stitching spans together across adjacent services.
Week Three
Add deployment markers, buildevents, and logging systems
Implement deploy markers to display build windows globally and connect events from resources like CI/CD pipelines. Even builds themselves can be rendered as traces, to track and analyze performance over time. Additionally, export existing logging systems to Honeycomb using a Collector with a custom receiver to transform into the OpenTelemetry format, or using Honeycomb’s honeytail integration. AWS users can get fast value setting up a Kinesis pipeline to stream CloudWatch telemetry.
Leverage stakeholders for SLI and SLO guidance
Revisit internal engineers and stakeholders to define Service Level Objectives. This will help set a measurement of success based on firsthand understanding of system performance, user experiences, and business goals. Define Service Level Indicators to accurately measure system performance and enable proactive responses to potential service degradation. By aligning the expertise of your engineers and stakeholders, you can foster a culture of shared responsibility, driving continuous improvement in reliability and incident response.
Set up derived columns and SLOs
Next, create derived columns to define custom fields from your raw data with expressions that capture event details in a more human-readable way. The calculation may be logical, mathematical, or specially purposed for business measurements that may change over time. Honeycomb’s SLOs track successful events based on a budget burndown with insight for first response to enable a proactive approach to system health.
Week Four
Review incidents, conduct user interviews
Review system incidents and conduct user interviews to assess the value of Honeycomb and OpenTelemetry. Utilize postmortems to analyze root causes, remediation steps, and identify areas for improvement to highlight the tool's effectiveness in pinpointing issues and expediting resolution. Conduct user interviews to gather feedback from engineers who interact with the tool regularly. Use this to evaluate usability, impact on workflows, and to identify any shortcomings.
Assess telemetry producers, event ingest
Assess your telemetry producers across the environment by understanding telemetry types, the volume of data they generate, and their criticality to your system. The goal is to balance volume with resolution and prioritize instrumentation efforts. At higher volumes, sampling can be a powerful tool to control your telemetry. However, sampling is a long-term, iterative process unique to each organization. Honeycomb’s Refinery provides a tail-based sampling proxy capable of intelligent decision-making and dynamic scaling within your VPC.
Review required capabilities and set roadmap
Compare your findings to the organization’s required capabilities for observability tooling. Consider the technical challenges and costs involved to achieve deeper observability, but also the sociotechnical challenges Honeycomb aims to solve to open the potential future of observability-driven development and service ownership. As considerations are finalized, create an engineering roadmap to instrument more services, address any identified gaps, enhance instrumentation context, and enable team members to utilize the tool effectively.
TL;DR: Give it four weeks of genuine effort
The process outlined above is an in-depth overview of how to ideally POC Honeycomb and OpenTelemetry. However, we know that oftentimes, ‘ideal’ is lofty—so feel free to use the parts of this process that make sense to you and your use case.
I know I gave you a lot of reading material within, but if you want to continue your journey into Honeycomb, I’d like to point you to our guide on Honeycomb & OpenTelemetry for in-depth observability. It’ll certainly help you understand the whole “with our powers combined!” thing. And lastly, if you’re ready to get started, reach out to us!
Related Posts
Introducing Relational Fields
Expanded fields allow you to more easily find interesting traces and learn about the spans within them, saving time for debugging and enabling more curiosity...
Real User Monitoring With a Splash of OpenTelemetry
You're probably familiar with the concept of real user monitoring (RUM) and how it's used to monitor websites or mobile applications. If not, here's the...
Transforming to an Engineering Culture of Curiosity With a Modern Observability 2.0 Solution
Relying on their traditional observability 1.0 tool, Pax8 faced hurdles in fostering a culture of ownership and curiosity due to user-based pricing limitations and an...