

In a previous blog post, we explored the power of Cloudera Observability in providing high-level actionable insights and summaries for Hive service users. In this blog, we will delve deeper into the insight Cloudera Observability brings to queries executed on Hive.
As a quick recap, Cloudera Observability is an applied observability solution that provides visibility into Cloudera deployments and its various services. The tool allows automatic actions to prevent negative consequences like excessive resource consumption and budget overruns. Among other capabilities, Cloudera Observability delivers comprehensive features to troubleshoot and optimize Hive queries. Furthermore, it provides insights from deep analytics for a variety of supported engines using query plans, system metrics, configuration, and much more.
An essential goal for a Hive SQL developer is ensuring that queries run efficiently. If there are issues in the query execution, it should be possible to debug and diagnose those quickly. When it comes to individual queries, the following questions typically crop up:
- What if my query performance deviates from the expected path?
- When my query goes astray, how do I detect deviations from the expected performance? Are there any baselines for various metrics about my query? Is there a way to compare different executions of the same query?
- Am I overeating, or do I need more resources?
- How many CPU/memory resources are consumed by my query? And how much was available for consumption when the query ran? Are there any automated health checks to validate the resources consumed by my query?
- How do I detect problems due to skew?
- Are there any automated health checks to detect issues that might result from skew in data distribution?
- How do I make sense of the stats?
- How do I use system/service/platform metrics to debug Hive queries and improve their performance?
- I want to perform a detailed comparison of two different runs; where should I start?
- What information should I use? How do I compare the configurations, query plans, metrics, data volumes, and so on?
Let’s check how Cloudera Observability answers the above questions and helps you detect problems with individual queries.
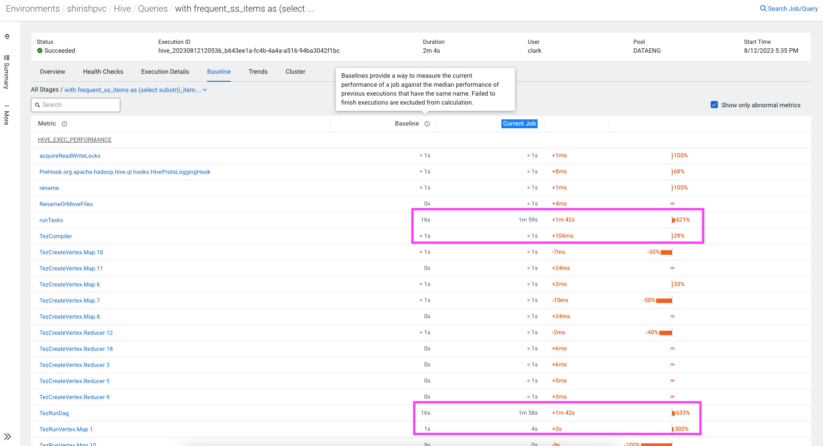
What if my query performance deviates from the expected path?
Imagine a periodic ETL or analytics job you run on Hive service for months suddenly becomes slow. It’s a scenario that’s not uncommon, considering the multitude of factors that affect your queries. Starting from the simplest, a job could slow down because your input or output data volume increased, data distribution is now different because of the underlying data changes, concurrent queries are affecting the use of shared resources, or system hardware issues such as a slow disk. It could be a tedious task to find out where exactly your queries slowed down. This requires an understanding of how a query is executed internally and different metrics that users should consider.
Enter Cloudera Observability’s baselining feature, your troubleshooting partner. From execution times to intricate details concerning the Hive query and its execution plan, every vital aspect is considered for baselining. This baseline is meticulously formed using historical data from prior query executions. So when you detect performance deviations for your Hive queries, this feature becomes your guide, pointing you to metrics of interest.
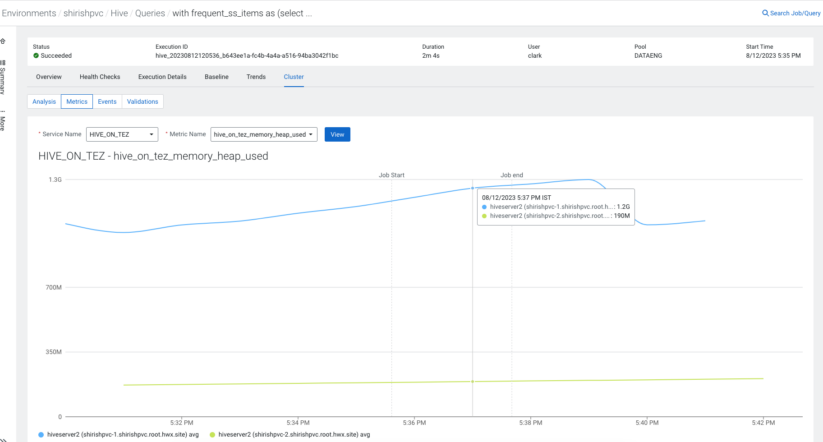
Am I overeating, or do I need more resources?
As an SQL developer, striking a balance between query execution and optimal use of resources is vital. Naturally, you would want a straightforward way to find out how many resources were consumed by your query and how many were available. Furthermore, you also want to be a good neighbor when using shared system resources and not monopolize their use.
The “Cluster Metrics” feature in Cloudera Observability helps you achieve this.
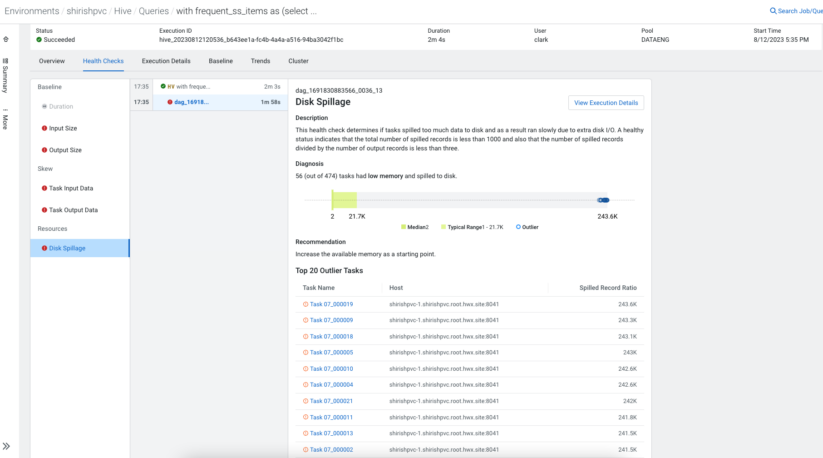
Challenges may also arise if you have fewer resources than your query needs. Cloudera Observability steps in with several automated query health checks that help you identify the problems due to resource scarcity.
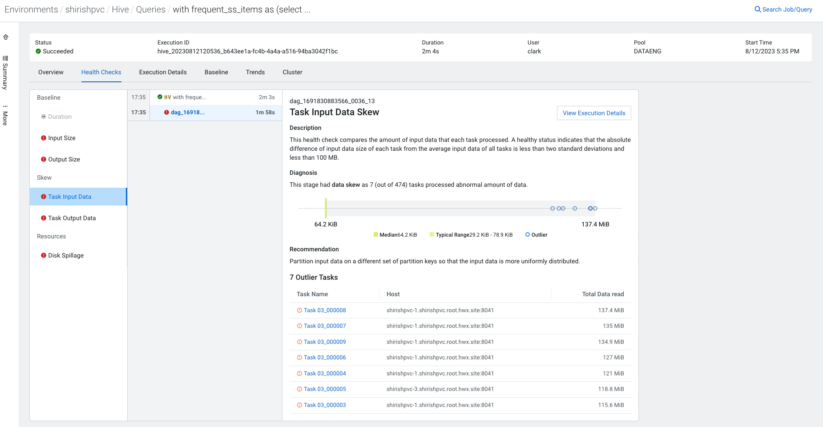
How do I detect problems due to skew?
In the realm of distributed databases (and Hive is no exception), there is an essential rule that data should be distributed evenly. The non-uniform distribution of the data set is called data “skew.” Data skew can cause performance issues and lead to non-optimized usage of available resources. As such, the ability to detect issues due to skew and provide recommendations to resolve those helps Hive users considerably. Cloudera Observability comes armed with several built-in health checks to detect problems due to skew to help users optimize queries.
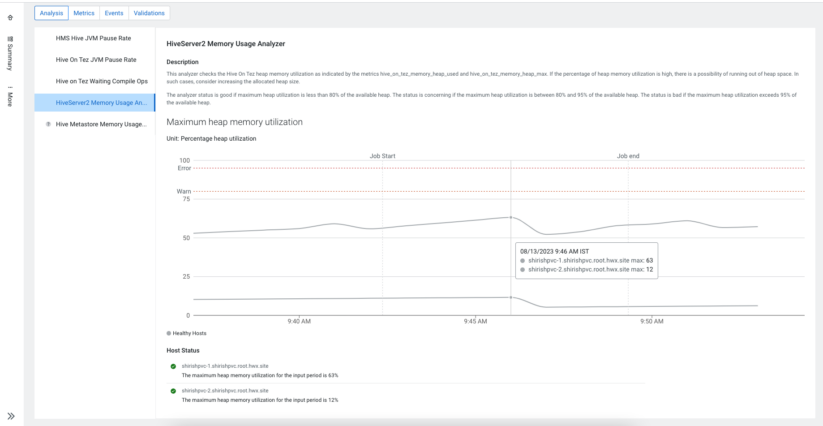
How do I make sense of the stats?
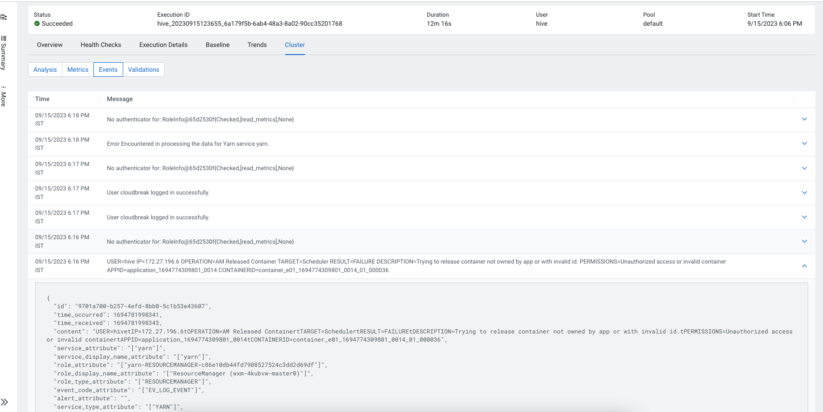
In today’s tech world, metrics have become the soul of observability, flowing from operating systems to complex setups like distributed systems. However, with thousands of metrics being generated every minute, it becomes challenging to find out the metrics that affect your query jobs.
The Cloudera platform provides many such metrics to make it observable and aid in debugging. Cloudera Observability goes a step further and provides built-in analyzers that perform health checks on these metrics and spot any issues. With the help of these analyzers, it’s easy to spot system and load issues. Furthermore, Cloudera Observability provides you the ability to search metric values for important Hive metrics that may have affected your query execution. It also provides interesting events that may have happened on your clusters while the query ran.
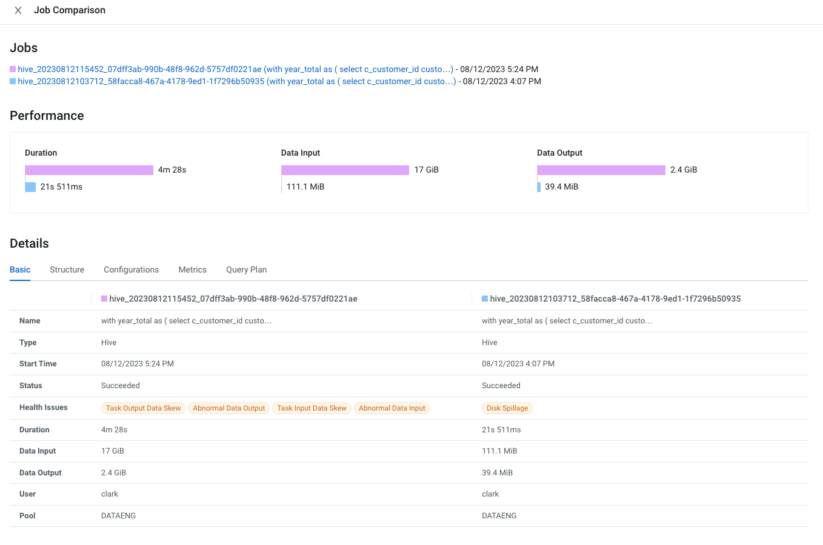
I want to perform a detailed comparison of two different runs; where should I start?
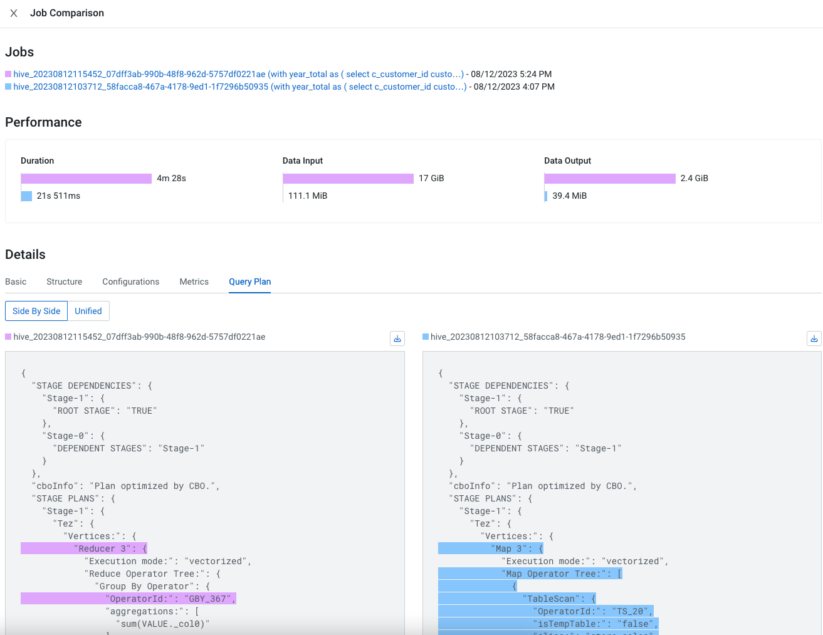
It’s not unusual to observe a degradation in query performance for various reasons. As a developer, you are on a mission to compare two different runs and spot the differences. But where would you start? There is so much to find out and compare. For example, starting from the most straightforward metrics like execution duration or input/output data sizes, to complex ones like differences between query plans, Hive configuration when the query was executed, the DAG structure, query execution metrics, and more. A built-in feature that achieves this is of great use, and Cloudera Observability does this precisely for you.
With the query comparison feature in Cloudera Observability, you can compare all of the above factors between two executions of the query. Now it is effortless to spot changes between the two executions and take appropriate actions.
As illustrated, gaining insight into your Cloudera Hive queries is a breeze with Cloudera Observability. Analyzing and troubleshooting Hive queries has never been this straightforward, enabling you to boost performance and catch any issues with a keen eye.
To find out more about Cloudera Observability, visit our website. To get started, get in touch with your Cloudera account manager or contact us directly.
Editor's Choice

