Escaping the Cost/Visibility Tradeoff in Observability Platforms
By Fahim Zaman | Last modified on March 11, 2024For more than a decade, the popular way to monitor production code has been to save and track app metrics and expose them to developer teams. The appeal of today’s leading application performance monitoring (APM) tools lies in a low-effort day zero experience with drop-in agents, button click integrations, and immediate metrics collection. However, instant monitoring comes with a caveat much like instant ramen—the internet is replete with examples of observability bills spiraling beyond expectations:
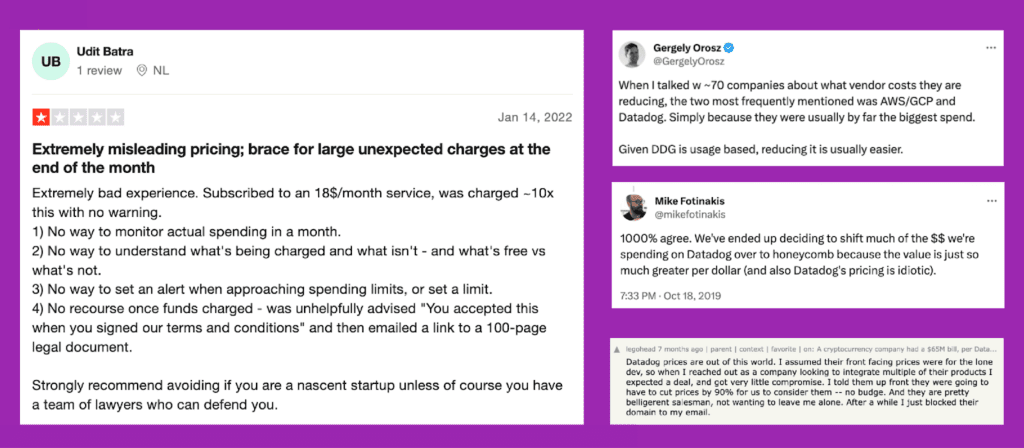
Is there a pattern behind the heightened budget pressure? It turns out, yes. For modern architectures, relying on dashboards, tags, and pre-indexing can spiral into inefficiency. Read on for an explanation of the challenge with incumbent APM bills, and how to avoid future surprises.
Escalating costs with system complexity
Monitoring costs escalate with modern service proliferation and ownership. Every new host, pod, node, or service adds to the APM bill. Service teams each need access to change dashboards at any given time. As they consume custom metrics, index data in additional formats like traces and logs, and ration seat access, buyers are faced with a cost/visibility tradeoff. Teams either find themselves over-paying for observability or sacrificing visibility to control costs.
Limiting observability ultimately impacts customers when releases are unstable, delayed, and issues go unfixed. Either developers slow down on shipping features a business needs, or they erode user trust with a backlog of bugs.
Solving for the cost/visibility tradeoff with modern observability
Modern observability solutions like Honeycomb don't require storing the same data multiple times in different formats. Honeycomb supports wide, attribute-rich events that combine log and trace context and provide real-time data, metrics, alerts, and relationship analysis at query-time without the need to pre-store custom time series or indexes.
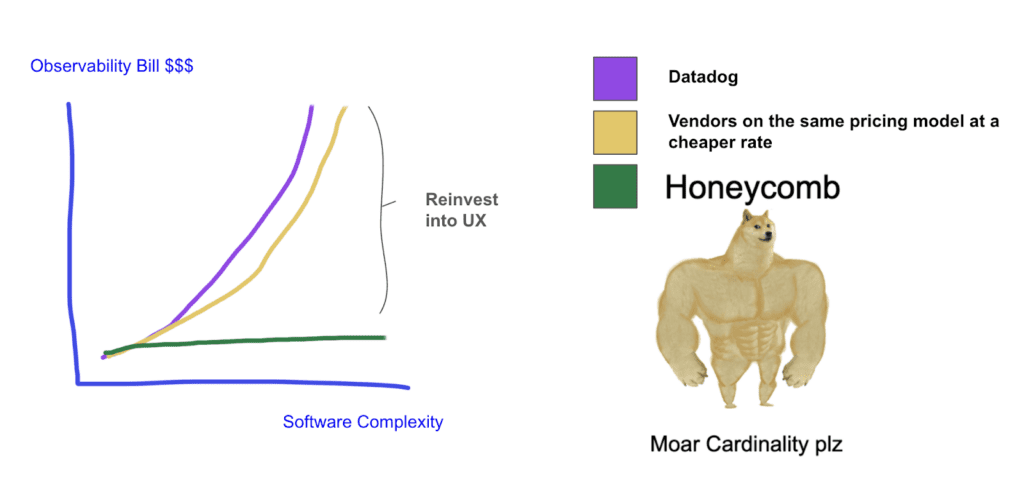
This makes observability easy to scale, and eliminates additional costs that come with other vendors. In this comparison to market-leading APM suites such as Datadog or New Relic, you’ll see Honeycomb’s focus on efficient pricing by event rather than punishing service and team complexity (pods, nodes, services, hosts, bytes, users, and more):
| Datadog | Honeycomb | |
| Services | $ per tracked service | Unlimited |
| Hosts | $ per tracked host | Unlimited |
| User/Audit/API call IDs | $ per tracked ID | Unlimited |
| Containers | $ per tracked container | Unlimited |
| Pods | $ per tracked pod | Unlimited |
| Nodes | $ per tracked node | Unlimited |
| Ingested Records | Separate bill for ingested vs. indexed records | Price per event, subject to volume discount |
| Overage Control | High watermark overage billing | Burst protection and throttling until contract adjustment |
| Volume Controls | Sampling creates gaps in trace visibility; custom metric billing limits attributes from analysis | Rule-based trace aware sampling without dropping any system attribute, keeping all events with incident relevant info |
| New Relic | Honeycomb | |
| Unit Cost | $ per GB stored (limit context and indexing to optimize) | $ per event (add thousands of fields of rich context to optimize) |
| Basic Access to alerts, raw data query, and viewing lists, logs, and dashboards | Unlimited users | Unlimited users |
| Distributed Tracing Access | $550+ per user per month | Unlimited users |
| Service Level Monitoring Access | $550+ per user per month | Unlimited users |
| Kubernetes Observability | $550+ per user per month | Unlimited users |
| OpenTelemetry Observability | $550+ per user per month | Unlimited users |
| Service Maps Access | $550+ per user per month | Unlimited users |
| Browser/FE Observability | $550+ per user per month | Unlimited users |
| Attribute Analysis and Comparison | $550+ per user per month | Unlimited users |
The result: a truly cost-effective platform free from the constraints of traditional monitoring. This encourages attribute-rich data with no limitation on complexity, using a custom datastore and parallelized query engine for efficient processing. It aligns observability costs with actual application events, ensuring scalability without crushing the budget.
Towards cost efficient observability
Teams that want to take advantage of Honeycomb’s scalable pricing can do so in a few practical steps we see our customers mature through:
Stage 1: Finding target areas for efficiency gains
Getting control of your observability spend begins with evaluating your system's fit for a new approach and where a change will have the most impact. Key indicators that call for a new approach include:
- Multiple intercommunicating system components combining on a request.
- Components with heavy adoption of cloud-native technologies and containerization.
- High consumption of custom app metrics for production software insights.
- Service-oriented dev teams seeking access to better trace and event analysis.
For example, a large data platform customer of Honeycomb recently reviewed these factors and found multiple boxes checked with a substantial APM custom metric bill. Within the last 60 days of talking to us, they’ve found the right starting points for their journey towards modern observability, activated Honeycomb access for every user at no cost, and are already achieving reductions in their spend.
Stage 2: Instrumenting to unify context for cost efficiency
Next is engaging your developer teams in adopting a new, more efficient instrumentation protocol. This involves transitioning from traditional APM metric-storing to more scalable solutions like OpenTelemetry with Honeycomb. This takes a structured approach.
The philosophy of throwing a proprietary agent at your services, saving what you think you’ll need, adding a bucket to grab logs, and piecing everything together in post during a production incident is out of date, time-consuming, and cost-inefficient.
What developer buy-in looks like:
- Software teams adopt an open and sustainable instrumentation package like OpenTelemetry, and build the muscle memory of adding custom attributes in-line with the code they’re shipping whether in staging or prod.
- Instead of planning to tag and store custom metrics as incidents occur, developers collect code and infra attributes as free context on trace events.
Custom instrumentation is muscle memory: Transition from tagging new custom metrics or printing additional log records for your APM suite to embedding custom attribute tracking directly into OpenTelemetry. This practice becomes standard for both production and staging code.
What used to involve custom tagging and metrics creation in Datadog like this:
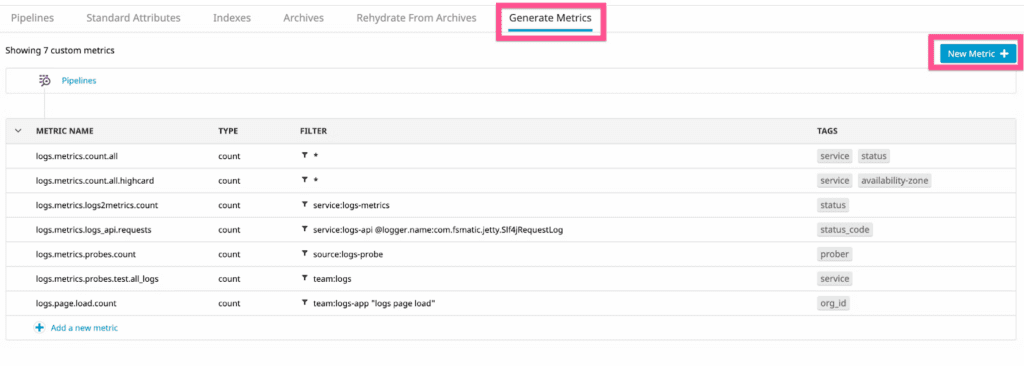
…now becomes a code-level practice like this:
  //Get current Span
  Span span = Span.current();
  //Add custom attributes to Span
  span.setAttribute("OrgID", orgID);
For example, a premier online commerce platform that moved from a centralized APM agent to OpenTelemetry in 2023, recognized the need for more adoption training and engaged Honeycomb as a partner. Over 40 development teams that switched to OpenTelemetry are training with observability experts to learn how to use attribute querying to get system insights they never could before.
Stage 3: Reframing investigation to decrease expensive pre-stored metrics
This step phase marks a pivotal shift in how developer and ops teams view observability data. Instead of pulling up saved metrics and the dashboards associated with them, developer teams operating production code can view any attributes on their trace events as a metric count, heatmap, group by, or much more complex analysis processed at query time.
The focus changes from monitoring numerous preconfigured dashboards to prioritizing a few high-value business SLAs tied to user satisfaction. If something that matters goes wrong, the data you need will be a click away, constructed at query time. With a modern observability practice, you focus on the key results, where they’re failing, and instantly see real-time anomaly detection and analysis within context-rich events.
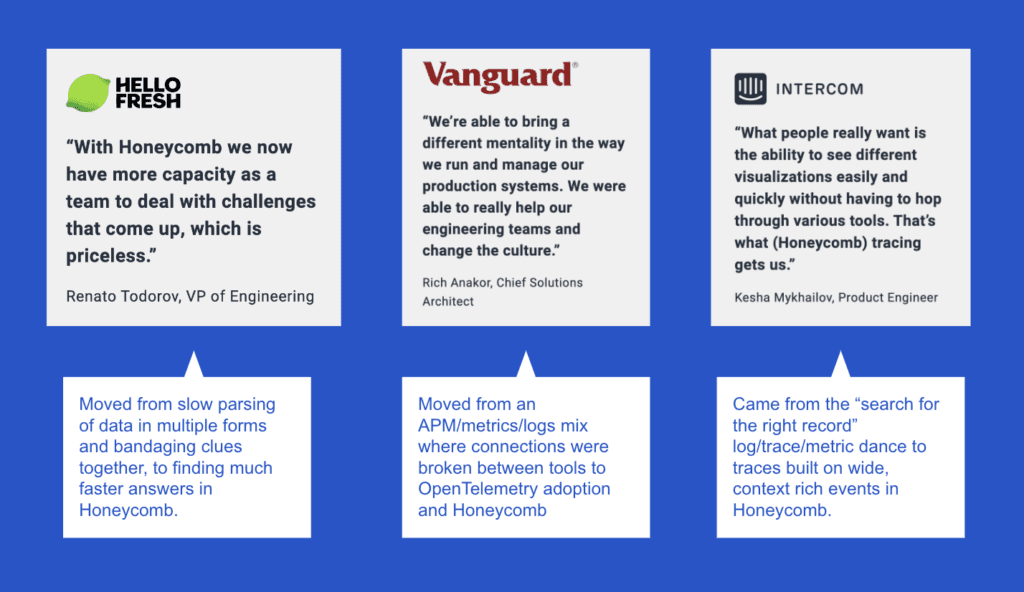
This shift makes developer teams faster and frees them from worrying about overhead while shipping code. Notable examples include CCP Games, Intercom, HelloFresh, Vanguard, and Slack, where hundreds of engineers have experienced a positive transformation in both the richness of their instrumentation and their problem-solving efficiency.
End result: leveraging financial gains for a better user experience
Finally, the savings from this shift in your APM bill can be reinvested into a virtuous cycle of improving customer experiences. Rather than allocating a significant portion of any incremental cloud budget or new headcount to observability, resources can be redirected towards product enhancement. Eventually, observability spend aligns more closely with the value an application produces.
A striking real-world example that comes to mind is a leading compliance technology provider that reduced observability costs from 5% of total revenue to less than 1% by adopting modern observability practices with Honeycomb and attribute-rich events.
By cutting out billions of custom metric stores tied to high-cardinality infra and user context, switching them to OpenTelemetry attributes, and relying on Honeycomb to surface this data at the right time and place, the customer is cutting seven figures off their observability bill, removing pressure and freeing budget constraints to put toward a better product experience.
Conclusion
In a real-world example of this transformation, one of our leading customers in the compliance tech sector reduced observability costs from 5% of total revenue to less than 1% by adopting modern observability practices with Honeycomb and attribute-rich events.
By cutting out billions of custom metric stores tied to high-cardinality infra and user context, switching them to OpenTelemetry attributes, and relying on Honeycomb to surface this data at the right time and place for every developer without seat limits, the customer is cutting seven figures off their observability bill, relieving pressure and freeing budget to put toward a better product experience.
The transition of observability budget to Honeycomb represents a strategic pivot towards more scalable, cost-effective observability aligned with growth and innovation.
How can you proactively and practically overcome the cost-visibility tradeoff today? Getting started with Honeycomb and OpenTelemetry is free, of course—but you can also get an assessment of your APM bill to see if it would be worth it for your organization. Reach out through our Slack community or our website and begin your journey towards efficient and scalable observability today!
Related Posts
Introducing Relational Fields
Expanded fields allow you to more easily find interesting traces and learn about the spans within them, saving time for debugging and enabling more curiosity...
Real User Monitoring With a Splash of OpenTelemetry
You're probably familiar with the concept of real user monitoring (RUM) and how it's used to monitor websites or mobile applications. If not, here's the...
Transforming to an Engineering Culture of Curiosity With a Modern Observability 2.0 Solution
Relying on their traditional observability 1.0 tool, Pax8 faced hurdles in fostering a culture of ownership and curiosity due to user-based pricing limitations and an...