Honeycomb Supports Service Ownership
By Jessica Kerr | Last modified on June 21, 2022The software industry is moving toward teams that own the services they build. This concept encloses principles and possibilities from movements toward microservices, DevOps, Agile, and Project to Product. In these paradigms, a team of people delivers software that provides valued capabilities. These capabilities help customers get their work done, support business operations, or enable other software to do these. Writing code is only part of this; capabilities only work if the software is running in production. Service-ownership teams carry this responsibility.
To own production, a team needs visibility into production. Honeycomb recognizes service ownership and supports it.
“An individual can write software. Only a team can deliver it.” - Charity Majors, CTO
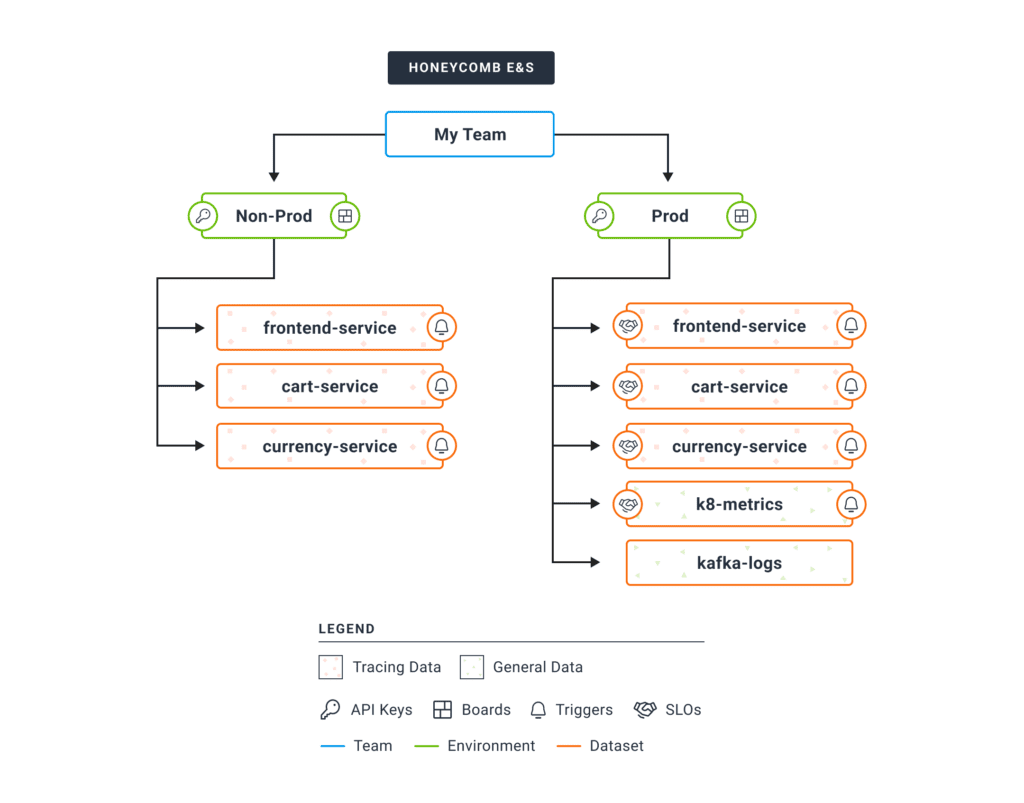
Services belong to teams, events belong to services
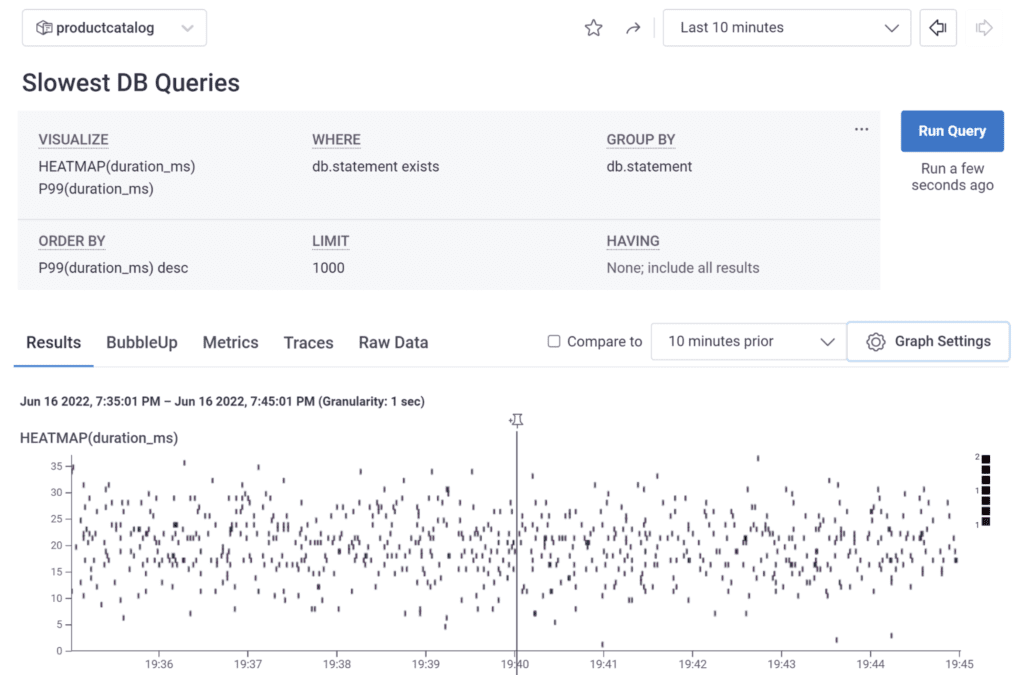
When software sends events into Honeycomb, these events divide naturally along service lines. Each team can graph what’s happening in their service, grouping by any number of fields (what happened, who did it, in what browser) in seconds. Teams get their own triggers, Service Level Objectives, and data schemas.
When every service runs smoothly, the software system runs smoothly, right? Haha. Most problems crop up along interfaces. As we separate into team-supported services, complexity hides in the connections. To own production, every team needs to see into all its connections.
Those connections are revealed in distributed traces. These are like structured, timed logs, connected into maps, annotated into stories, revealed in a waterfall view.
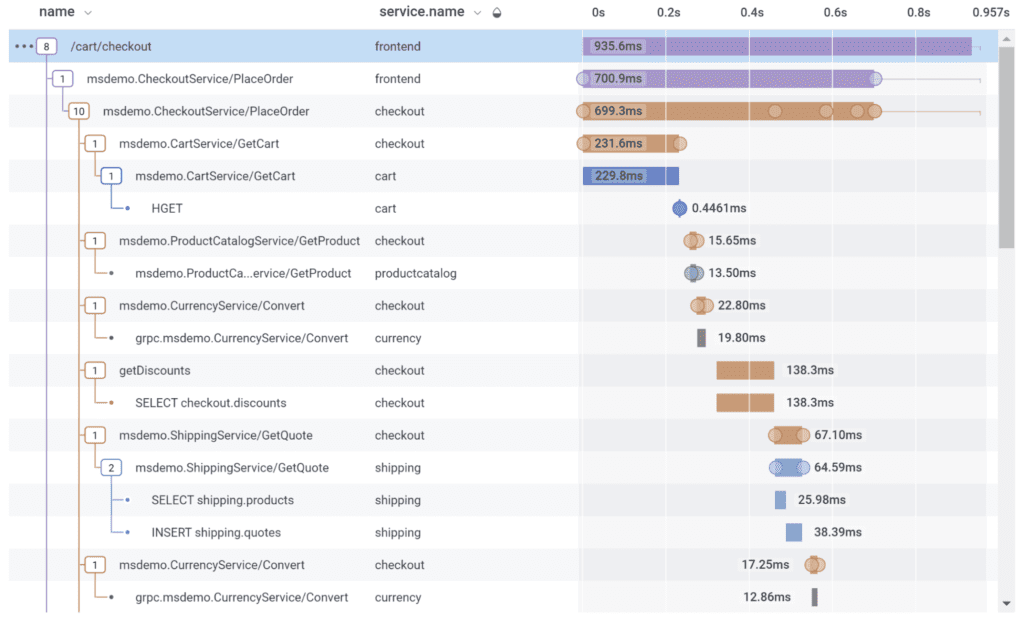
Traces cover connections between services
In Honeycomb, click any point of a graph to dig into an event represented there. But not just that event: the full trace of the request that triggered that event. Traces are not separated by service. Traces reveal the interconnections between services, in full detail.
Each team can see who calls their service, who their service calls, and so on. Get the full experience of a customer’s request.
Graphs also work across all services in an environment. Access every field available in any service’s events. Aggregate globally to measure the full customer experience.
Environments separate unrelated events
Send production events to Prod, test events to Test. Send events from your local development to a separate environment, with a separate API key.
Honeycomb constructs traces out of events for all the services in an environment. Separate environments keep test data distinct from production. Yet all services in production are linked; every trace shows the full context with connections between teams.
As of May 2022, all teams in Honeycomb declare environments. Within these, Honeycomb organizes data by service name, according to the OpenTelemetry standard `service.name` attribute. Honeycomb Classic works differently; next up is a migration feature that lets customers migrate their Classic data into the updated model.
Honeycomb changed our data organization (from keeping all services’ data in one set, with one schema) to support service-ownership teams, because we observed how our customers’ data works. As experts in observability, we recognize that dividing events at the service level, while supporting traces and graphs across all services, fits how teams work with observability. This draws clear boundaries that are not impermeable.
This is state-of-the-art observability. I encourage you to get into our free tier and see what insights you can learn from your own data! You never know the power of observability until you see it in action.
Related Posts
Introducing Relational Fields
Expanded fields allow you to more easily find interesting traces and learn about the spans within them, saving time for debugging and enabling more curiosity...
Real User Monitoring With a Splash of OpenTelemetry
You're probably familiar with the concept of real user monitoring (RUM) and how it's used to monitor websites or mobile applications. If not, here's the...
Transforming to an Engineering Culture of Curiosity With a Modern Observability 2.0 Solution
Relying on their traditional observability 1.0 tool, Pax8 faced hurdles in fostering a culture of ownership and curiosity due to user-based pricing limitations and an...