Our Favorite #chArt
By Rox Williams | Last modified on April 28, 2023Heatmaps are a beautiful thing. So are charts. Even better is that sometimes, they end up producing unintentional—or intentional, in the case of our happy o11ydays experiment—art.
Here’s a collection of our favorite #chArt from our Pollinators Slack community. Today would be a great time to join if you’re into good conversation about OpenTelemetry, Honeycomb-y stuff, SLOs, and obviously, art.
The raincloud
Pierre from Honeycomb posted this rain cloud.
It’s raining just over your house
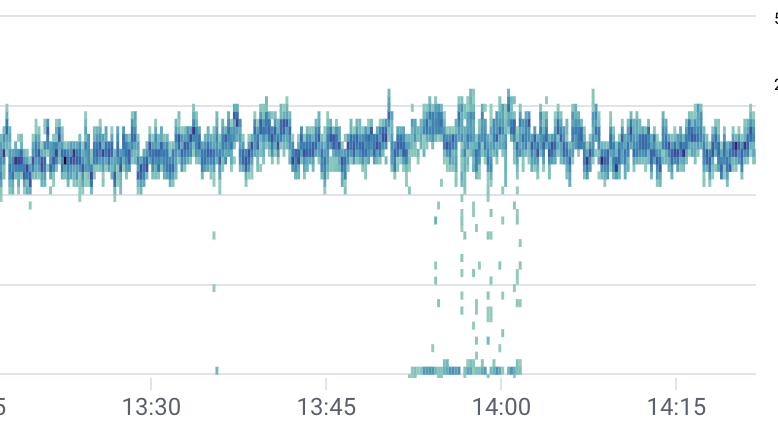
This reminds me of that scene in The Truman Show where the rain cloud literally follows Truman. Thank you Irving from Honeycomb for this submission!
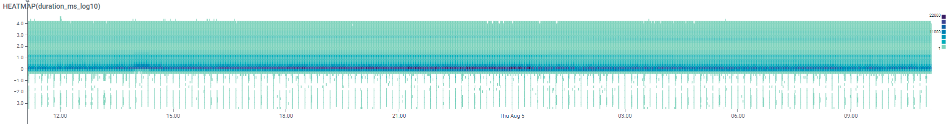
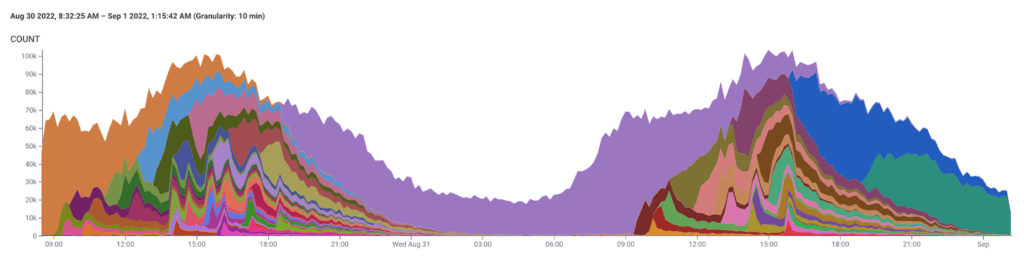
Sentience
“I think my heatmap is trying to become sentient and talk to me.” - Jean-Philippe Belanger. Not ominous or scary whatsoever. Nope.
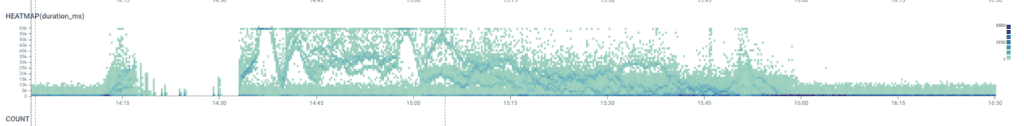
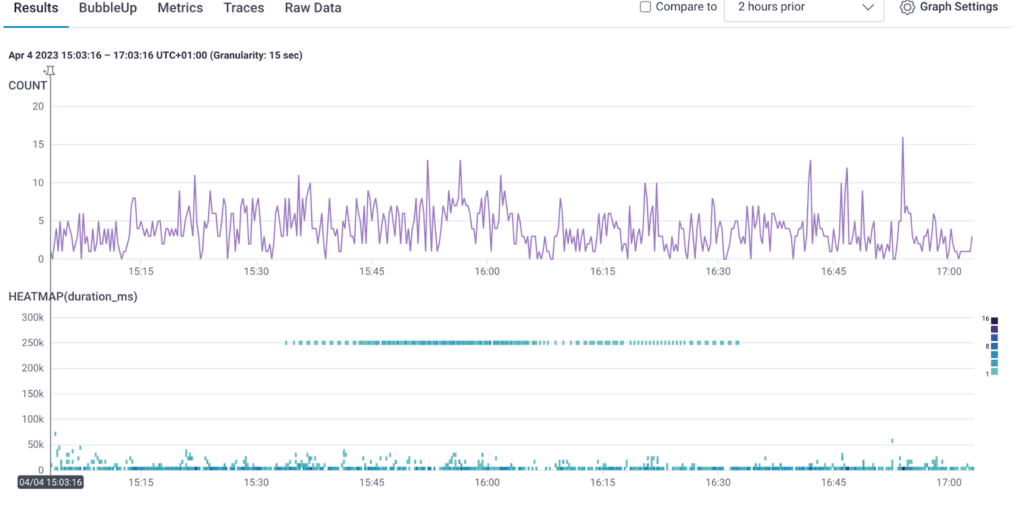
Mountains—so peaceful
“We had this nice mountain scene the other day” - Sean Hood.
Abstract Art
I’m pretty sure I made something similar when I first got a computer and discovered Microsoft Paint. Submitted by Blake Irvin.
Porg? Porg.
If we put a mouth on this one, it looks like a Porg!
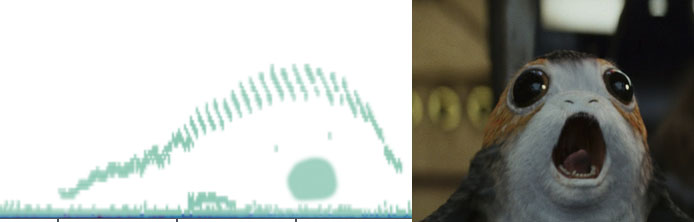
Submitted by Ryan King.
Predator
Another great one from Blake Irvin! Can you see it? Just needs the creepy mouth.
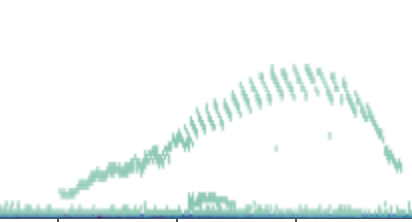
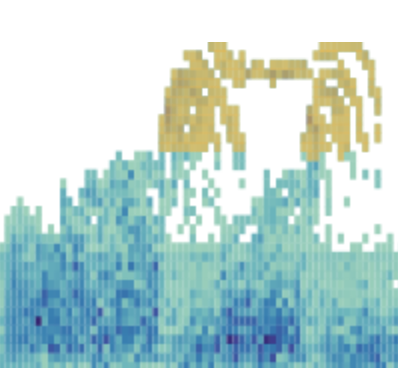
Waves
Otherworldly ocean waves. From Kesha Mykhailov: “Our front-end app versions in production—I think it’s beautiful.”
We think it’s beautiful too.
Haystack Rock

“Hey look, it’s Haystack Rock, but flipped!” - Irving from Honeycomb.
The Cylon

Thank you to Oli Lane for this one!
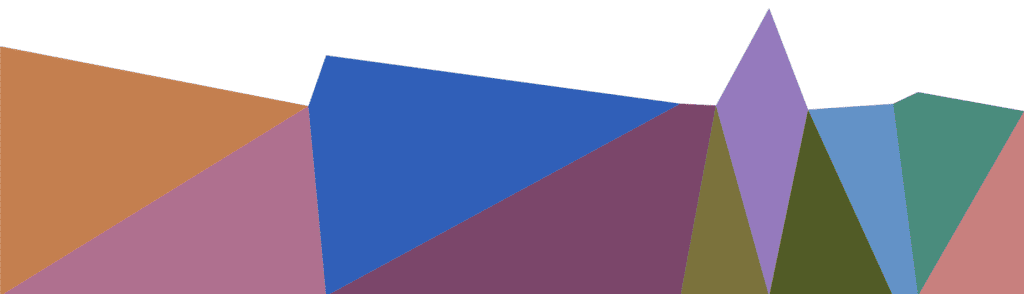
Line ChArt
Another shot from Irving. Swooning over the colors!
Honeyception
Jessitron created the Honeycomb logo inside a heatmap and it is SO GOOD.
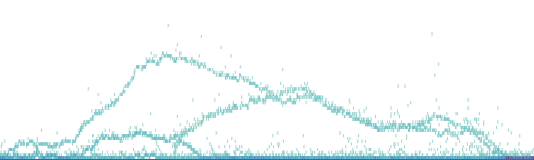
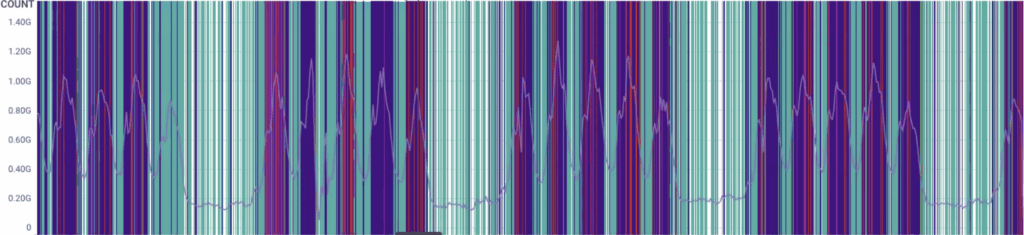
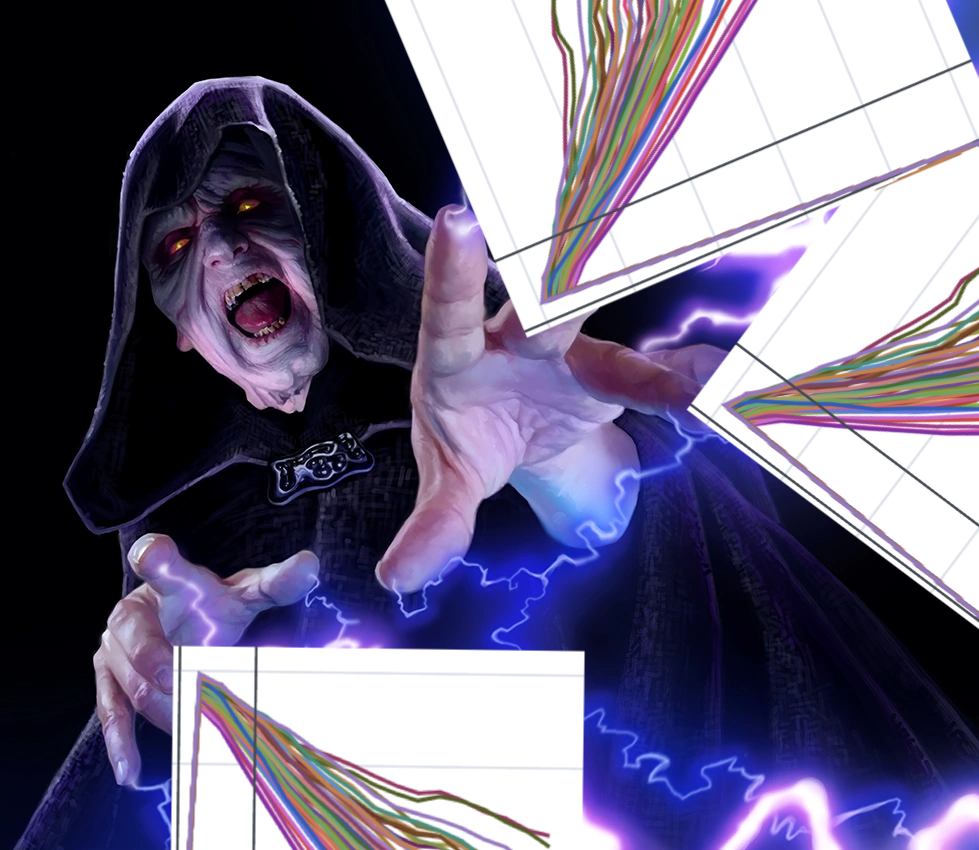
FORCE LIGHTNING
Finally, my personal favorite, left without comment (except for: thank you Reid).
That’s it for this year!
Hope you enjoyed this gallery of fine chArt. We’ll hopefully do this on a yearly basis, so if you want to participate and send some charts/heatmaps over, join us in our Pollinators Slack #chArt channel.
In the meantime, don’t forget that over the holidays, we released the happy o11ydays repo where you can generate your own cool wintery heatmaps!
Related Posts
Observability, Telemetry, and Monitoring: Learn About the Differences
Over the past five years, software and systems have become increasingly complex and challenging for teams to understand. A challenging macroeconomic environment, the rise of...
Introducing Honeycomb for Frontend Observability: Get the Data You Need for Actionable Customer Experience Improvements
Honeycomb for Frontend Observability gives frontend developers the ability to quickly identify opportunities for optimization within their web app. This starts with better OpenTelemetry instrumentation,...
Introducing Relational Fields
Expanded fields allow you to more easily find interesting traces and learn about the spans within them, saving time for debugging and enabling more curiosity...