
Michael Perez
More posts from Michael Perez
Direct-to-consumer companies generate a wealth of raw transactional data that needs to be refined into metrics and dimensions that founders and operators can interpret on a dashboard.
If you’re the founder of an e-commerce startup, there’s a pretty good chance you’re using a platform like Shopify, BigCommerce or WooCommerce, and one of the dozens of analytics extensions like RetentionX, Sensai metrics or ProfitWell that provide off-the-shelf reporting.
At a high level, these tools are excellent for helping you understand what’s happening in your business. But in our experience, we’ve learned that you’ll inevitably find yourself asking questions that your off-the-shelf extensions simply can’t answer.
Here are a couple of common problems that you or your data team may encounter with off-the-shelf dashboards:
- Charts are typically based on a few standard dimensions and don’t provide enough flexibility to examine a certain segment from different angles to fully understand them.
- Dashboards have calculation errors that are impossible to fix. It’s not uncommon for such dashboards to report the pre-discounted retail amount for orders in which a customer used a promo code at checkout. In the worst cases, this can lead founders to drastically overestimate their customer lifetime value (LTV) and overspend on marketing campaigns.
Even when founders are fully aware of the shortcomings of their data, they can find it difficult to take decisive action with confidence.
We’re generally big fans of plug-and-play business intelligence tools, but they won’t scale with your business. Don’t rely on them after you’ve outgrown them.
Evolving your startup’s data strategy
Building a data stack costs much less than it did a decade ago. As a result, many businesses are building one and harnessing the compounding value of these insights earlier in their journey.
But it’s no trivial task. For early-stage founders, the opportunity cost of any big project is immense. Many early-stage companies find themselves in an uncomfortable situation — they feel paralyzed by a lack of high-fidelity data. They need better business intelligence (BI) to become data driven, but they don’t have the resources to manage and execute the project.
This leaves founders with a few options:
- Hire a seasoned data leader.
- Hire a junior data professional and supplement them with experienced consultants.
- Hire and manage experienced consultants directly.
All of these options have merits and drawbacks, and any of them can be executed well or poorly. Many companies delay building a data warehouse because of the cost of getting it right — or the fear of messing it up. Both are valid concerns!
Start by identifying your critical metrics
Our retail modeling checklist is a simple but effective resource to help stakeholders agree on the definitions of critical enterprise metrics, such as net revenue and gross margin. The checklist should guide early discussions and discovery into edge cases that materially affect the critical metrics.
Even if you’re starting from scratch without any SQL templates, this checklist can help ensure that your SQL developer is aligned with the stakeholders who will be consuming the data.
Defining enterprise metrics is a critical step that’s often overlooked because the definitions seem obvious. Most of your employees may be familiar with these enterprise metrics at a surface level, but that doesn’t mean they fully understand them. The details matter.
If you asked your employees these questions, would they all give the same answer?
- Is the price of shipping included in gross revenue?
- When do gift card sales count toward revenue — at the time of sale or redemption?
In many organizations, employees don’t give consistent answers because:
- The metrics have never been explicitly defined.
- There was no concerted effort to educate employees on the definitions.
Data literacy is often synonymized with analytical aptitude, but they aren’t the same thing. Even analytics-savvy employees are likely to have data literacy challenges that they aren’t aware of. In many cases, your data-driven employees will be most affected by data illiteracy, because they’ll be the ones consuming data, generating insights and making decisions — all without realizing what they don’t know.
Why data details matter
These blind spots in data literacy cause errors in interpretation. They’re small at first, so it can be tempting to sweep them under the rug.
For example, a known error might be ignored because it only causes a couple of percentage points of error at an aggregate level. This reasoning overlooks the fact that errors are rarely distributed evenly. Any error is bound to affect some customers, products or geographies more than others. It’s common to have small errors in both directions that can wash out on average but amplify each other at a more granular level.
Most important operational decisions are made on a relative basis — not an aggregate level. When deciding which products to prune, or which marketing strategies to double down on, you’re generally making comparisons between dozens or hundreds of observations, not thousands.
Questions that deal in relative comparisons are subject to greater error:
- How well is product A selling relative to B?
- How much higher was LTV for customer segment C versus segment D last month?
Be aware of these subtle risks:
- The finer you slice your data, the greater the error grows relative to the signal.
- The more comparisons you make, the more likely it is that the biggest differences are being amplified by noise rather than a true signal.
Noise is only part of the problem. There are also cases where the error creates sustained bias. Organizations that gloss over the details of their enterprise metrics risk making egregiously bad decisions without even realizing it.
Imagine an e-commerce company that failed to consider gift card purchases in its definition of gross revenue. If gift card purchases are treated the same as other purchases, they’ll typically double-count toward revenue. Off-the-shelf BI tools — Facebook and Google Ads included — typically count gift card purchases as revenue. Then when the gift cards are redeemed as a payment option, they count toward revenue again, resulting in inflated LTVs and unrealistic cost per actions (CPAs).
Even companies that have correctly anticipated this issue can fall victim to more subtle problems. Many companies don’t recognize revenue for gift card purchases until the gift cards are redeemed. If a marketer uses gross revenue to measure the results of a holiday gifting campaign that yielded a large uptick in gift card purchases, they may write the campaign off as a failure prematurely. The same marketer may have an inflated opinion of the lower-funnel paid marketing campaigns that ran in January, when the gift card recipients spent their balances.
Not all issues are so subtle. A shortage of data governance and data literacy can cause avoidable headaches among your organization’s leaders.
You don’t want to end up in a situation where your finance dashboards and your e-commerce dashboards show inconsistent week-over-week revenue growth, and your senior leaders don’t know why. These misunderstandings cause friction in the form of wasted time and loss of trust. They also make it more difficult for employees across teams to collaborate effectively.
If this sounds eerily familiar, you’re not alone. Seasoned data leaders should have strong opinions on the best ways to mitigate these issues, but they’ll need buy-in from founders and other leaders to invest in the organizational overhead required to create a data-driven company.
Two common data mistakes
We’ve seen many companies embark on their first big data project only to skip some critically important steps and immediately start creating tech debt. Often, these projects start with an innocuous request like, “replicate this RetentionX dashboard in Looker.”
Many novice engineers or contractors make the mistake of focusing on short-term deliverables at the expense of scalable architecture.
We’ve seen a few versions of this mistake. Generally, the issues begin when:
- The metrics or dimensions are created too coarsely.
- The metrics are created too far downstream.
What happens when metrics are created at the wrong level of granularity (i.e., grain)
The grain matters because it’s always possible to aggregate a metric to a higher level (i.e., coarser grain) downstream, but you can’t split it up into a lower level (i.e., finer grain) than it was originally created.
If you create gross revenue at an order grain, it’s very easy to aggregate it to a customer grain and measure average gross revenue LTV by cohort, but it’ll be impossible to measure what percentage of gross revenue is attributable to any given product. That’s because products exist at the order line grain, which is a finer grain than order.
Many companies make this mistake once, then “fix” the issue by copying and pasting their gross revenue calculation in multiple places, repeating it throughout their codebase. This is an anti-pattern that’s guaranteed to cause bugs down the road because metric definitions are never set in stone. They’re constantly being reevaluated and updated based on changes to the business.
Imagine that your company starts taking backorders for products that are out of stock, and you need to update your gross revenue definition with new logic. An engineer will struggle to make this update if their architecture has gross revenue calculations copied and pasted multiple times throughout their codebase and their BI tool. They’ll also find it difficult to test each occurrence for accuracy.
What happens when an engineer creates metrics too far downstream
BI tools like Looker make it easy to reference your raw data directly through their tool and start creating metrics and dimensions using their proprietary web user interfaces (UIs) and languages. Looker is a great example of this — just because you can use LookML, Looker’s proprietary language, to create your enterprise business metrics doesn’t mean you should.
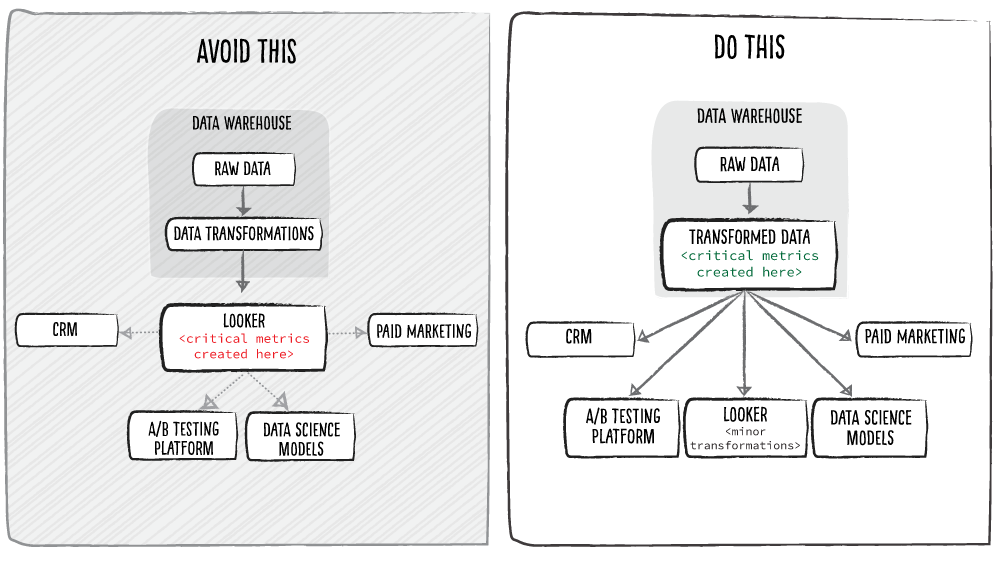
When you create critical metrics in Looker and make that your source of truth, it’s hard to get the truth out. Data warehouses support a robust set of integrations, but BI tools don’t. Teams that make this mistake typically create data silos or brittle integrations. Avoid this by creating your enterprise metrics in your data warehouse and sending them to your BI tools and other applications.
In general, you’ll want enterprise metrics to be defined as far upstream as possible so they can be referenced by any software application, vendor or internal use case.
You also don’t want to be stuck in a situation where your enterprise metrics are defined in someone else’s proprietary coding language, leaving you very little leverage when negotiating your next contract.
Takeaways and next steps
If we can leave you with one takeaway, it’s that many common issues that lead to tech debt are avoidable if you have the right resources and practices. Non-technical early-stage founders can’t be expected to see every potential issue ahead and should seek advice from experienced practitioners. Advisers can be mentors, employees, former colleagues or even investors.


Comment