
The Scrum Master tactics series are a series of articles in which I write about and explore contemporary techniques that will aid you in your journey as a Scrum Master. The tactics explained stem from my personal experience as a Scrum Master which I accumulated over the years in working with many different teams and contexts. Though each of these tactics have value in their own way, I let you be the judge on assessing this value given your context and apply these tactics whenever you deem appropriate.
Have you ever found your Development Team in a state of downright frustration due to organizational impediments that are outside it’s span of control? Is your Scrum Team desperately seeking help within the organization to resolve these impediments but to little or no avail? How do you muster up the effort as a Scrum Master to keep on trying to solve these ‘out-of-control’ impediments, while keeping frustration of the team to a minimum and sustain a high morale all at the same time?
Enter ‘Waste charting’: the activity of tracking the effective and wasteful efforts of your team
Facilitating the Development Team to be as much as productive as they can be, is an important item on your agenda, dear Scrum Master. Your effort should allow the team to focus on delivering the next increment in the best way they can, without being distracted or bogged down with issues beyond their control. The concept of ‘waste charting’ allows you to gain insight on how the Development Team experiences their own effectiveness during a Sprint. Waste charting is the act of assessing which activities during a Sprint are effective and contributing to the Sprint Goal (i.e. valuable), as opposed to activities that might be counterproductive or hampering delivery (i.e. waste). This insight forms the base on which you can plot subsequent actions to mitigate that waste and letting the team become more productive.
So how do you employ Waste Charting?
I once worked with a Development Team who suffered from poor internet connectivity, rendering them to be ‘idle’ for several hours a day. Being idle left the team frustrated because they could not get any work done since they relied heavily on that internet connectivity. Despite many conversations with management to resolve this connectivity-impediment, our issue was not resolved, nor acted upon. In need of finding a way to change this situation, I employed waste charting in the following steps.
1) I asked all team members to log all the time they found themselves unable to do their work in a Sprint, due to not having a proper Internet connection;
2) Near the end of a Sprint, I collated all hours of the team members and calculated the amount of money that was wasted in total, by accumulating the total hours and multiply them with the average tariff of the team members;
3) As a next step I surfed to www.autotrack.nl (a Dutch website where you can purchase used cars) and fictively ‘bought’ a car for the calculated amount;
4) Lastly, I would print out my selected car and wrote above it: “In Sprint X, we burned this car”. Below is a picture of the board we used as our Sprint Backlog.
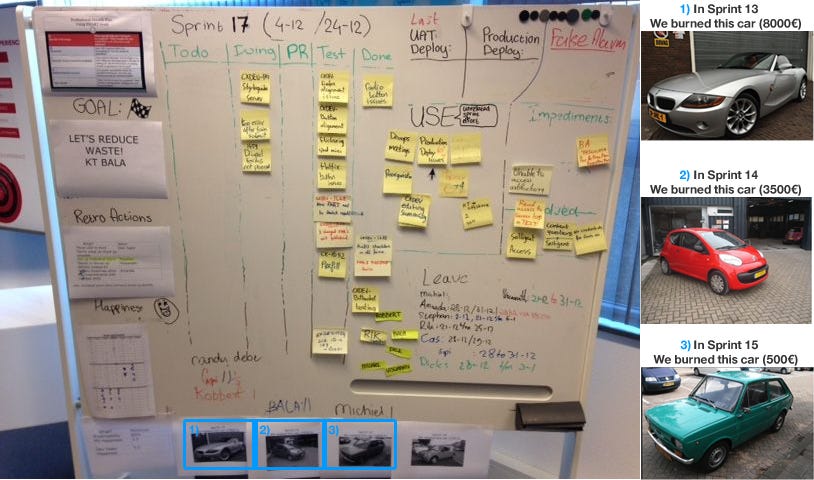
A photo taken at Sprint 17. On the bottom are the cars that were ‘burned’ previous Sprints. On the right of this picture I’ve provided an augmented version of the cars in question.
Each and every time our stakeholders, management and the outside organization would pay our team a visit, I was quite resilient in showing them our board, leaving no opportunity unattended to show what particular car we burned in that Sprint, complimented with a direct question to help us solve the connectivity problem. By making the wasted effort really explicit and tangible by means of showing off the cars we ‘burned’, the organization got a better understanding of the impact this waste had and prioritized solving the connectivity problem on their agenda. Though it took some Sprints to create this newfound awareness, we saw a reduction in our waste in consecutive Sprints over time, rendering us in the end with burning a third hand car which belonged to a lovely grandma at the price of less than 500 euro.
In conclusion
Fostering understanding with all parties involved when solving impediments is a critical factor to allow that impediment being resolved. In the anecdote you just read, the analogy of ‘burning cars’ really drove home the critical importance of solving the connectivity impediment, as it proved to be a real tangible example for everyone and that helped creating awareness on the severity of the issue. The gathering of data over multiple Sprints created the urgency to mitigate our situation; burning luxury cars each and every Sprint created the needed attention to start taking action.
As a final suggestion: don’t limit yourself and the team by just burning those cars. Find something that really catches the attention of your organization. You could be burning boats, real estate or even pick a nice holiday destination each Sprint with your calculated amount of waste. Reveal that data and leave no opportunity unattended to substantiate your case and help your team to resolve those impediments!
If you have employed waste charting in the past, or if you are just starting out experimenting with this technique, I would love to hear about your experiences. Don’t be a stranger and reach out, let’s discuss!